

Paper Menu >>
Journal Menu >>
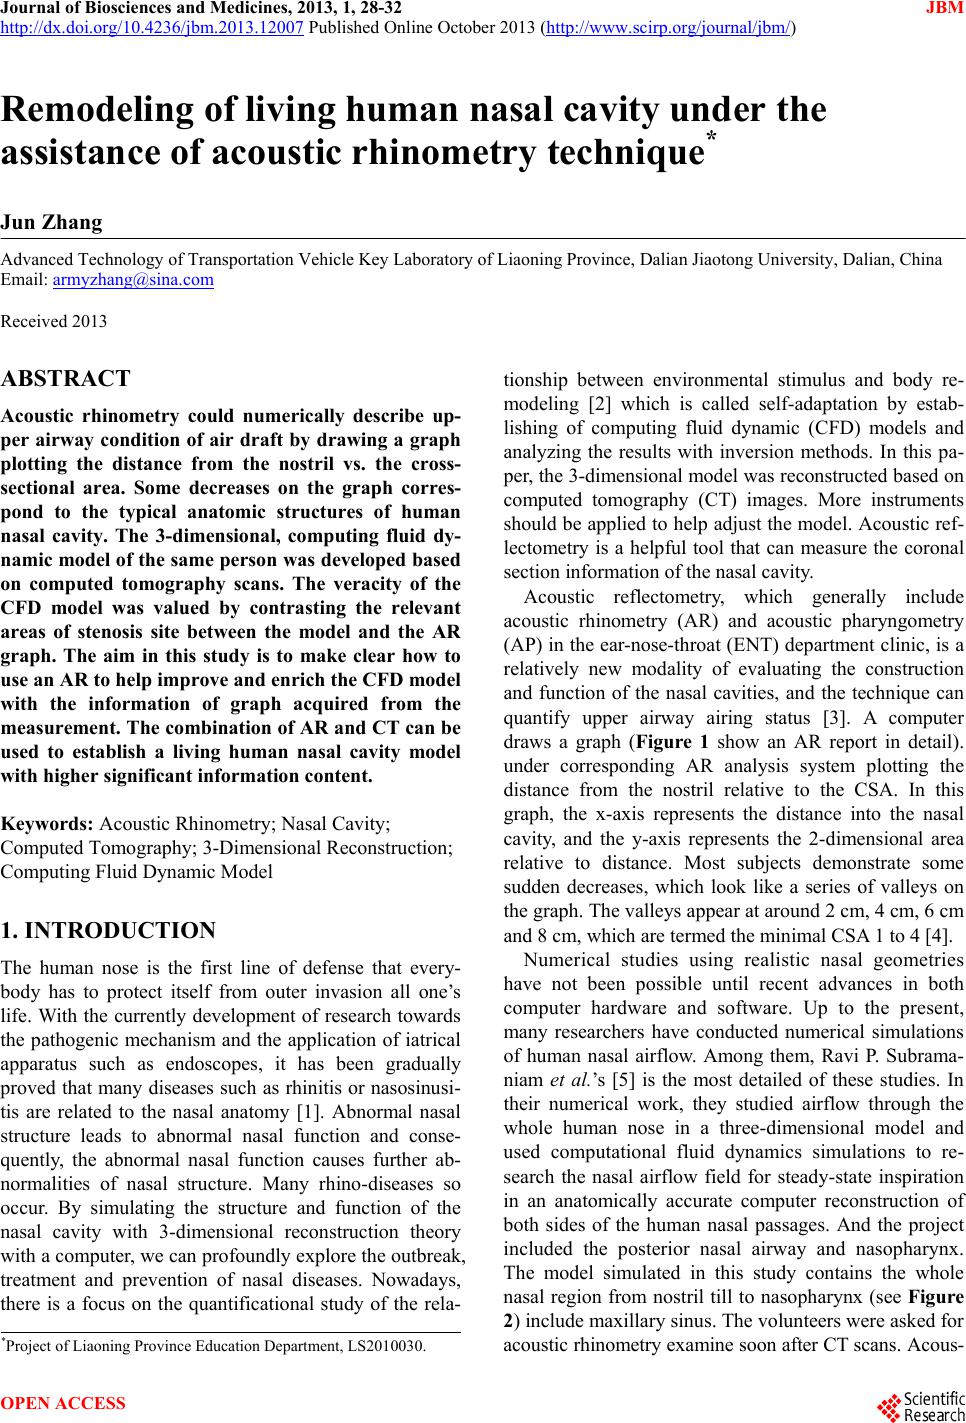 Journal of Biosciences and Medicines, 2013, 1, 28-32 JBM http://dx.doi.org/10.4236/jbm.2013.12007 Published Online October 2013 (http://www.scirp.org/journal/jbm/) OPEN ACCESS Remodeling of livin g human nasal cavity under the assistance of acoustic rhinometry technique* Jun Zhang Advanced Technology of Transportation Vehicle Key Laboratory of Liaoning Province, Dalian Jiaotong University, Dalian, China Email: [email protected] Received 2013 ABSTRACT Acoustic rhinometry could numerically describe up- per airway condition of air draft by drawing a graph plotting the distance from the nostril vs. the cross- sectional area. Some d ecreases on the graph corres- pond to the typical anatomic structures of human nasal cavity. The 3-dimensional, computing fluid dy- namic model of the same person was developed based on computed tomography scans. The veracity of the CFD model was valued by contrasting the relevant areas of stenosis site between the model and the AR graph. The aim in this study is to make clear how to use an AR to help improve and enrich the CFD model with the information of graph acquired from the measurement. The combination of AR and CT can be used to establish a living human nasal cavity model with higher significant information content. Keywords: Acoustic Rhinometry; Nasal Cavity; Computed Tomography; 3-Dimensional Reconstruction; Computing Fluid Dynamic Model 1. INTRODUCTION The human nose is the first line of defense that every- body has to protect itself from outer invasion all one’s life. With the currently development of research towards the pathogenic mechanism and the application of iatrical apparatus such as endoscopes, it has been gradually proved that many diseases such as rhinitis or nasosinusi- tis are related to the nasal anatomy [1]. Abnormal nasal structure leads to abnormal nasal function and conse- quently, the abnormal nasal function causes further ab- normalities of nasal structure. Many rhino-diseases so occur. By simulating the structure and function of the nasal cavity with 3-dimensional reconstruction theory with a computer, we can profoundly explore the outbreak, treatment and prevention of nasal diseases. Nowadays, there is a focus on the quantificational study of the rela- tionship between environmental stimulus and body re- modeling [2] which is called self-adaptation by estab- lishing of computing fluid dynamic (CFD) models and analyzing the results with inversion methods. In this pa- per, the 3-dimensional model was reconstructed based on computed tomography (CT) images. More instruments should be applied to help adjust the model. Acoustic ref- lectometry is a helpful tool that can measure the coronal section information of the nasal cavity. Acoustic reflectometry, which generally include acoustic rhinometry (AR) and acoustic pharyngometry (AP) i n the ear-nose-throat (ENT) department clinic, is a relatively new modality of evaluating the construction and function of the nasal cavities, and the technique can quantify upper airway airing status [3]. A computer draws a graph (Figure 1 show an AR report in detail). under corresponding AR analysis system plotting the distance from the nostril relative to the CSA. In this graph, the x-axis represents the distance into the nasal cavity, and the y-axis represents the 2-dimensional area relative to distance. Most subjects demonstrate some sudden decreases, which look like a series of valleys on the graph. The valleys appear at ar ound 2 cm, 4 cm, 6 cm and 8 cm, which are termed the minimal CSA 1 to 4 [4]. Numerical studies using realistic nasal geometries have not been possible until recent advances in both computer hardware and software. Up to the present, many researchers have conducted numerical simulations of human nasal airflow. Among them, Ravi P. Subrama- niam et al.’s [5] is the most detailed of these studies. In their numerical work, they studied airflow through the whole human nose in a three-dimensional model and used computational fluid dynamics simulations to re- search the nasal airflow field for steady-state inspiration in an anatomically accurate computer reconstruction of both sides of the human nasal passages. And the project included the posterior nasal airway and nasopharynx. The model simulated in this study contains the whole nasal region from nostril till to nasopharynx (see Figure 2) include maxillary sinus. The volunteers were asked for acoustic rhinometry examine soon af ter CT scans. Acous- *Project of Liaoning Province Education Department, LS2010030. 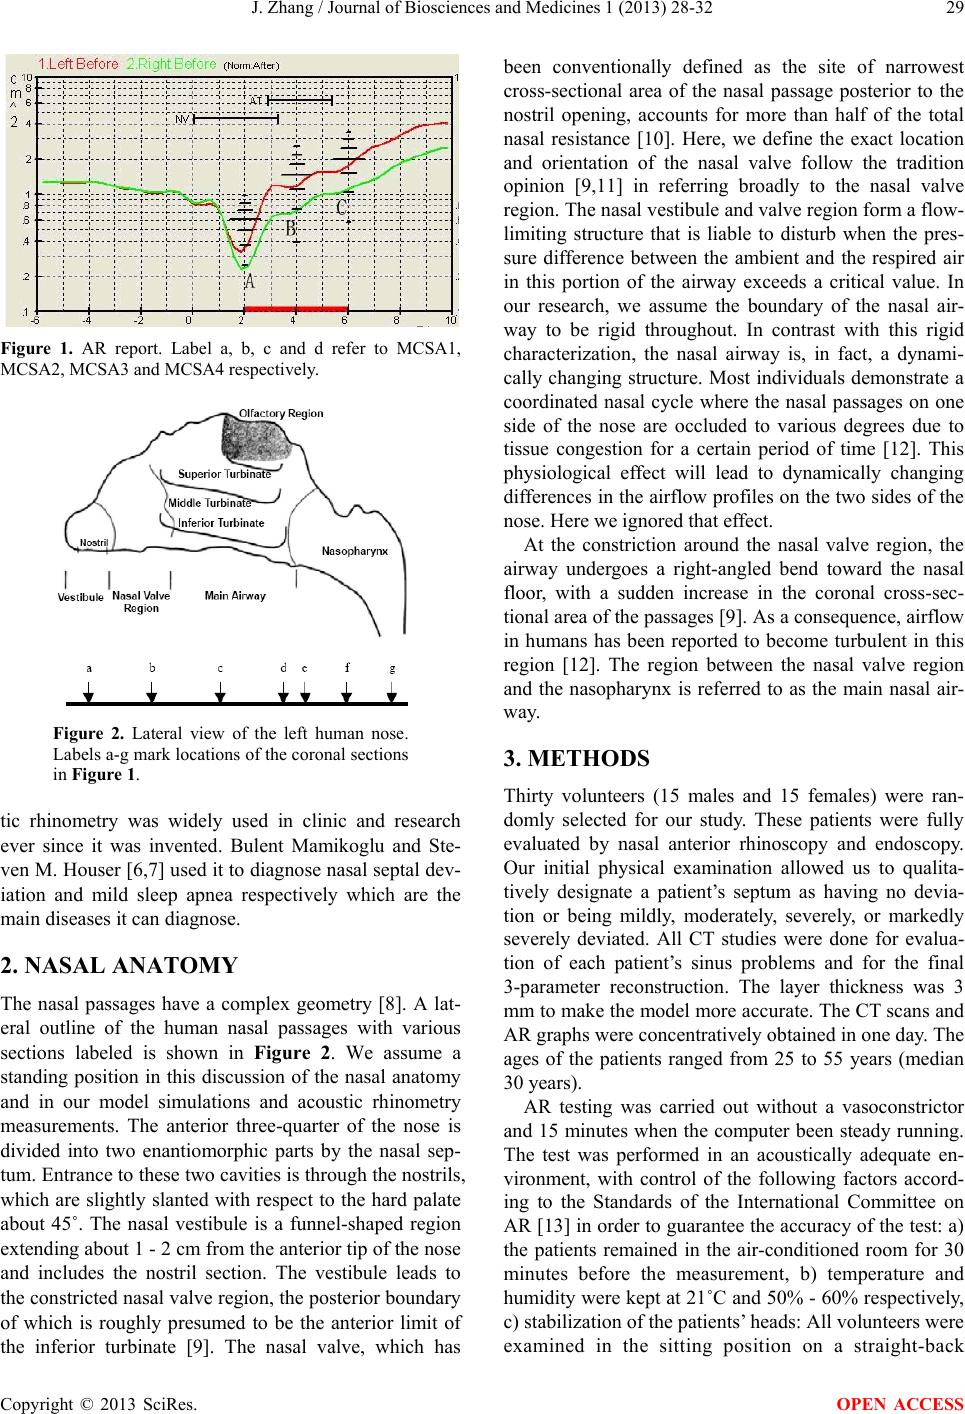 J. Zhang / Journal of Biosciences and Medicines 1 (2013) 28-32 Copyright © 2013 SciRes. OPEN ACCESS 29 Figure 1. AR report. Label a, b, c and d refer to MCSA1, MCSA2, MCSA3 and MCSA4 respectively. Figure 2. Lateral view of the left human nose. Labels a-g mark locations of the coronal sections in Figu re 1. tic rhinometry was widely used in clinic and research ever since it was invented. Bulent Mamikoglu and Ste- ven M. Houser [6,7] used it to diagnose nasal septal dev- iation and mild sleep apnea respectively which are the main diseases it can diagnose. 2. NASAL ANATOMY The nasal passages have a complex geometry [8]. A lat- eral outline of the human nasal passages with various sections labeled is shown in Fig ure 2. We assume a standing position in this discussion of the nasal anatomy and in our model simulations and acoustic rhinometry measurements. The anterior three-quarter of the nose is divided into two enantiomorphic parts by the nasal sep- tum. Entrance to these two cavities is through the nostrils, which are slightly slanted with respect to the hard palate about 45˚. The nasal vestibule is a funnel-shaped region extending abou t 1 - 2 cm from the anterior tip of the nose and includes the nostril section. The vestibule leads to the constricted nasal valve region, the posterior boundary of which is roughly presumed to be the anterior limit of the inferior turbinate [9]. The nasal valve, which has been conventionally defined as the site of narrowest cross-sectional area of the nasal passage posterior to the nostril opening, accounts for more than half of the total nasal resistance [10]. Here, we define the exact location and orientation of the nasal valve follow the tradition opinion [9,11] in referring broadly to the nasal valve region. The nasal vestibule and valve region form a flow- limiting structure that is liable to disturb when the pres- sure difference between the ambient and the respired air in this portion of the airway exceeds a critical value. In our research, we assume the boundary of the nasal air- way to be rigid throughout. In contrast with this rigid characterization, the nasal airway is, in fact, a dynami- cally changing structure. Most individuals demonstrate a coordinated nasal cycle where the nasal passages on one side of the nose are occluded to various degrees due to tissue congestion for a certain period of time [12]. This physiological effect will lead to dynamically changing differences in the airflow profiles on the two sides of the nose. Here we ignored that effect. At the constriction around the nasal valve region, the airway undergoes a right-angled bend toward the nasal floor, with a sudden increase in the coronal cross-sec- tional area of the passages [9]. As a consequence, airflow in humans has been reported to become turbulent in this region [12]. The region between the nasal valve region and the nasopharynx is referred to as the main nasal air- way. 3. METHODS Thirty volunteers (15 males and 15 females) were ran- domly selected for our study. These patients were fully evaluated by nasal anterior rhinoscopy and endoscopy. Our initial physical examination allowed us to qualita- tively designate a patient’s septum as having no devia- tion or being mildly, moderately, severely, or markedly severely deviated. All CT studies were done for evalua- tion of each patient’s sinus problems and for the final 3-parameter reconstruction. The layer thickness was 3 mm to make the model more accurate. The CT scans and AR graphs were concentratively obtained in one day. The ages of the patients ranged from 25 to 55 years (median 30 years). AR testing was carried out without a vasoconstrictor and 15 minutes when the computer been steady running. The test was performed in an acoustically adequate en- vironment, with control of the following factors accord- ing to the Standards of the International Committee on AR [13] in order to guarantee the accuracy of the test: a) the patients remained in the air-conditioned room for 30 minutes before the measurement, b) temperature and humidity were kep t at 21˚C and 50% - 6 0% respectively, c) stabilization of the patients’ heads: All volunteers were examined in the sitting position on a straight-back 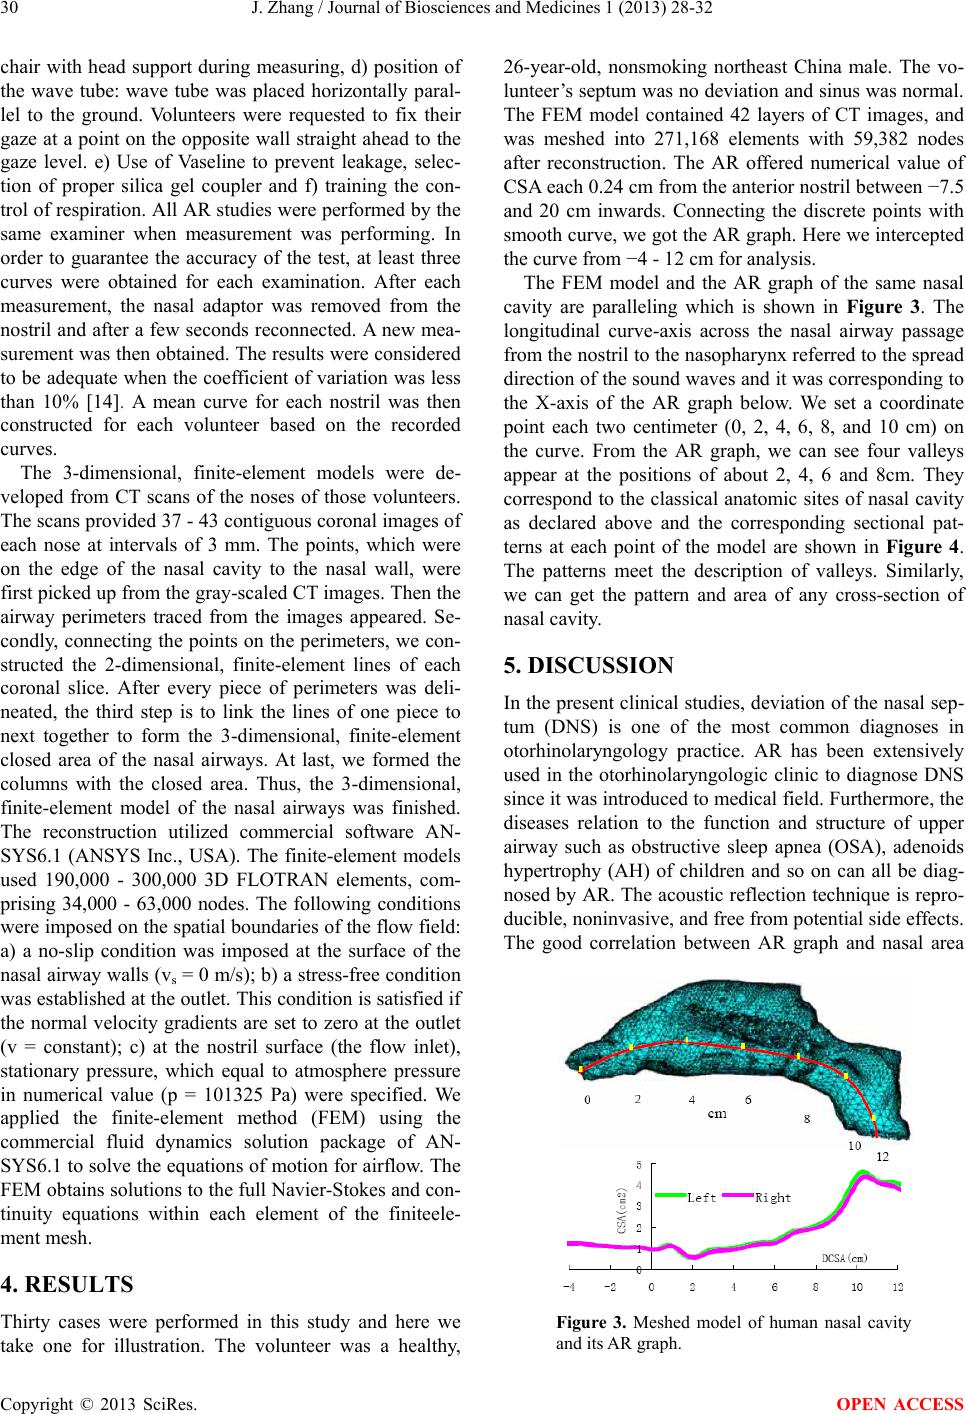 J. Zhang / Journal of Biosciences and Medicines 1 (2013) 28-32 Copyright © 2013 SciRes. OPEN ACCESS 30 chair with head support during measuring, d ) position of the wave tube: wave tube was placed horizontally paral- lel to the ground. Volunteers were requested to fix their gaze at a point on the opposite wall straight ahead to the gaze level. e) Use of Vaseline to prevent leakage, selec- tion of proper silica gel coupler and f) training the con- trol of respiration. All AR studies were performed by the same examiner when measurement was performing. In order to guarantee the accuracy of the test, at least three curves were obtained for each examination. After each measurement, the nasal adaptor was removed from the nostril and after a few seconds reconnected. A new mea- surement was then obtained. The results were considered to be adequate when the coefficient of variation was less than 10% [14]. A mean curve for each nostril was then constructed for each volunteer based on the recorded curves. The 3-dimensional, finite-element models were de- veloped from CT scans of the noses of those volunteers. The scans provided 37 - 43 contiguous coronal images of each nose at intervals of 3 mm. The points, which were on the edge of the nasal cavity to the nasal wall, were first picked up from the gray-scaled CT images. Then the airway perimeters traced from the images appeared. Se- condly, connecting the points on the perimeters, we con- structed the 2-dimensional, finite-element lines of each coronal slice. After every piece of perimeters was deli- neated, the third step is to link the lines of one piece to next together to form the 3-dimensional, finite-element closed area of the nasal airways. At last, we formed the columns with the closed area. Thus, the 3-dimensional, finite-element model of the nasal airways was finished. The reconstruction utilized commercial software AN- SYS6.1 (ANSYS Inc., USA). The finite-element models used 190,000 - 300,000 3D FLOTRAN elements, com- prising 34,000 - 63,000 nodes. The following conditions were imposed on the spatial boundaries of the flow field: a) a no-slip condition was imposed at the surface of the nasal airway walls (vs = 0 m/s); b) a str ess-free condition was established at the outlet. This condition is satisfied if the normal velocity gradients are set to zero at the outlet (v = constant); c) at the nostril surface (the flow inlet), stationary pressure, which equal to atmosphere pressure in numerical value (p = 101325 Pa) were specified. We applied the finite-element method (FEM) using the commercial fluid dynamics solution package of AN- SYS6.1 to solve the equations of motion for airflow. The FEM obtains solutions to th e full Navier-Stokes and con- tinuity equations within each element of the fin iteele- ment mesh. 4. RESULTS Thirty cases were performed in this study and here we take one for illustration. The volunteer was a healthy, 26-year-old, nonsmoking northeast China male. The vo- lunteer’s septum was no deviation and sinus was normal. The FEM model contained 42 layers of CT images, and was meshed into 271,168 elements with 59,382 nodes after reconstruction. The AR offered numerical value of CSA each 0.24 cm from the anterior nostril between −7.5 and 20 cm inwards. Connecting the discrete points with smooth curve, we got the AR graph. Here we intercepted the curve from −4 - 12 cm for analysis. The FEM model and the AR graph of the same nasal cavity are paralleling which is shown in Figure 3. The longitudinal curve-axis across the nasal airway passage from the nostril to the nasopharynx referred to the spread direction of the sound waves and it was corresponding to the X-axis of the AR graph below. We set a coordinate point each two centimeter (0, 2, 4, 6, 8, and 10 cm) on the curve. From the AR graph, we can see four valleys appear at the positions of about 2, 4, 6 and 8cm. They correspond to the classical anatomic sites of nasal cavity as declared above and the corresponding sectional pat- terns at each point of the model are shown in Figure 4. The patterns meet the description of valleys. Similarly, we can get the pattern and area of any cross -section of nasal cavity. 5. DISCUSSIO N In the present clinical studies, d eviation of the nasal sep- tum (DNS) is one of the most common diagnoses in otorhinolaryngology practice. AR has been extensively used in the otorhinolaryngologic clinic to diagnose DNS since it was introduced to medical field. Furthermore, th e diseases relation to the function and structure of upper airway such as obstructive sleep apnea (OSA), adenoids hypertrophy (AH) of children and so on can all be diag- nosed by AR. The acoustic reflection technique is repro- ducible, noninvasive, and free from potential side effects. The good correlation between AR graph and nasal area Figure 3. Meshed model of human nasal cavity and its AR graph. 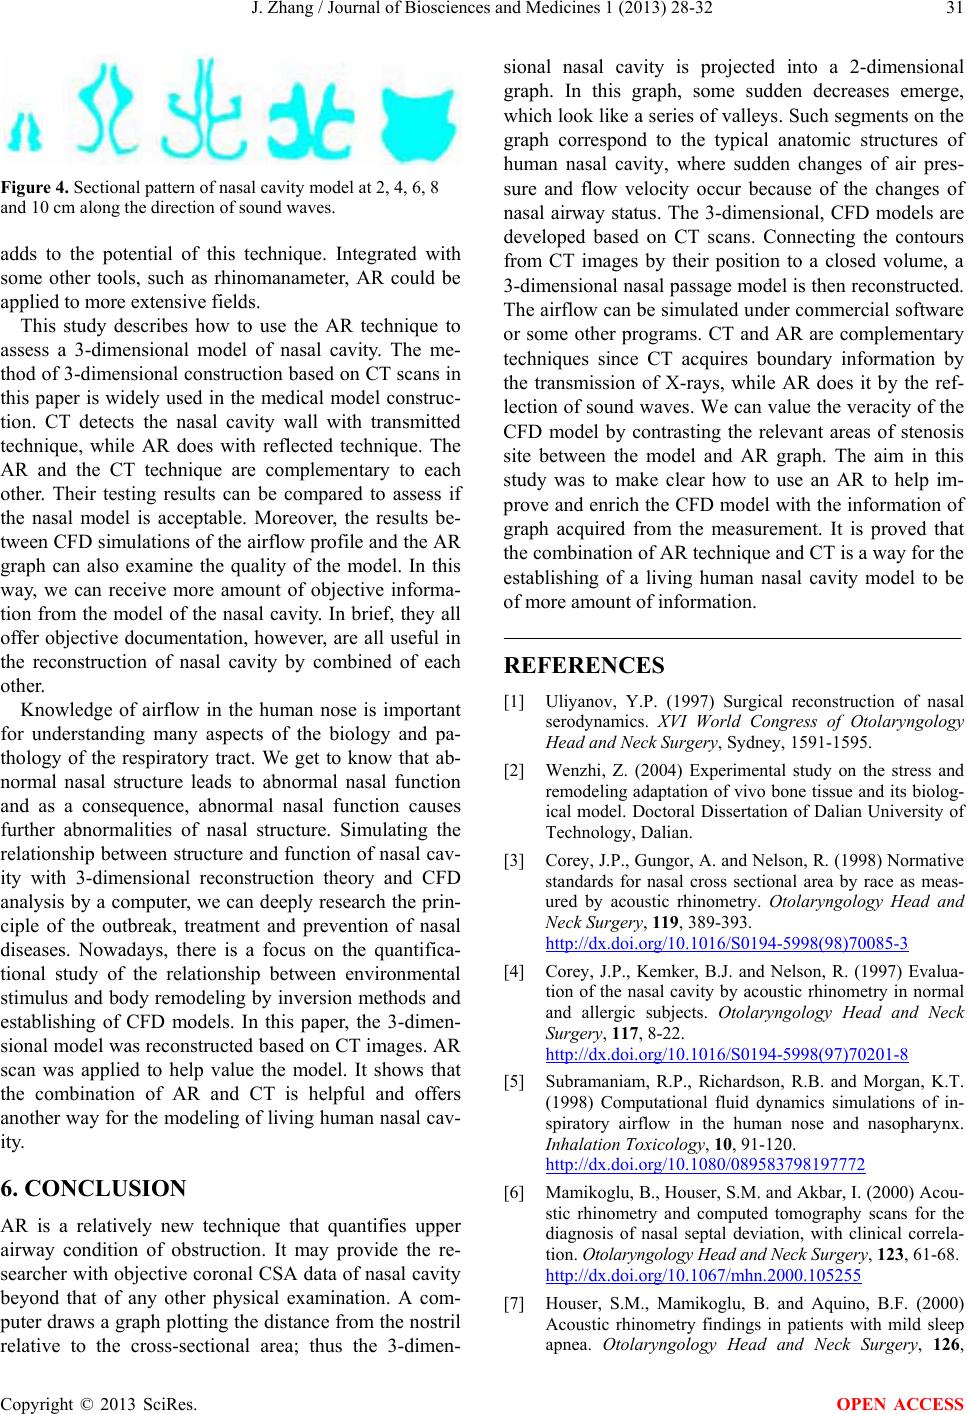 J. Zhang / Journal of Biosciences and Medicines 1 (2013) 28-32 Copyright © 2013 SciRes. OPEN ACCESS 31 Figure 4. Sectional pattern of nasal cavity model at 2, 4, 6, 8 and 10 cm along the direction of sound waves. adds to the potential of this technique. Integrated with some other tools, such as rhinomanameter, AR could be applied to more extensive fields. This study describes how to use the AR technique to assess a 3-dimensional model of nasal cavity. The me- thod of 3-dimensional construction based on CT scans in this paper is widely used in the medical model construc- tion. CT detects the nasal cavity wall with transmitted technique, while AR does with reflected technique. The AR and the CT technique are complementary to each other. Their testing results can be compared to assess if the nasal model is acceptable. Moreover, the results be- tween CFD simulations of the airflow profile and the AR graph can also examine the quality of the model. In this way, we can receive more amount of objective informa- tion from the model of the nasal cavity. In brief, they all offer objective documentation, however, are all useful in the reconstruction of nasal cavity by combined of each other. Knowledge of airflow in the human nose is important for understanding many aspects of the biology and pa- thology of the respiratory tract. We get to know that ab- normal nasal structure leads to abnormal nasal function and as a consequence, abnormal nasal function causes further abnormalities of nasal structure. Simulating the relationship between structure and function of nasal cav- ity with 3-dimensional reconstruction theory and CFD analysis by a computer, we can deeply research the prin- ciple of the outbreak, treatment and prevention of nasal diseases. Nowadays, there is a focus on the quantifica- tional study of the relationship between environmental stimulus and body remodeling by inversion methods and establishing of CFD models. In this paper, the 3-dime n - sional model was reconstructed based on CT images. AR scan was applied to help value the model. It shows that the combination of AR and CT is helpful and offers another way for the modelin g of living human nasal cav- ity. 6. CONCLUSION AR is a relatively new technique that quantifies upper airway condition of obstruction. It may provide the re- searcher with objective coronal CSA data of nasal cavity beyond that of any other physical examination. A com- puter draws a graph plotting the distance from the nostril relative to the cross-sectional area; thus the 3-dime n - sional nasal cavity is projected into a 2-dimensional graph. In this graph, some sudden decreases emerge, which look like a series of valleys. Such segments on the graph correspond to the typical anatomic structures of human nasal cavity, where sudden changes of air pres- sure and flow velocity occur because of the changes of nasal airway status. The 3-dimensional, CFD models are developed based on CT scans. Connecting the contours from CT images by their position to a closed volume, a 3-dimensional nasal passage model is then reconstructed. The airflow can be simulated under commercial software or some other programs. CT and AR are complementary techniques since CT acquires boundary information by the transmission of X-rays, while AR does it by the ref- lection of sound waves. We can value the veracity of the CFD model by contrasting the relevant areas of stenosis site between the model and AR graph. The aim in this study was to make clear how to use an AR to help im- prove and enrich the CFD model with the information of graph acquired from the measurement. It is proved that the combination of AR technique and CT is a way for the establishing of a living human nasal cavity model to be of more amount of information. REFERENCES [1] Uliyanov, Y.P. (1997) Surgical reconstruction of nasal serodynamics. XVI World Congress of Otolaryngology Head and Neck Surgery, Sydney, 1591-1595. [2] Wenzhi, Z. (2004) Experimental study on the stress and remodeling adaptation of vivo bone tissue and its biolog- ical model. Doctoral Dissertation of Dalian University of Technology, Dalian. [3] Corey, J.P., Gungor, A. and Nelson, R. (1998) Normative standards for nasal cross sectional area by race as meas- ured by acoustic rhinometry. Otolaryngology Head and Neck Surgery, 119, 389-393. http://dx.doi.org/10.1016/S0194-5998(98)70085-3 [4] Corey, J.P., Kemker, B.J. and Nelson, R. (1997) Evalua- tion of the nasal cavity by acoustic rhinometry in normal and allergic subjects. Otolaryngology Head and Neck Surgery, 117, 8-22. http://dx.doi.org/10.1016/S0194-5998(97)70201-8 [5] Subramaniam, R.P., Richardson, R.B. and Morgan, K.T. (1998) Computational fluid dynamics simulations of in- spiratory airflow in the human nose and nasopharynx. Inhalation Toxicology, 10, 91-120. http://dx.doi.org/10.1080/089583798197772 [6] Mamikoglu, B., Houser, S.M. and Akbar, I. (2000) Acou- stic rhinometry and computed tomography scans for the diagnosis of nasal septal deviation, with clinical correla- tion. Otolaryngology Head and Neck Surgery, 123, 61-68. http://dx.doi.org/10.1067/mhn.2000.105255 [7] Houser, S.M., Mamikoglu, B. and Aquino, B.F. (2000) Acoustic rhinometry findings in patients with mild sleep apnea. Otolaryngology He ad and Neck Surgery , 126,  J. Zhang / Journal of Biosciences and Medicines 1 (2013) 28-32 Copyright © 2013 SciRes. OPEN ACCESS 32 475-480. http://dx.doi.org/10.1067/mhn.2002.124848 [8] Negus, V. (1958) The comparative anatomy and physi- ology of the nose and paranasal sinuses. Livingstone, London. [9] Proctor, D.F. (1982) The upper airway. Nose, Uppe r Air- way Physiology and the Atmospheric Environment, 23- 43. [10] Haight, S.J. and Cole, P. (1983) Site and function of the nasal valve. Laryngoscope, 49-55. [11] Lanza, D.C. and Clerico, D.M. (1995)Anatomy of the hu- man nasal passages. Handbook of Olfaction and Gusta- tion, 53-73. [12] Cole, P. (1982) Upper respiratory airflow. Nose, Upper Airway Physiology and the Atmospheric Environment, 163-183. [13] Hilberg, O.F. and Pedersen, (2000) Acoustic rhinometry: Recommendations for technical specifications and stan- dard operating procedures. Rhinology, 16, 3-17. [14] Brown, I.G., Zamel, N. and Hoffstein, V. (1986) Pharyn- geal crosssectional area in normal men and women. Jour- nal of Applied Physiology, 61, 890-895. |