

Paper Menu >>
Journal Menu >>
 Journal of Biosciences and Medicines, 2013, 1, 23-27 JBM http://dx.doi.org/10.4236/jbm.2013.12006 Published Online October 2013 (http://www.scirp.org/journal/jbm/) OPEN ACCESS Characteristic size research of human nasal cavity and the respirato ry airflow CFD analysis* Jun Zhang Advanced Technology of Transportation Vehicle Key Laboratory of Liaoning Province, Dalian Jiaotong University, Dalian, China Email: [email protected] Received 2013 ABSTRACT To study the airflow distribution in human nasal cav- ity during respiration and the characteristic parame- ters for nasal structure, thirty three-dimensional, anatomically accurate representations of adult nasal cavity models were reconstructed based on processed tomography images collected from normal people. The airflow fields in nasal cavities were simulated using the fluid dynamics with the finite element soft- ware ANSYS. The results showed that the difference of human nasal cavity structure led to varying airflow distribution in the nasal cavities and the main airflow passed through the common nasal meatus. The nasal resistance in the regions of nasal valve and nasal ves- tibule accounted for more than a half of overall resis- tance. The characteristic model of nasal cavity was extracted based on the characteristic points and di- mensions deducted from the original models. It showed that either the geometric structure or the air- flow field of the two kinds of model was similar. The characteristic dimensions were the characteristic pa- rameters of nasal cavity that properly represented the original model in research for nasal cavity. Keywords: Nasal Cavity; Characteristic Dimension; Three-Dimensional Reconstruction ; Numerical Simula tion of Flow Field; Computational Fluid Dyn a mic ; Finite Element Method 1. INTRODUCTION Nose is the first barrier of defense to outer invasions in the human respiratory system that is protective for life long. It provides functions of filtering, warming, and moistening inhaled air and protects the delicate structure of the lower respiratory system. With the current devel- opment of research towards the pathogenic mechanism and the application of iatrical apparatus such as endos- copes, it has been demonstrated that certain nasal diseas- es are closely related to the abnormal structure of nasal cavity [1]. Some researchers have investigated the air- flow characters in nasal cavity to try to find the corre la- tion between the nasal structure and the nasal disease [2]. The method of numerical simulation for airflow is help- ful to this investigation. By simulating the structure and function of the nasal cavity with three-dimensional re- construction theory with a computer, we can profoundly explore the outbreak, treatment and prevention of nasal diseases. Keyhani [3] constructed a finite element mesh of the human nasal cavity from the CAT scans. In his work, the steady-state N avier-Stokes and continuity equ- ations were solved numerically to determine the laminar airflow patterns in the nasal cavity at quiet breathing flow rates. The numerical results were validated by com- parison with detailed experimental measurements from Hahn’s [4] study. Martonen [5] et al. constructed a three- dimensional computational model of the human upper- respiratory tract that featured both sides of nasal cavity. The model included airways of the head and the throat based on a cast of a medical school teaching model. The results showed the airflow patterns in different flow rate values and the velocity profiles during inhalation and exhalation. Subramaniam [6] et al. represented a three- dimensional, computational model of an adult human’s nasal cavity and nasopharynx, and solved the Navier- Stokes and continuity equations for airflow using the finite-element method under conditions of steady-state inspiratory. The model was developed from magnetic resonance imaging scans of a person’s nose. The nasal cavity model was divided into several regions and the flow apportionment among different regions of the nose was detailed. Kim [7] investigated airflows in normal and abnormal nasal cavities and surgically created mod- els experimentally by Particle Image Velocimetry (PIV). The average distributions of airflow in normal and ab- normal nasal were obtained. In the case of simulation of surgical operations, velocity distribution in coronal sec- tion changed locally. Reimersdahl [8] and Hörschler [9] presented the results of numerical simulation of the air- flow in a model of the human nasal cavity which showed *Project of Liaoning Province Education Department, LS2010030. 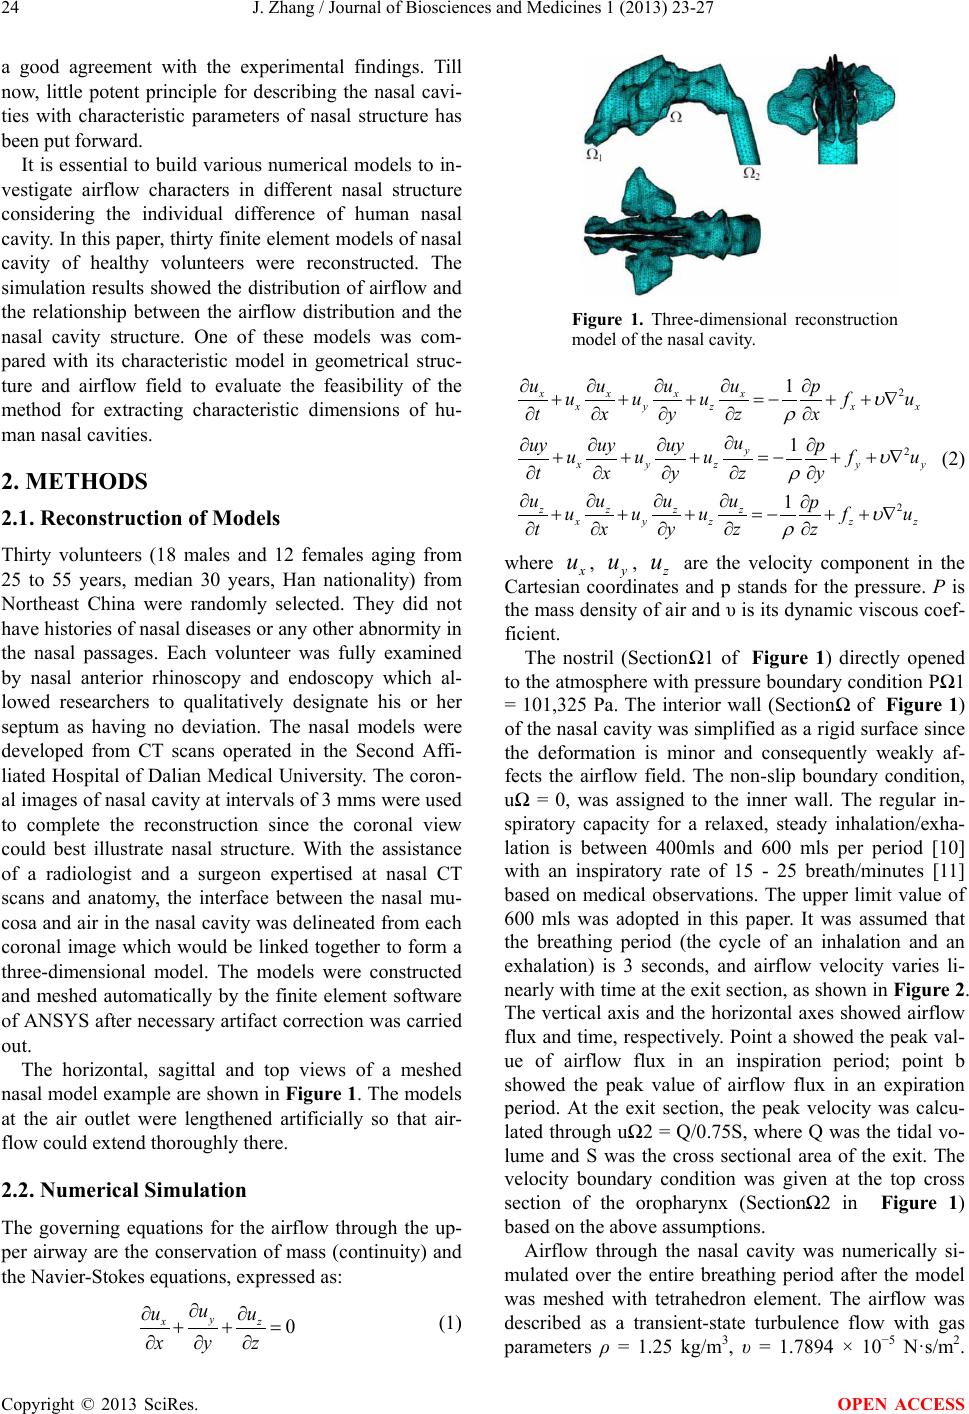 J. Zhang / Journal of Biosciences and Medicines 1 (2013) 23-27 Copyright © 2013 SciRes. OPEN ACCESS 24 a good agreement with the experimental findings. Till now, little potent principle for describing the nasal cavi- ties with characteristic parameters of nasal structure has been put forward. It is essential to build various numerical models to in- vestigate airflow characters in different nasal structure considering the individual difference of human nasal cavity. In this paper, thirty finite element models of nasal cavity of healthy volunteers were reconstructed. The simulation results showed the distribution of airflow and the relationship between the airflow distribution and the nasal cavity structure. One of these models was com- pared with its characteristic model in geometrical struc- ture and airflow field to evaluate the feasibility of the method for extracting characteristic dimensions of hu- man nasal cavities. 2. METHODS 2.1. Reconstruction of Models Thirty volunteers (18 males and 12 females aging from 25 to 55 years, median 30 years, Han nationality) from Northeast China were randomly selected. They did not have histories of nasal diseases or any other abnormity in the nasal passages. Each volunteer was fully examined by nasal anterior rhinoscopy and endoscopy which al- lowed researchers to qualitatively designate his or her septum as having no deviation. The nasal models were developed from CT scans operated in the Second Affi- liated Hospital of Dalian Medical University. The coron- al images of nasal cavity at intervals of 3 mms wer e used to complete the reconstruction since the coronal view could best illustrate nasal structure. With the assistance of a radiologist and a surgeon expertised at nasal CT scans and anatomy, the interface between the nasal mu- cosa and air in the nasal cavity was delineated from each coronal image which would be linked together to form a three-dimensional model. The models were constructed and meshed automatically by the finite element software of ANSYS after necessary artifact correction was carried out. The horizontal, sagittal and top views of a meshed nasal model example are shown in Fi g u re 1 . The models at the air outlet were lengthened artificially so that air- flow could extend thoroughly there. 2.2. Numerical Simulation The governing equations for the airflow through the up- per airway are the conservation of mass (continuity) and the Navier-Stokes equations, expressed as: 0 y xz u uu xyz ∂ ∂∂ ++= ∂∂∂ (1) Figure 1. Three-dimensional reconstruction model of the nasal cavity. 2 2 2 1 1 1 xxxx x y zxx y x y zyy zzzz x y zzz uuuup uuufu txyz x u uy uyuyp uuu fu txyz y uuuu p uuufu txyz z υ ρ υ ρ υ ρ ∂∂∂∂∂ +++=−+ +∇ ∂∂∂∂∂ ∂ ∂∂∂ ∂ +++=−+ +∇ ∂∂∂∂ ∂ ∂∂∂∂∂ +++=−++∇ ∂∂∂∂∂ (2) where x u , y u , z u are the velocity component in the Cartesian coordinates and p stands for the pressure. P is the mass density of air and υ is its dynamic viscous coef- ficient. The nostril (Section Ω1 of Figure 1) directly opened to the atmosphere with pressure boundary condition PΩ1 = 101,325 Pa. The interior wall (Section Ω of Figure 1) of the nasal cavity was simplified as a rigid surface since the deformation is minor and consequently weakly af- fects the airflow field. The non-slip boundary condition, uΩ = 0, was assigned to the inner wall. The regular in- spiratory capacity for a relaxed, steady inhalation/exha- lation is between 400mls and 600 mls per period [10] with an inspiratory rate of 15 - 25 breath/minutes [11] based on medical observations. The upper limit value of 600 mls was adopted in this paper. It was assumed that the breathing period (the cycle of an inhalation and an exhalation) is 3 seconds, and airflow velocity varies li- nearly with time at the exit section, as shown in Figure 2. The vertical axis and the horizontal axes showed airflow flux and time, respectively. Point a showed the peak val- ue of airflow flux in an inspiration period; point b showed the peak value of airflow flux in an expiration period. At the exit section, the peak velocity was calcu- lated through uΩ2 = Q /0.75S, where Q was the tidal vo- lume and S was the cross sectional area of the exit. The velocity boundary condition was given at the top cross section of the oropharynx (Section Ω2 in Figure 1) based on the above assumptions. Airflow through the nasal cavity was numerically si- mulated over the entire breathing period after the model was meshed with tetrahedron element. The airflow was described as a transient-state turbulence flow with gas parameters ρ = 1.25 kg/m3, υ = 1.7894 × 10⁻⁵ N·s/m2. 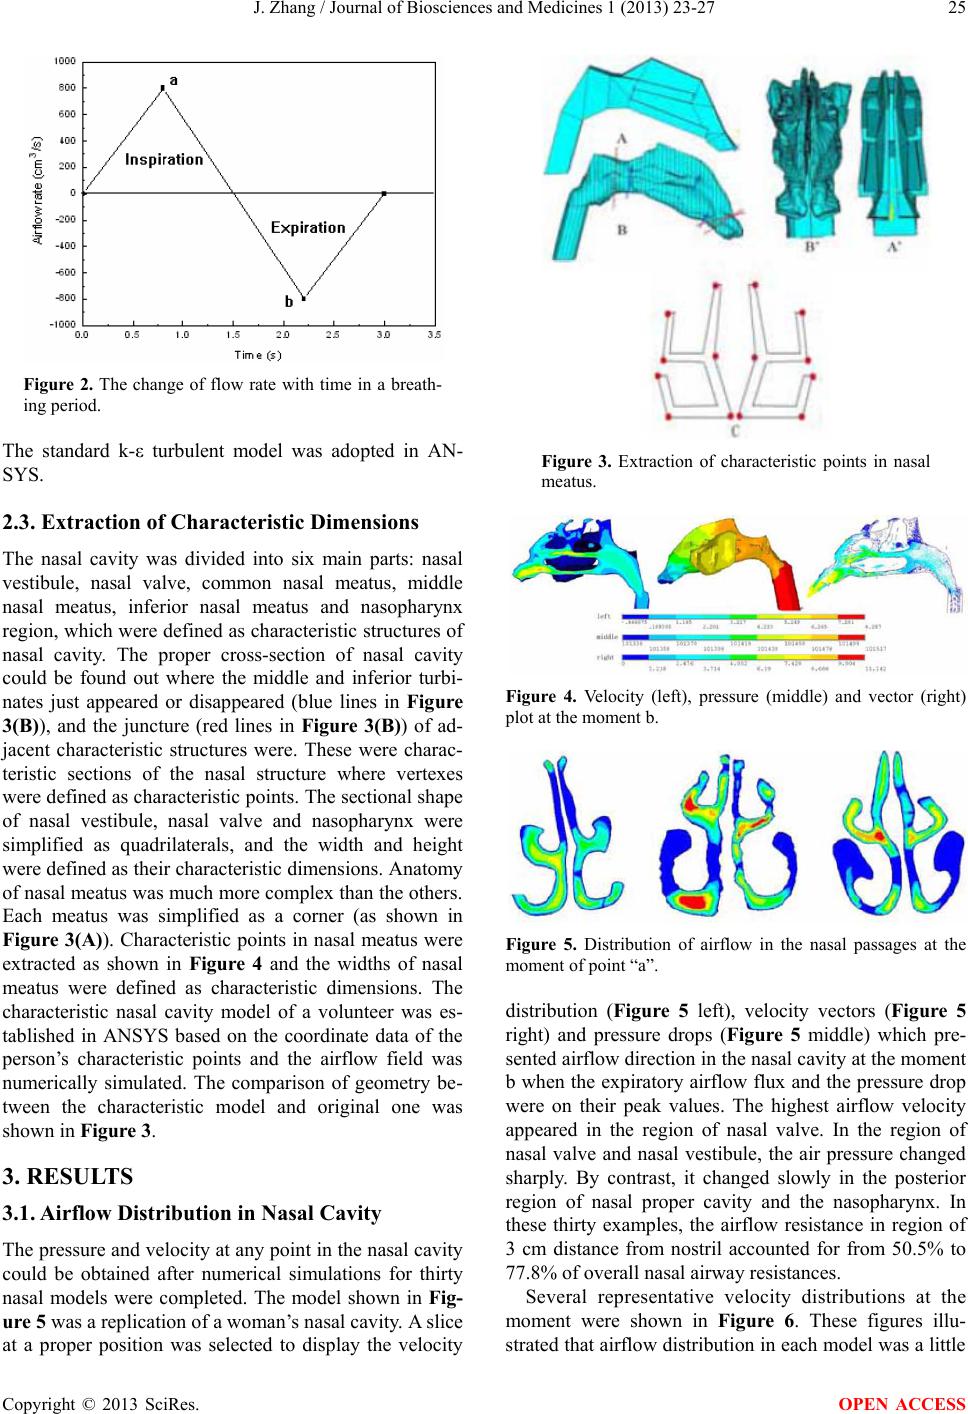 J. Zhang / Journal of Biosciences and Medicines 1 (2013) 23-27 Copyright © 2013 SciRes. OPEN ACCESS 25 Figure 2. The change of flow rate with time in a breath- ing period. The standard k-ε turbulent model was adopted in AN- SYS. 2.3. Extraction of Characteristic Dimensions The nasal cavity was divided into six main parts: nasal vestibule, nasal valve, common nasal meatus, middle nasal meatus, inferior nasal meatus and nasopharynx region, which were defined as characteristic structures of nasal cavity. The proper cross-section of nasal cavity could be found out where the middle and inferior turbi- nates just appeared or disappeared (blue lines in Figure 3(B)), and the juncture (red lines in Figure 3(B)) of ad- jacent characteristic structures were. These were charac- teristic sections of the nasal structure where vertexes were defined as characteristic points. The sectional shape of nasal vestibule, nasal valve and nasopharynx were simplified as quadrilaterals, and the width and height were defined as their characteristic dimensions. Anatomy of nasal meatus was much more complex than the others. Each meatus was simplified as a corner (as shown in Figure 3(A)). Characteristic points in nasal meatus were extracted as shown in Figure 4 and the widths of nasal meatus were defined as characteristic dimensions. The characteristic nasal cavity model of a volunteer was es- tablished in ANSYS based on the coordinate data of the person’s characteristic points and the airflow field was numerically simulated. The comparison of geometry be- tween the characteristic model and original one was shown in Figure 3. 3. RESULTS 3.1. Airflow Distribution in Nasal Cavity The pressure and velocity at any point in the nasal cavity could be obtained after numerical simulations for thirty nasal models were completed. The model shown in Fig- ure 5 was a replic a t ion of a wom a n’s nasal cavity. A slice at a proper position was selected to display the velocity Figure 3. Extraction of characteristic points in nasal meatus. Figure 4. Velocity (left), pressure (middle) and vector (right) plot at the moment b. Figure 5. Distribution of airflow in the nasal passages at the moment of point “a”. distribution (Figure 5 left), velocity vectors (Figure 5 right) and pressure drops (Figure 5 middle) which pre- sented airflow direction in th e nasal cav ity at the moment b when the expiratory air flow flux and the pres sure drop were on their peak values. The highest airflow velocity appeared in the region of nasal valve. In the region of nasal valve and nasal vestibule, the air pressure changed sharply. By contrast, it changed slowly in the posterior region of nasal proper cavity and the nasopharynx. In these thirty examples, the airflow resistance in region of 3 cm distance from nostril accounted for from 50.5% to 77.8% of overall nasal airway resistances. Several representative velocity distributions at the moment were shown in Figure 6. These figures illu- strated that airflow distribution in each model was a little  J. Zhang / Journal of Biosciences and Medicines 1 (2013) 23-27 Copyright © 2013 SciRes. OPEN ACCESS 26 Figure 6. Comparison of velocity (left) and pressure (right) distribution be- tween characteristic model and origin one of nasal cavity. different and the airflow flux on one side of the nasal cavity was different from the other’s. The results indi- cated that there were three airflow distribution modes in the nasal airway: 1. The main stream passed through the common nasal meatus and the residual part passed through the middle and inferior nasal meatus (shown in Fig ure 6 left). In this mode, the airflow flux through the common nasal meatus accounted for 56.6% of overall flux. 2. The main stream passed through the inferior nasal meatus and the common nasal meatus (shown in Figure 5 middle). In this mode, the airflow flux through inferior nasal meatus and common nasal meatus accounted for 60.5% of over- all flux. 3. The main airflow passed through the middle nasal meatus and the common nasal meatus (shown in Figure 5 right). In this mode, the airflow flux through the middle nasal meatus and the common nasal meatus accounte d for 77.0 % of o ve r all flux. Among thirty examples, seven of them agreed with the first mode; seven of them were categorized the second mode. The other fourteen examples belonged to the third mode. 3.2. Comparison of Airflow Distribution between Characteristic Model and the Original One By comparing the airflow distribution of velocity field (Figure 6 left) and the pressure field (Figure 6 rig ht) between the characteristic model and original one, it showed that either the geometry structure or numerical simulation was similar, and the numerical comparison and difference was shown in Table 1. 4. DISCUSSIO N The mechanism of airflow in human nose is important for understanding many aspects of the biology and pa- thology in the respiratory tract. The present investigation showed that the airflow flux through left or right side of nasal cavity lies on the airflow resistance or the cross- sectional area. On each side, the airflow distribution de- pends on the structure of airway as the main airflow Tabl e 1. Difference of geometry dimensions and airflow cha- racter between two models. Original model Characteristic model Difference Cross dim. 0.036 m 0.046 m 12.20% Vertical dim. 0.084 m 0.085 m 0.59% Longitudinal dim. 0.136 m 0.136 m 0.00% Pressure drop 94.8 Pa 79.8 Pa 8.59% Maximal velocity 9.279 m/s 9.260 m/s 0.10% passed through the route with wider airway. The resis- tance is usually lower in the wider airway like the com- mon nasal meatus or where it intersects with the middle nasal meatus. So long as the presentative structure di- mensions of nasal cavity are obtained, which were ex- pressed as characteristic points and dimensions in this paper, the airflow distribution in the real nasal cavity could be well described. The models under the definition of characteristic dimension can represent not only its original model, but also the models with approximate characteristic dimensions. Ulyanov [12] provided two typical nasal models of the southern type and the north- ern type. The characters of the northern type nasalcavity were that the inferior turbinate was large in size and the main airflow passed through the middle passage. The characters of southern type nasal cavity were that the inferior turbinate was small in size and the main airflow passed through the inferior interior passage [6]. Because of the large inferior turbinate, the inferior nasal meatus was narrow and the resistance in this airway was high which led to most of airflow passing through the middle nasal meatus. The principle for the southern type nasal cavity was the same as the northern type. This was a good use of characteristic dimension for identifying hu- mans with the structure character of nasal cavity. 5. CONCLUSION A feasible method was developed to reconstruct the nu- merical models of nasal cavities. Through numerical  J. Zhang / Journal of Biosciences and Medicines 1 (2013) 23-27 Copyright © 2013 SciRes. OPEN ACCESS 27 simulation results of thirty examples, the details of air- flow distribution in the nasal cavity were illustrated. The results showed that the wider the meatus were, the more airflow would pass through. The distribution of the air- flow would be changed on two sides of the nasal cavity if any part of nasal structure varies. The numerical model based on characteristic dimension was then reconstructed. It showed that either the geometric structure or the air- flow distribution in the characteristic model was similar to the original one. The conclusion can be made that the characteristic model can partly replace the original one and even the models with approximate characteristic dimensions during the model research towards nasal cav- ity. REFERENCES [1] Uliyanov, Y.P. (1997) Surgical reconstruction of nasal serodynamics. Proceedings of 16th World Congress of Otolaryngology Head and Neck Surgery, XVI World Congress of Otolaryngology Head and Neck Surgery, Sydney, 1591-1595. [2] Liu, Y.X., Yu, S., Sun, X.Z., et al. (2005) Structure of nasal cavity and characters of airflow. Chinese Journal of Otolaryngology Head and Neck Surgery, 40, 846-849. [3] Keyhani, K., Scherer, P.W. and Mozell, M.M. (1995) Numerical simulation of airflow in the human nasal cavi- ty. Journal of Biomechanical Engineering, 117, 429-441. http://dx.doi.org/10.1115/1.2794204 [4] Hahn, I., Scherer, P.W., Mozell, M.M., et al. (1993) Ve- locity profiles measured for airflow through a large scale model of he human nasal cavity. Journal of Applied Phy- siology, 75, 2273-2287. [5] Martonen, T.B., Quan, L., Zhang, Z., et al. (2002) Flow simulation in the human upper respiratory tract. Cell Bi- ochemistry and Biophysics, 37, 27-36. http://dx.doi.org/10.1385/CBB:37:1:27 [6] Subramaniam, R.P., Richardson, R.B. and Morgan, K.T. (1998) Computational fluid dynamics simulations of in- spiratory airflow in the human nose and nasopharynx. Inhalation Toxicology, 10, 91-120. http://dx.doi.org/10.1080/089583798197772 [7] Kim, S.K. and Chung, S.K. (2004) An investigation on airflow in disordered nasal cavity and its corrected mod- els by tomographic PIV. Measurement Science and Tech- nology, 15, 1090-1096. http://dx.doi.org/10.1088/0957-0233/15/6/007 [8] Reimersdahl, Th., Hörschler, I. and Gerndt, A. (2001) Air- flow simulation inside a model of the human nasal cavity in a virtual reality based rhinological operation planning system. International Congress Series, 1230, 87-92. http://dx.doi.org/10.1016/S0531-5131(01)00021-8 [9] Hörschler, I., Meinke, M. and Schröder, W. (2003) Nu- merical simulation of the flow field in a model of the nasal cavity. Computers & Fluids, 32, 39-45. http://dx.doi.org/10.1016/S0045-7930(01)00097-4 [10] Guitong, Y., Weiyi, C. and Jinbin, X. (1999) Biome- chanics. Chongqing Press, Chongqing. [11] Keyhani, K. a nd Scherer, P.W. (1995) Numerical simula- tion of airflow in the human nasal cavity. Journal of Bio- mechanical Engineering, 117, 429-441. [12] Ulyanov, Y.P. (1998) Clinical manifestations the variants of nasal aerodynamics. Otolaryngology Head and Neck Surgery, 119, 152-153. |