

Paper Menu >>
Journal Menu >>
 Journal of Biosciences and Medicines, 2013, 1, 14-18 JBM http://dx.doi.org/10.4236/jbm.2013.12004 Published Online October 2013 (http://www.scirp.org/journal/jbm/) OPEN ACCESS Digital biomedical electrical impedance to mography based on FPGA Jiani Wu1, Xiaoyan Chen1, Zhonglin Ding2 1School of Electronic and Automation, Tianjin University of Science & Technology, Tianjin, China 2School of Computer Science and Information Engineering, Tianjin University of Science & Technology, Tianjin, China Email: [email protected], [email protected], dingzhonglin@tust.edu.cn Received 2013 ABSTRACT A digital biomedical electrical impedance tomogra- phy (EIT) system is developed with the aid of FPGA. The key elements of EIT system are described specif- ically in the paper. The functions are realized to gen- erate excitation source, switch electrode channels, deal collected signals, demodulate measured voltages etc. The system is tested by a circular tank with 16 stainless electrodes attached around the boundary. The adjacent incentive adjacent measurement mode is adapted to collect boundary voltages of the inter- esting field. By testing, the system works with 36 dB signal-to-noise ratio (SNR) when 1 mA 100 KHz cur- rent is applied into a homogenous tank. Keywords: Electrical Impedance Tomography; FPGA; Direct Digital Synthesis; Orthogonal Sequenc e s Demodulation 1. INTRODUCTION Electrical impedance tomography (EIT) is one of the major research topics in biomedical engineering. It is a medical imaging technology developed in thirty years after morphological and structure imaging technology. EIT system consists of the electrode array, data acquisi- tion system (DAS) and image reconstruction. DAS trans- fers the measured electrical data to computer for subse- quent reconstruction. The quality of the reconstructed image depends on the accuracy of the collected data and the reconstruction algorithms mostly. Therefore, it is essential to design a stable and accuracy DAS for EIT system. At the beginning of the research, around 1980s, the electrical processor are not as powerful and integrated as now, microprocessor is taken the charge of coordinating the whole system. Mark I and Mark II established by Sheffield University are the examples [1,2]. With the development of the digital processing technology, DSP became the most popular processor used in EIT system for a certain long time. Mark3a and Mark3b [3], OX- BACT 3 and 4 [4], A CT3 [5] and Dartmouth EIT system [6] are the representatives. In OXBACT system, Oxford Brookes University used TMS320C40 as the con troller ; Dartmouth researchers used ADSP-21065L to build their mul ti -frequencies EIT system. These systems worked well and made great contribution to EIT research. FPGA is one of the most popular electric circuit design methods at p resent, which is developed on the basis of PAL and GAL, and has the advantages of high perfor- mance, big scale integration, programmable ability. In recent years, some Chinese research groups have used FPGA to develop EIT system, such as, Tianjin University used FPGA to construct a EIT system for lung ventilation monitoring [7]; Zhengzhou University used FPGA em- bedded NIOS II processor to develop a 128 electrodes rotating EIT data acquisition system [8]; the Fourth Mil- itary Medical University developed a FPGA EIS system to image the human brain [9]. From the developing view, the digital integrated DAS will bring great promotion to improve EIT clinical ap- plications. In this paper, XC3S500E-5FG320 of Spartan3E is used as the core controller to implement DAS, which has a large number of resources in FPGA, so it is easy to realize various hardware modules by VHDL (Very high speed integrated circuit Hardware Description Language), which can reduce PCB areas, save development time, and improve the reliability of the system. The cored ele- ments of the DAS are described specifically as follow- ing. 2. STRUCTURE The DAS includes six components: excitation source, switches, signal processing circuits, orthogonal se- quences demodulation, data buffer and communication interface, as shown in Figure 1. The PicoBlaze micro- controller embedded in FPGA coordinates the parts work effectively [10]. 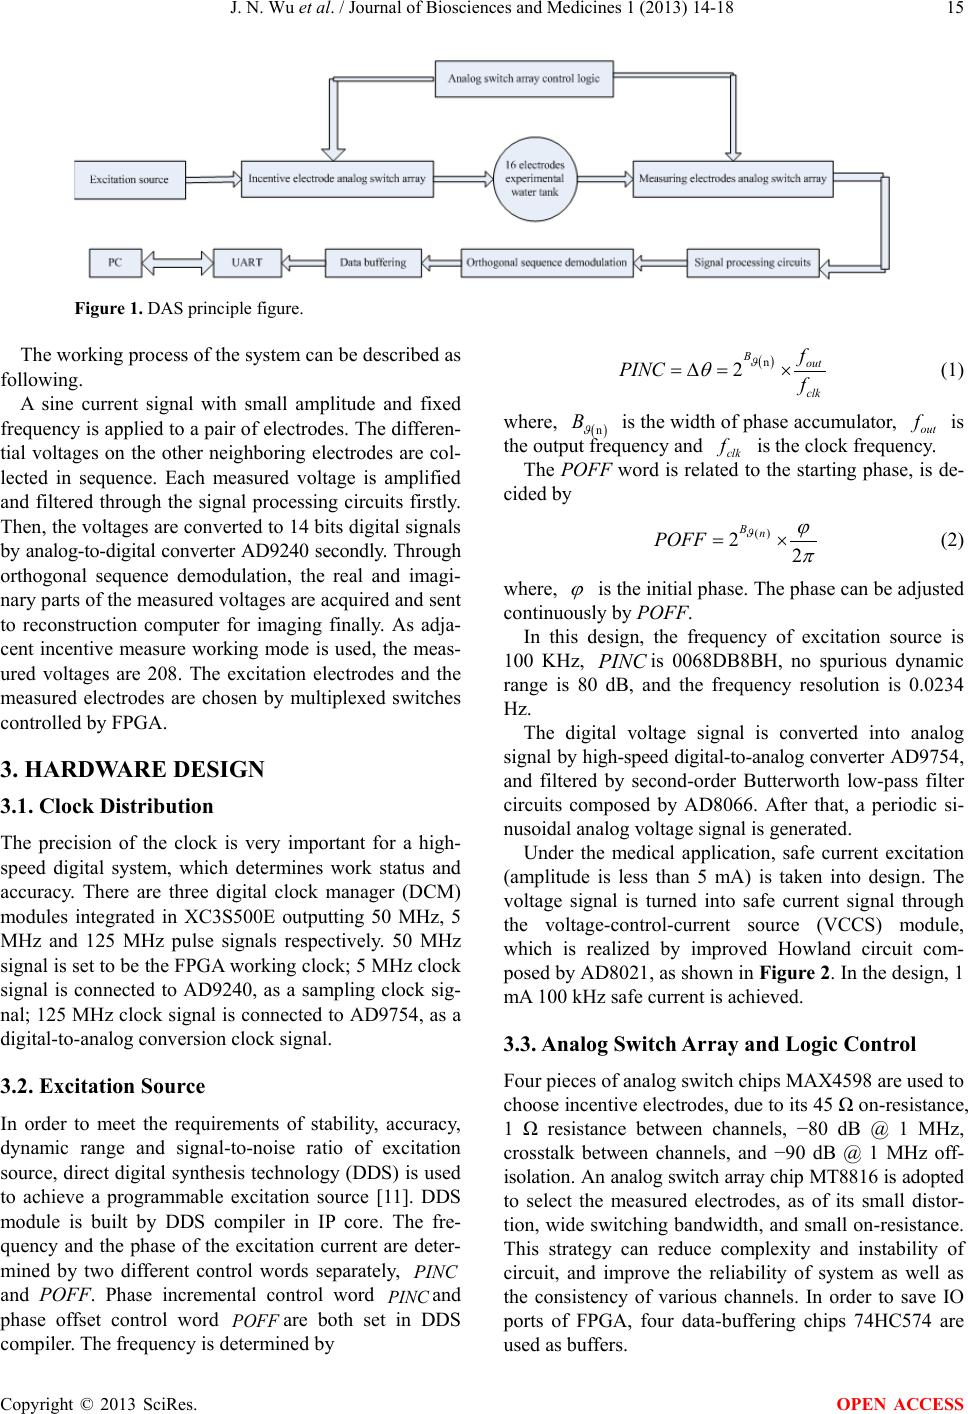 J. N. Wu et al. / Journal of Biosciences and Medicines 1 (2013) 14-18 Copyright © 2013 SciRes. OPEN ACCESS 15 Figure 1. DAS principle figure. The working pr oc ess of th e syste m can b e described as following. A sine current signal with small amplitude and fixed frequency is applied to a pair of electrodes. The di fferen- tial voltages on the other neighboring electrodes are col- lected in sequence. Each measured voltage is amplified and filtered through the signal processing circuits firstly. Then, the voltages are converted to 14 bits digital signals by an alog-to-digital converter AD9240 secondly. Through orthogonal sequence demodulation, the real and imagi- nary parts of the measured voltages are acquired and sent to reconstruction computer for imaging finally. As adja- cent incentive measure working mode is used, the meas- ured voltages are 208. The excitation electrodes and the measured electrodes are chosen by multiplexed switches controlled by FPGA. 3. HARDWARE DESIGN 3.1. Clock Distribution The precision of the clock is very important for a high- speed digital system, which determines work statu s and accuracy. There are three digital clock manager (DCM) modules integrated in XC3S500E outputting 50 MHz, 5 MHz and 125 MHz pulse signals respectively. 50 MHz signal is set to be t he FPGA working clo ck ; 5 MHz clock signal is con nected to AD9240, as a sampling clock sig- nal; 125 MHz clock signal is connected to AD9754, as a digital-to-analog conversion clock signal. 3.2. Excitation Source In order to meet the requirements of stability, accuracy, dynamic range and signal-to-noise ratio of excitation source, direct digital s ynthesis technology (DDS) is used to achieve a programmable excitation source [11]. DDS module is built by DDS compiler in IP core. The fre- quency and the phase of the excitation current are deter- mined by two different control words separately, PINC and POFF. Phase incremental control word PINC and phase offset control word POFF are both set in DDS compiler. The frequency is determined by ( ) n 2 Bout clk f PINC f ϑ θ =∆= × (1) where, ( ) n B ϑ is the width of phase accumulator, out f is the output frequen c y and clk f is the clock frequency. The POFF word is related to the starting phase, is de- cided by () 22 Bn POFF ϑ ϕ π = × (2) where, ϕ is the initial phase. The phase can be adjusted continuously by POFF. In this design, the frequency of excitation source is 100 KHz, PINC is 0068DB8BH, no spurious dynamic range is 80 dB, and the frequency resolution is 0.0234 Hz. The digital voltage signal is converted into analog signal by high-speed digital-to-analog converter AD9754, and filtered by second-order Butterworth low-pass filter circuits composed by AD8066. After that, a periodic si- nusoidal analog voltage signal is gen erated. Under the medical application, safe current excitation (amplitude is less than 5 mA) is taken into design. The voltage signal is turned into safe current signal through the voltage-control-current source (VCCS) module, which is realized by improved Howland circuit com- posed by AD8021, as shown in Figu re 2. In the design, 1 mA 100 kHz safe current is achieved. 3.3. Analog Switch Array and Logic Control Four piece s of a na l og switch c hi ps MAX4598 a re us ed to choose incentive electrodes, due to its 45 Ω on-resistance, 1 Ω resistance between channels, −80 dB @ 1 MHz, crosstalk between channels, and −90 dB @ 1 MHz off- isolation . A n analog switch array chip MT8816 is adopted to select the measured electrodes, as of its small distor- tion, wide switching bandwidth, and s mall on-resistance. This strategy can reduce complexity and instability of circuit, and improve the reliability of system as well as the consistency of various channels. In order to save IO ports of FPGA, four data-buffering chips 74HC574 are used as buffers. 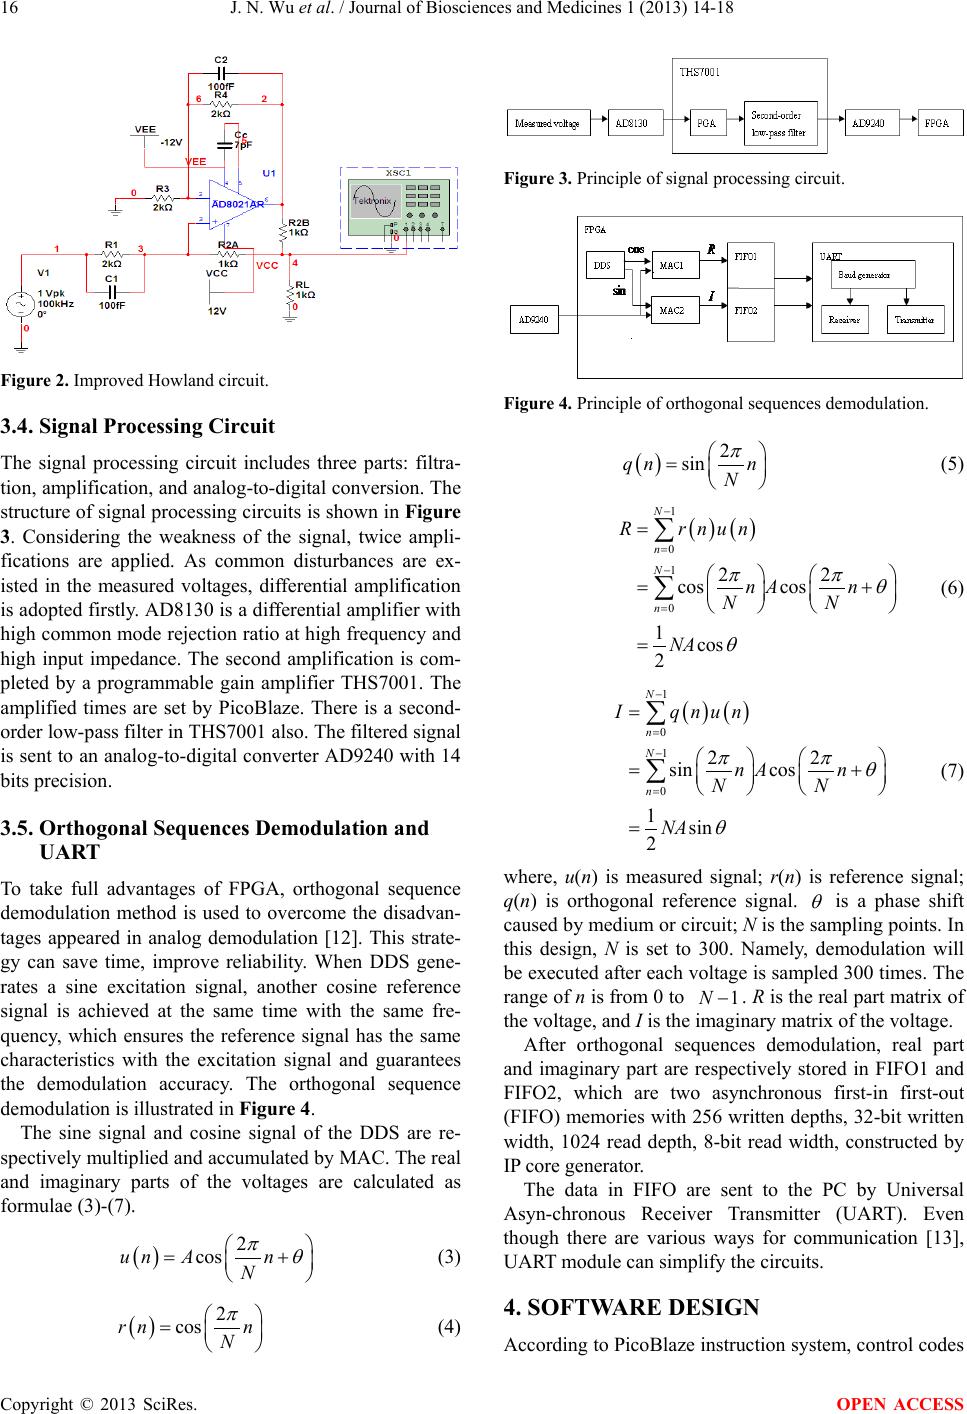 J. N. Wu et al. / Journal of Biosciences and Medicines 1 (2013) 14-18 Copyright © 2013 SciRes. OPEN ACCESS 16 Figure 2. Improved Howland circuit. 3.4. Signal Processing Circuit The signal processing circuit includes three parts: filtra- tion, amplification, and analog -to-digital conv ersion. Th e structure of signal p rocessing circuit s is shown in Figure 3. Considering the weakness of the signal, twice ampli- fications are applied. As common disturbances are ex- isted in the measured voltages, differential amplification is adopted firstly. AD8130 is a differential amplifier with high common mode rejection ratio at high frequency and high input impedance. The second amplification is com- pleted by a programmable gain amplifier THS7001. The amplified times are set by PicoBlaze. There is a second- order low-pass filter in THS7001 also. The filtered signal is sent to an analog-to-digital converter AD9240 with 14 bits precision. 3.5. Orthogonal Sequences Demodulation and UART To take full advantages of FPGA, orthogonal sequence demodulation method is used to overcome the disadvan- tages appeared in analog demodulation [12]. This strate- gy can save time, improve reliability. When DDS gene- rates a sine excitation signal, another cosine reference signal is achieved at the same time with the same fre- quency, which ensures the reference signal has the same characteristics with the excitation signal and guarantees the demodulation accuracy. The orthogonal sequence demodulation is illustrated in Fi gure 4. The sine signal and cosine signal of the DDS are re- spectively multiplied and accumulated by MAC. The real and imaginary parts of the voltages are calculated as formulae (3)-(7). ( ) 2 cosun An N πθ = + (3) ( ) 2 cosrn n N π = (4) Figure 3. Principle of signal processing circuit. Figure 4. Principle of orthogonal sequences demodulation. ( ) 2 sinqn n N π = (5) ( )( ) 1 0 1 0 22 cos cos 1cos 2 N n N n R rnun nA n NN NA ππ θ θ − = − = = = + = ∑ ∑ (6) ( )( ) 1 0 1 0 22 sin cos 1sin 2 N n N n I qnun nA n NN NA ππ θ θ − = − = = = + = ∑ ∑ (7) where, u(n) is measured signal; r(n) is reference signal; q(n) is orthogonal reference signal. θ is a phase shift caused by medium or circuit; N is the sampling points. In this design, N is set to 300. Namely, demodulation will be executed after each voltage is sampled 300 times. The range of n is from 0 to 1N− . R is the real part matrix of the voltage, and I is the imaginary matrix of the voltage. After orthogonal sequences demodulation, real part and imaginary part are respectively stored in FIFO1 and FIFO2, which are two asynchronous first-in first-out (FIFO) memorie s with 256 written depths, 32-bit written width, 1024 read depth, 8-bit read width, constructed by IP core generator. The data in FIFO are sent to the PC by Universal Asyn-chronous Receiver Transmitter (UART). Even though there are various ways for communication [13], UART module can simplify the circuits. 4. SOFTWARE DESIGN According to PicoBlaze instruction system, con trol codes 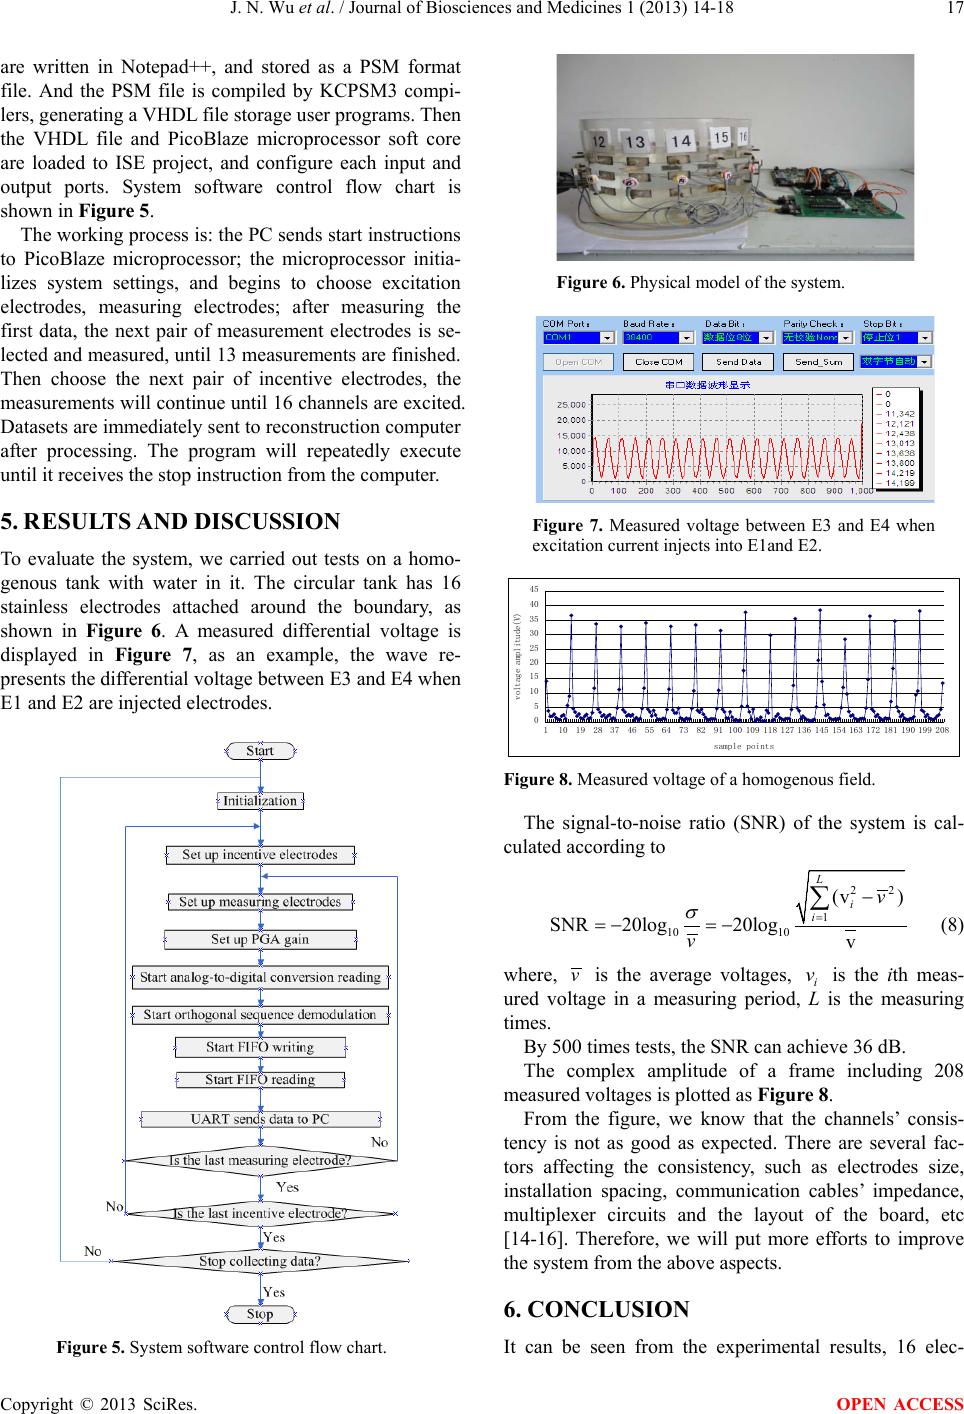 J. N. Wu et al. / Journal of Biosciences and Medicines 1 (2013) 14-18 Copyright © 2013 SciRes. OPEN ACCESS 17 are written in Notepad++, and stored as a PSM format file. And the PSM file is compiled by KCPSM3 compi- lers, genera t i n g a VHDL file s t orage user programs. Then the VHDL file and PicoBlaze microprocessor soft core are loaded to ISE project, and configure each input and output ports. System software control flow chart is shown in Figu re 5. The working process is: the PC sends star t instructions to PicoBlaze microprocessor; the microprocessor initia- lizes system settings, and begins to choose excitation electrodes, measuring electrodes; after measuring the first data, the next pair of measurement electrodes is se- lected and measured, until 13 measurements are finished. Then choose the next pair of incentive electrodes, the measurements will continue until 16 channels are excited. Datasets are immediately sent to reconstruction computer after processing. The program will repeatedly execute until it receives the stop instruc tio n from the computer. 5. RESUL TS AND DISCUSSION To evaluate the system, we carried out tests on a homo- genous tank with water in it. The circular tank has 16 stainless electrodes attached around the boundary, as shown in Figure 6. A measured differential voltage is displayed in Figure 7, as an example, the wave re- presents the differential voltage between E3 and E4 when E1 and E2 a re injected electrodes. Figure 5. System software control flow chart. Figure 6. Physical model of the system. Figure 7. Measured voltage between E3 and E4 when excitation current injects into E1and E2. 0 5 10 15 20 25 30 35 40 45 110192837465564738291100 109 118 127136 145 154 163 172 181 190199 208 sample points voltage amplitude(V) Figure 8. Measured voltage of a homogenous field. The signal-to-noise ratio (SNR ) of the system is cal- culated according to 22 1 10 10 (v ) SNR 20log20logv L i i v v σ = − =−=− ∑ (8) where, v is the average voltages, i v is the ith meas- ured voltage in a measuring period, L is the measuring time s . By 500 times tests, the SNR can achieve 36 dB. The complex amplitude of a frame including 208 measured voltages is plotted as Figure 8. From the figure, we know that the channels’ consis- tency is not as good as expected. There are several fac- tors affecting the consistency, such as electrodes size, installation spacing, communication cables’ impedance, mul ti p lexer cir cu its and the layout of the board, etc [14-16]. Therefore, we will put more efforts to improve the system from the above aspects. 6. CONCLUSION It can be seen from the experimental results, 16 elec-  J. N. Wu et al. / Journal of Biosciences and Medicines 1 (2013) 14-18 Copyright © 2013 SciRes. OPEN ACCESS 18 trodes EIT digital data acquisition system can complete the multi-channel voltage signal acquisition and pro- cessing. Although there are still some defects left to be further studied and solved. We hope it can take the ad- vantages of digital system to put forward the applica- tion of electrical impedance tomography. REFERENCES [1] Brown, B.H. and Seagar, A.D. (1987) The Sheffield data collection system. Clinical Physics and Physiological Measurement, 8, 91-97. http://dx.doi.org/10.1088/0143-0815/8/4A/012 [2] Smith, R.W.M. and Freeston, I.L. (1995) A real-time elec- trical impedance tomography system for clinical use- de- sign and preliminary results. IEEE Transactions on Bio- medical Engineering, 42, 133-140. http://dx.doi.org/10.1109/10.341825 [3] Wilson, A.J., Milnes, P., Waterworth, A.R., Smallwood, R.H. and Brown, B.H. (2001) Mk3.5: A modular, multi- frequency successor to the Mk3a EIS/EIT system. Physi- ological Measurement, 22, 49-54. http://dx.doi.org/10.1088/0967-3334/22/1/307 [4] Christopher William Lawrence Denyer (1996) Electron- ics for real-time and three-dimensional electrical imped- ance tomographs. Christopher William Lawrence Denyer, Oxford. [5] Cook, R.D., Saulnier, G.J., Gisser, D.G., Goble, J.C., Ne- well, J.C. and Isaacson, D. (1994) ACT3: A high-speed, high-precision electrical impedance tomography. IEEE Transactions on Bio- medical Engineering, 41, 713-722. http://dx.doi.org/10.1109/10.310086 [6] Halter, R., Hartov, A. and Paulsen, K.D. (2004) Design and implementation of a high frequency electrical impe- dance tomography system. Physiological Measurement, 25, 379-390. http://dx.doi.org/10.1088/0967-3334/25/1/041 [7] Cui, Z.Q., Wang, H.X., Tang, L., Zhang, L.F., Chen, X.Y. and Yan, Y. (2008) A specific data acquisition scheme for electrical tomography. IEEE Proceedings of Instru- mentation and Measurement Technology Conference, IMTC 2008, Victori a, 12-15 May 2008, 726-729. [8] Zhao, L.P. and Chen, X.X. (2010) Design of electrical impedance tomography data acquisition system based on 128 electrodes. Transducer and Microsystem Technolo- gies, 2010, 29, 83-88. [9] Shi, X.T., You, F.S., Ji, Z.Y., Fu, F., Liu, R.G. and Dong, X.Z. (2010) Digital demodulation in data acquisition sys- tem for multi-frequency electrical impedance tomography. 4th International Conference on Bioinformatics and Bio- medical Engineering (iCBBE), Chengdu, 18-20 June 2010, 1-3. [10] Xilinx Inc. (2010) PicoBlaze 8-bit embedded microcon- troller user guide, UG129 (v2.0). [11] Rafiei-Naeini, M. and McCann, H. (2008) Low-noise cur- rent excitation sub-system for medical EIT. Physiological Measurement, 29, 173-184. http://dx.doi.org/10.1088/0967-3334/29/6/S15 [12] Zhang, X.-H. and Wang, H.-X. (2008) Phase sensitive de - modulation in ECT system. Microcomputer Information, 24, 300-302. [13] Wen, X.N., Wang, H.X. and He, Y.B. (2006) Application of USB communication module in EIT data acquisition system. Electronic Measurement Technology, 29, 163- 165. [14] Seagar, A.D. and Brown, B.H. (1987) Limitations in hardware design in impedance imaging. Clinical Physics and Physiological Measurement, 8, 85-90. [15] Sha, H. and Wang, Y. (2008) A high precision data col- lection method in electrical impedance tomography. Chi- nese Journal of Biomedical Engineering, 27, 675-678. [16] Ren, C.-S. and Wa ng, Y. (2006) Simulation study for comparing line electrodes with compound electrodes in medical impedance tomography. Chinese Journal of Bio- medical Engineering, 25, 637-640. |