

Paper Menu >>
Journal Menu >>
 Low Carbon Economy, 2013, 4, 129-136 Published Online December 2013 (http://www.scirp.org/journal/lce) http://dx.doi.org/10.4236/lce.2013.44014 Open Access LCE 129 Correlations between Corporate Climate Change Management and Financial Performance: A Case Study of Japanese Automobile Manufacturers Miyako Enokibori1, Ryuji Matsuhashi2, Yoshikuni Yoshida1 1Department of Environment Systems, Graduate School of Frontier Sciences, The University of Tokyo, Kashiwa, Japan; 2Department of Electrical Engineering and Information Systems, Graduate School of Engineering, The University of Tokyo, Tokyo, Japan. Email: [email protected] Received September 13th, 2013; revised October 12th, 2013; accepted October 20th, 2013 Copyright © 2013 Miyako Enokibori et al. This is an open access article distributed under the Creative Commons Attribution Li- cense, which permits unrestricted use, distribution, and reproduction in any medium, provided the original work is properly cited. ABSTRACT Using data from a survey, we examined actions taken by large corporations based in three countries to combat climate change and related these actions to the corporations’ financial performance. We analyzed the correlation between finan- cial performance and climate change management performance to determine the extent that climate change manage- ment activities are a net cost or a net benefit to companies. We found that corporate climate change management per- formance is generally positively correlated with financial performance, but that the relationship differs among countries due to national-level external factors. A case study of Japanese automobile manufacturing companies showed that sales of a company’s fuel-efficient cars, reflecting consumers’ awareness of climate change, are associated with higher valua- tion by financial markets. Keywords: Corporate Climate Change Management; Financial Analysis; Correlation Analysis; Automobile Manufacturer; Vehicle Fuel Efficiency 1. Introduction Climate change has been recognized as a serious issue for a considerable time, and is addressed in various ways in different industrial sectors. Companies may reduce greenhouse gas emissions resulting from their operations and products, either voluntarily or by mandate. Initially it was generally believed that emissions reduction would be a high net cost, and have little “bottom-line” benefit to companies. In recent years, however, consumers have increased purchases of energy-efficient goods and ser- vices that allow them to reduce their carbon footprint. The increasing demand for this kind of product can now be shown to represent the potential for higher profits. In addition, since the fall of Lehman Brothers in 2008, in- stitutional investors now evaluate such non-financial cor- porate information as environmental, social, and gov- ernance (ESG) factors in addition to traditional financial information. Companies that actively address climate change may therefore be favorably regarded by some investors. The relationship between environmental activities and profits may not be apparent to companies in the absence of relevant data and analysis. Previous studies showed positive relationships between corporate motivation for environmental action and corporate financial indicators or market valuation. Takeda and Tomozawa investigated stock price reactions to the environmental management rankings issued by Nihon Keizai Shimbun (a Japanese financial newspaper). Using a standard event study me- thodology they found that market reaction changed be- tween 2001 and 2002, when the Japanese government demonstrated commitment to environmental policies by establishing a Ministry of the Environment, enacting en- vironmental legislation, and signing the Kyoto Protocol [1]. Kuribayashi and Kameyama concluded that envi- ronmental management activities influence the financial management and valuation of equipment manufacturing companies [2]. Whereas these studies considered the general environmental activities of corporations, we have focused on corporate climate change management in this research. We constructed an index that summarizes cor- porate climate change management performance by us- 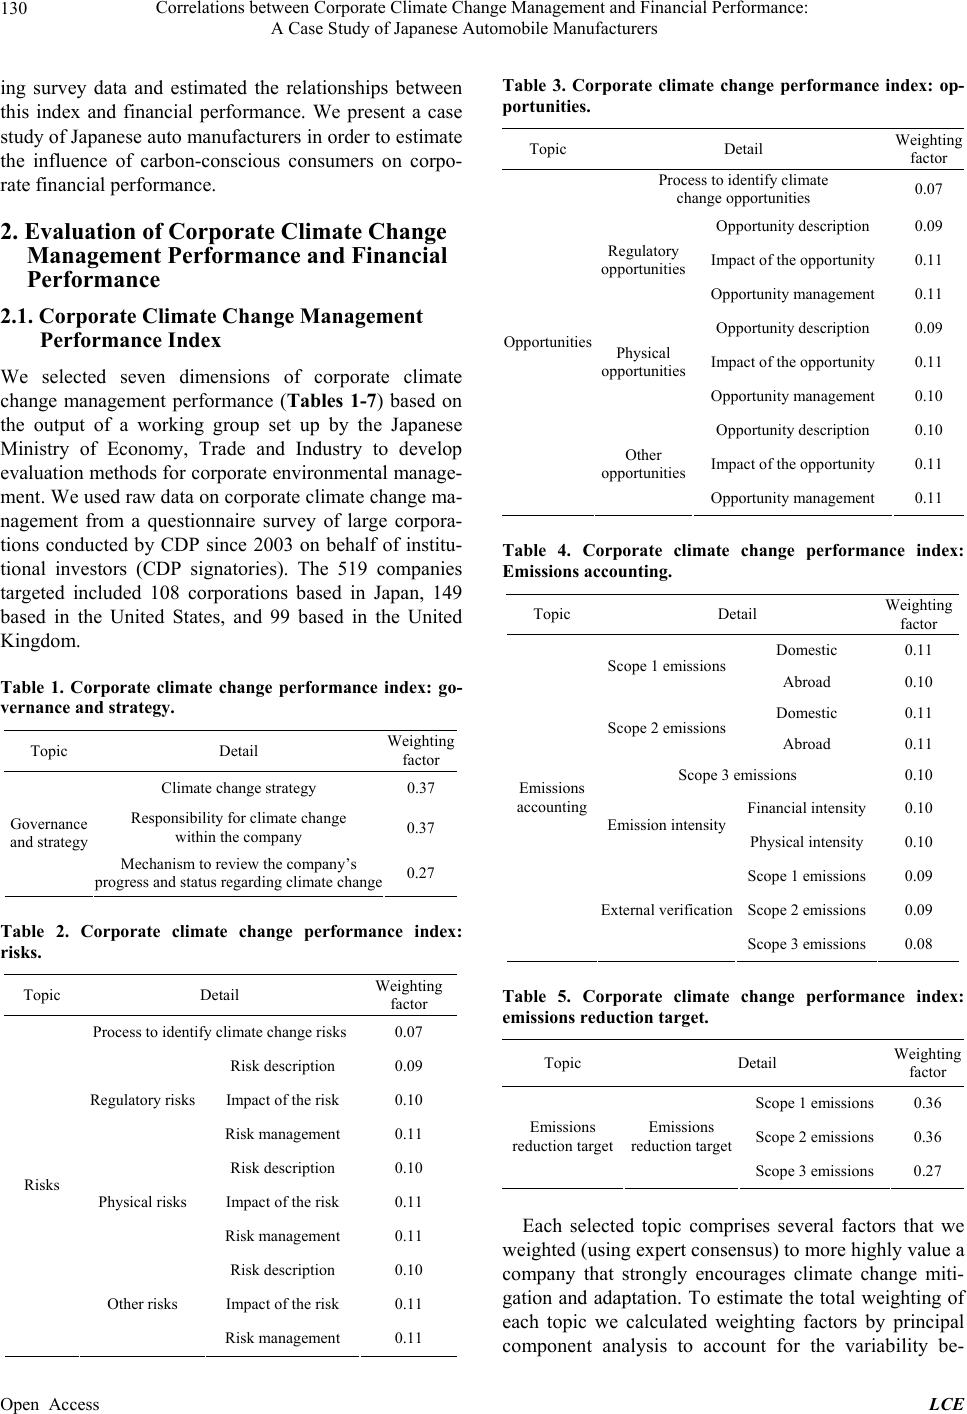 Correlations between Corporate Climate Change Management and Financial Performance: A Case Study of Japanese Automobile Manufacturers 130 ing survey data and estimated the relationships between this index and financial performance. We present a case study of Japanese auto manufacturers in order to estimate the influence of carbon-conscious consumers on corpo- rate financial performance. 2. Evaluation of Corporate Climate Change Management Performance and Financial Performance 2.1. Corporate Climate Change Management Performance Index We selected seven dimensions of corporate climate change management performance (Tables 1-7) based on the output of a working group set up by the Japanese Ministry of Economy, Trade and Industry to develop evaluation methods for corporate environmental manage- ment. We used raw data on corporate climate change ma- nagement from a questionnaire survey of large corpora- tions conducted by CDP since 2003 on behalf of institu- tional investors (CDP signatories). The 519 companies targeted included 108 corporations based in Japan, 149 based in the United States, and 99 based in the United Kingdom. Table 1. Corporate climate change performance index: go- vernance and strategy. Topic Detail Weighting factor Climate change strategy 0.37 Responsibility for climate change within the company 0.37 Governance and strategy Mechanism to review the company’s progress and status regarding climate change0.27 Table 2. Corporate climate change performance index: risks. Topic Detail Weighting factor Process to identify climate change risks 0.07 Risk description 0.09 Impact of the risk 0.10 Regulatory risks Risk management 0.11 Risk description 0.10 Impact of the risk 0.11 Physical risks Risk management 0.11 Risk description 0.10 Impact of the risk 0.11 Risks Other risks Risk management 0.11 Table 3. Corporate climate change performance index: op- portunities. Topic Detail Weighting factor Process to identify climate change opportunities 0.07 Opportunity description 0.09 Impact of the opportunity 0.11 Regulatory opportunities Opportunity management 0.11 Opportunity description 0.09 Impact of the opportunity 0.11 Physical opportunities Opportunity management 0.10 Opportunity description 0.10 Impact of the opportunity 0.11 Opportunities Other opportunities Opportunity management 0.11 Table 4. Corporate climate change performance index: Emissions accounting. Topic Detail Weighting factor Domestic 0.11 Scope 1 emissions Abroad 0.10 Domestic 0.11 Scope 2 emissions Abroad 0.11 Scope 3 emissions 0.10 Financial intensity 0.10 Emission intensity Physical intensity 0.10 Scope 1 emissions 0.09 Scope 2 emissions 0.09 Emissions accounting External verification Scope 3 emissions 0.08 Table 5. Corporate climate change performance index: emissions reduction target. Topic Detail Weighting factor Scope 1 emissions 0.36 Scope 2 emissions 0.36 Emissions reduction target Emissions reduction target Scope 3 emissions 0.27 Each selected topic comprises several factors that we weighted (using expert consensus) to more highly value a company that strongly encourages climate change miti- gation and adaptation. To estimate the total weighting of each topic we calculated weighting factors by principal component analysis to account for the variability be- Open Access LCE 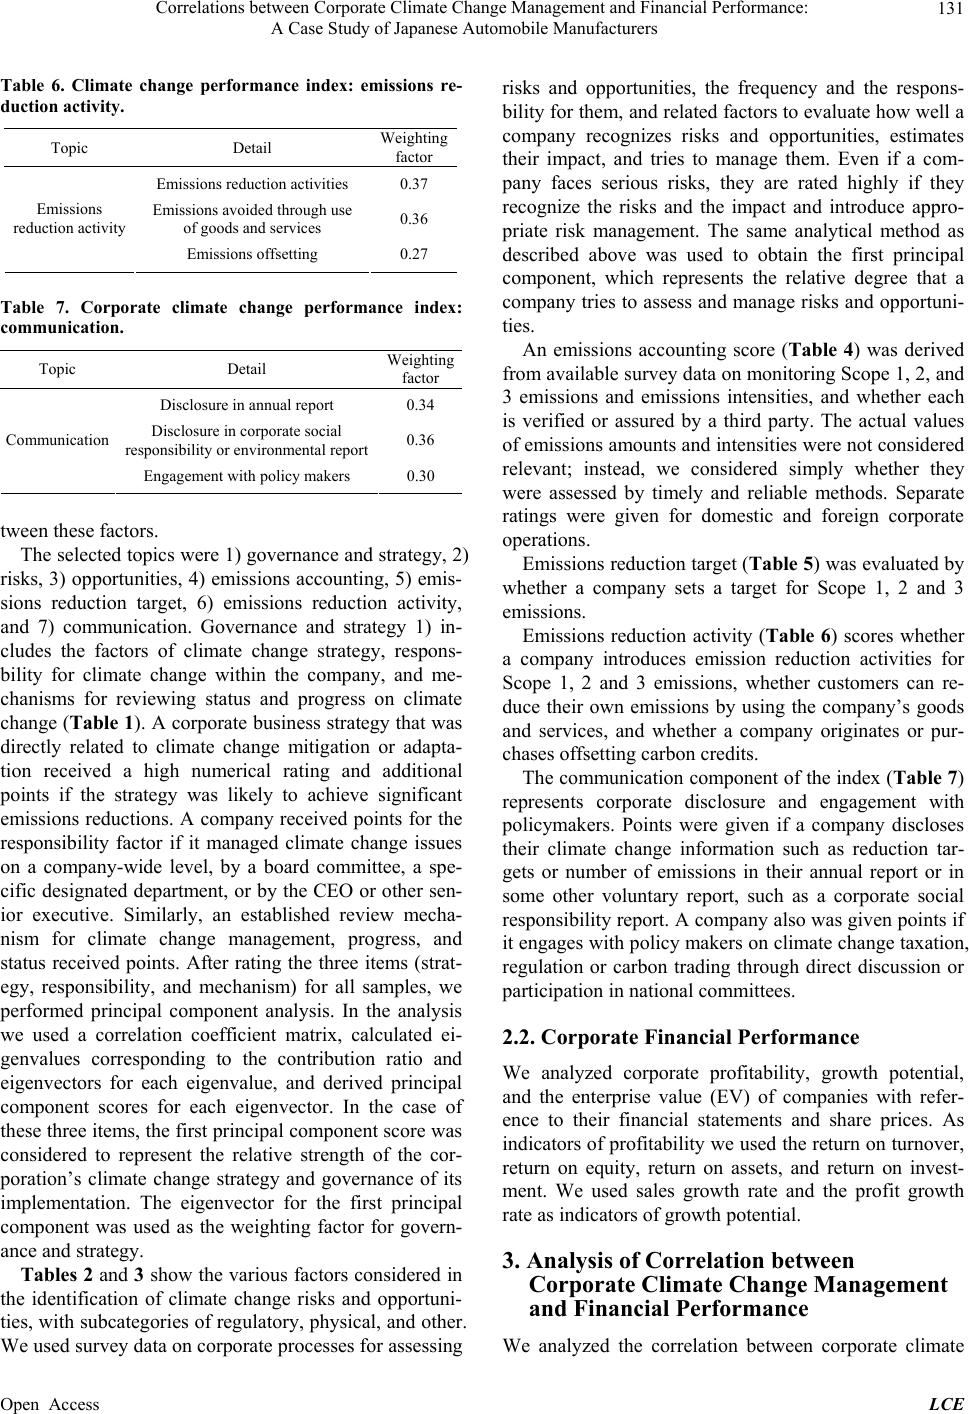 Correlations between Corporate Climate Change Management and Financial Performance: A Case Study of Japanese Automobile Manufacturers 131 Table 6. Climate change performance index: emissions re- duction activity. Topic Detail Weighting factor Emissions reduction activities 0.37 Emissions avoided through use of goods and services 0.36 Emissions reduction activity Emissions offsetting 0.27 Table 7. Corporate climate change performance index: communication. Topic Detail Weighting factor Disclosure in annual report 0.34 Disclosure in corporate social responsibility or environmental report 0.36 Communication Engagement with policy makers 0.30 tween these factors. The selected topics were 1) governance and strategy, 2) risks, 3) opportunities, 4) emissions accounting, 5) emis- sions reduction target, 6) emissions reduction activity, and 7) communication. Governance and strategy 1) in- cludes the factors of climate change strategy, respons- bility for climate change within the company, and me- chanisms for reviewing status and progress on climate change (Table 1). A corporate business strategy that was directly related to climate change mitigation or adapta- tion received a high numerical rating and additional points if the strategy was likely to achieve significant emissions reductions. A company received points for the responsibility factor if it managed climate change issues on a company-wide level, by a board committee, a spe- cific designated department, or by the CEO or other sen- ior executive. Similarly, an established review mecha- nism for climate change management, progress, and status received points. After rating the three items (strat- egy, responsibility, and mechanism) for all samples, we performed principal component analysis. In the analysis we used a correlation coefficient matrix, calculated ei- genvalues corresponding to the contribution ratio and eigenvectors for each eigenvalue, and derived principal component scores for each eigenvector. In the case of these three items, the first principal component score was considered to represent the relative strength of the cor- poration’s climate change strategy and governance of its implementation. The eigenvector for the first principal component was used as the weighting factor for govern- ance and strategy. Tables 2 and 3 show the various factors considered in the identification of climate change risks and opportuni- ties, with subcategories of regulatory, physical, and other. We used survey data on corporate processes for assessing risks and opportunities, the frequency and the respons- bility for them, and related factors to evaluate how well a company recognizes risks and opportunities, estimates their impact, and tries to manage them. Even if a com- pany faces serious risks, they are rated highly if they recognize the risks and the impact and introduce appro- priate risk management. The same analytical method as described above was used to obtain the first principal component, which represents the relative degree that a company tries to assess and manage risks and opportuni- ties. An emissions accounting score (Table 4) was derived from available survey data on monitoring Scope 1, 2, and 3 emissions and emissions intensities, and whether each is verified or assured by a third party. The actual values of emissions amounts and intensities were not considered relevant; instead, we considered simply whether they were assessed by timely and reliable methods. Separate ratings were given for domestic and foreign corporate operations. Emissions reduction target (Table 5) was evaluated by whether a company sets a target for Scope 1, 2 and 3 emissions. Emissions reduction activity (Table 6) scores whether a company introduces emission reduction activities for Scope 1, 2 and 3 emissions, whether customers can re- duce their own emissions by using the company’s goods and services, and whether a company originates or pur- chases offsetting carbon credits. The communication component of the index (Table 7) represents corporate disclosure and engagement with policymakers. Points were given if a company discloses their climate change information such as reduction tar- gets or number of emissions in their annual report or in some other voluntary report, such as a corporate social responsibility report. A company also was given points if it engages with policy makers on climate change taxation, regulation or carbon trading through direct discussion or participation in national committees. 2.2. Corporate Financial Performance We analyzed corporate profitability, growth potential, and the enterprise value (EV) of companies with refer- ence to their financial statements and share prices. As indicators of profitability we used the return on turnover, return on equity, return on assets, and return on invest- ment. We used sales growth rate and the profit growth rate as indicators of growth potential. 3. Analysis of Correlation between Corporate Climate Change Management and Financial Performance We analyzed the correlation between corporate climate Open Access LCE 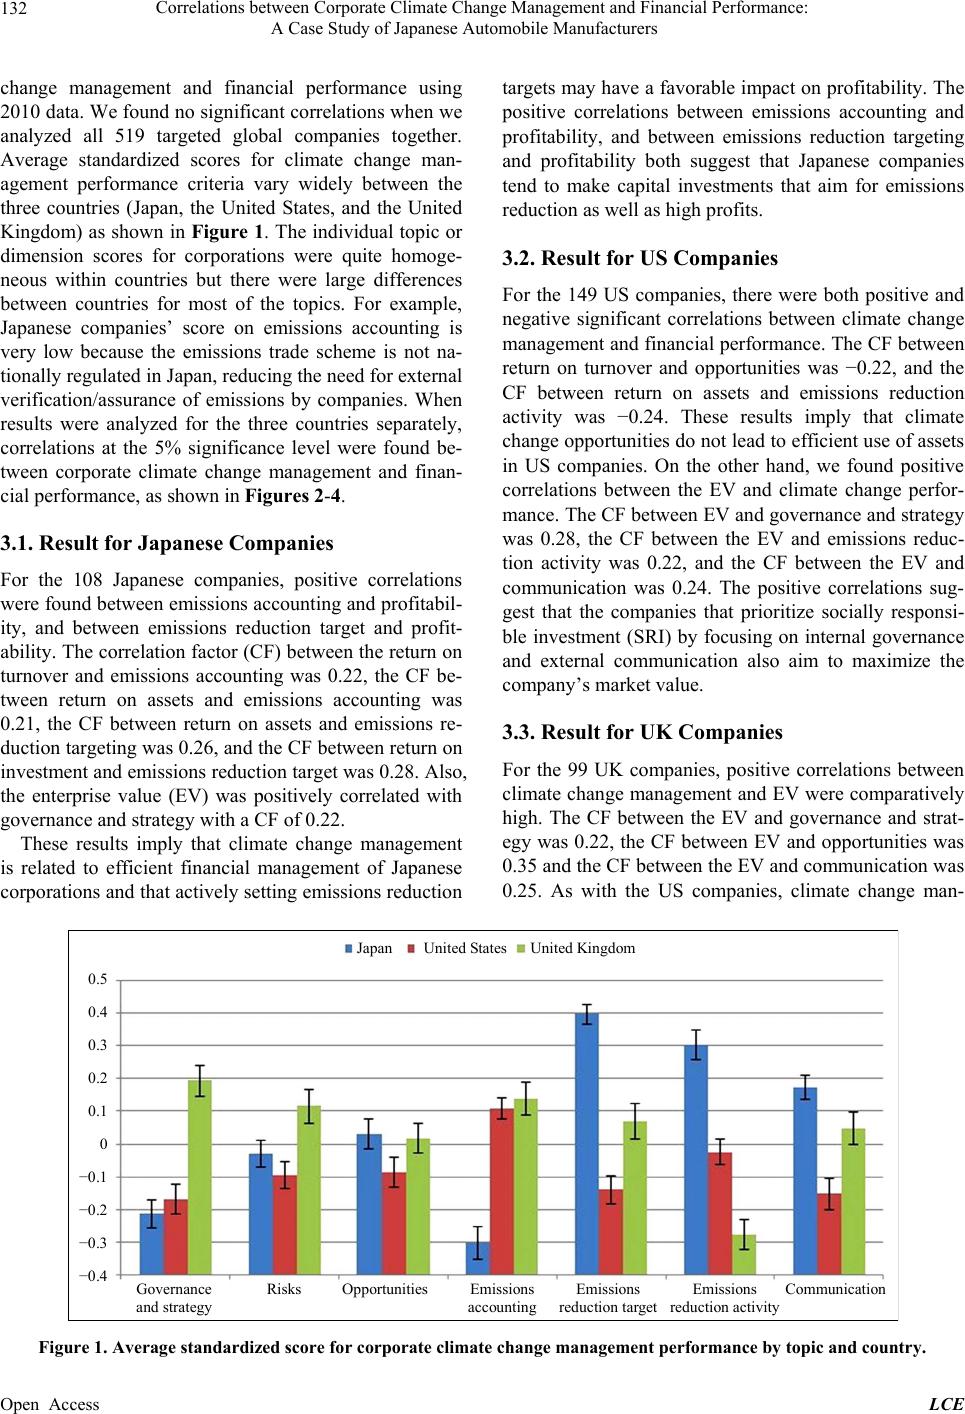 Correlations between Corporate Climate Change Management and Financial Performance: A Case Study of Japanese Automobile Manufacturers Open Access LCE 132 change management and financial performance using 2010 data. We found no significant correlations when we analyzed all 519 targeted global companies together. Average standardized scores for climate change man- agement performance criteria vary widely between the three countries (Japan, the United States, and the United Kingdom) as shown in Figure 1. The individual topic or dimension scores for corporations were quite homoge- neous within countries but there were large differences between countries for most of the topics. For example, Japanese companies’ score on emissions accounting is very low because the emissions trade scheme is not na- tionally regulated in Japan, reducing the need for external verification/assurance of emissions by companies. When results were analyzed for the three countries separately, correlations at the 5% significance level were found be- tween corporate climate change management and finan- cial performance, as shown in Figures 2-4. targets may have a favorable impact on profitability. The positive correlations between emissions accounting and profitability, and between emissions reduction targeting and profitability both suggest that Japanese companies tend to make capital investments that aim for emissions reduction as well as high profits. 3.2. Result for US Companies For the 149 US companies, there were both positive and negative significant correlations between climate change management and financial performance. The CF between return on turnover and opportunities was −0.22, and the CF between return on assets and emissions reduction activity was −0.24. These results imply that climate change opportunities do not lead to efficient use of assets in US companies. On the other hand, we found positive correlations between the EV and climate change perfor- mance. The CF between EV and governance and strategy was 0.28, the CF between the EV and emissions reduc- tion activity was 0.22, and the CF between the EV and communication was 0.24. The positive correlations sug- gest that the companies that prioritize socially responsi- ble investment (SRI) by focusing on internal governance and external communication also aim to maximize the company’s market value. 3.1. Result for Japanese Companies For the 108 Japanese companies, positive correlations were found between emissions accounting and profitabil- ity, and between emissions reduction target and profit- ability. The correlation factor (CF) between the return on turnover and emissions accounting was 0.22, the CF be- tween return on assets and emissions accounting was 0.21, the CF between return on assets and emissions re- duction targeting was 0.26, and the CF between return on investment and emissions reduction target was 0.28. Also, the enterprise value (EV) was positively correlated with governance and strategy with a CF of 0.22. 3.3. Result for UK Companies For the 99 UK companies, positive correlations between climate change management and EV were comparatively high. The CF between the EV and governance and strat- egy was 0.22, the CF between EV and opportunities was 0.35 and the CF between the EV and communication was 0.25. As with the US companies, climate change man- These results imply that climate change management is related to efficient financial management of Japanese corporations and that actively setting emissions reduction Japan United States United Kingdom Governance and strategy Risks Opportunities Emissions accounting Emissions reduction target Emissions reduction activity Communication 0.5 0.4 0.3 0.2 0.1 0 −0.1 −0.2 −0.3 −0.4 Figure 1. Average standardized score for corporate climate change management performance by topic and country. 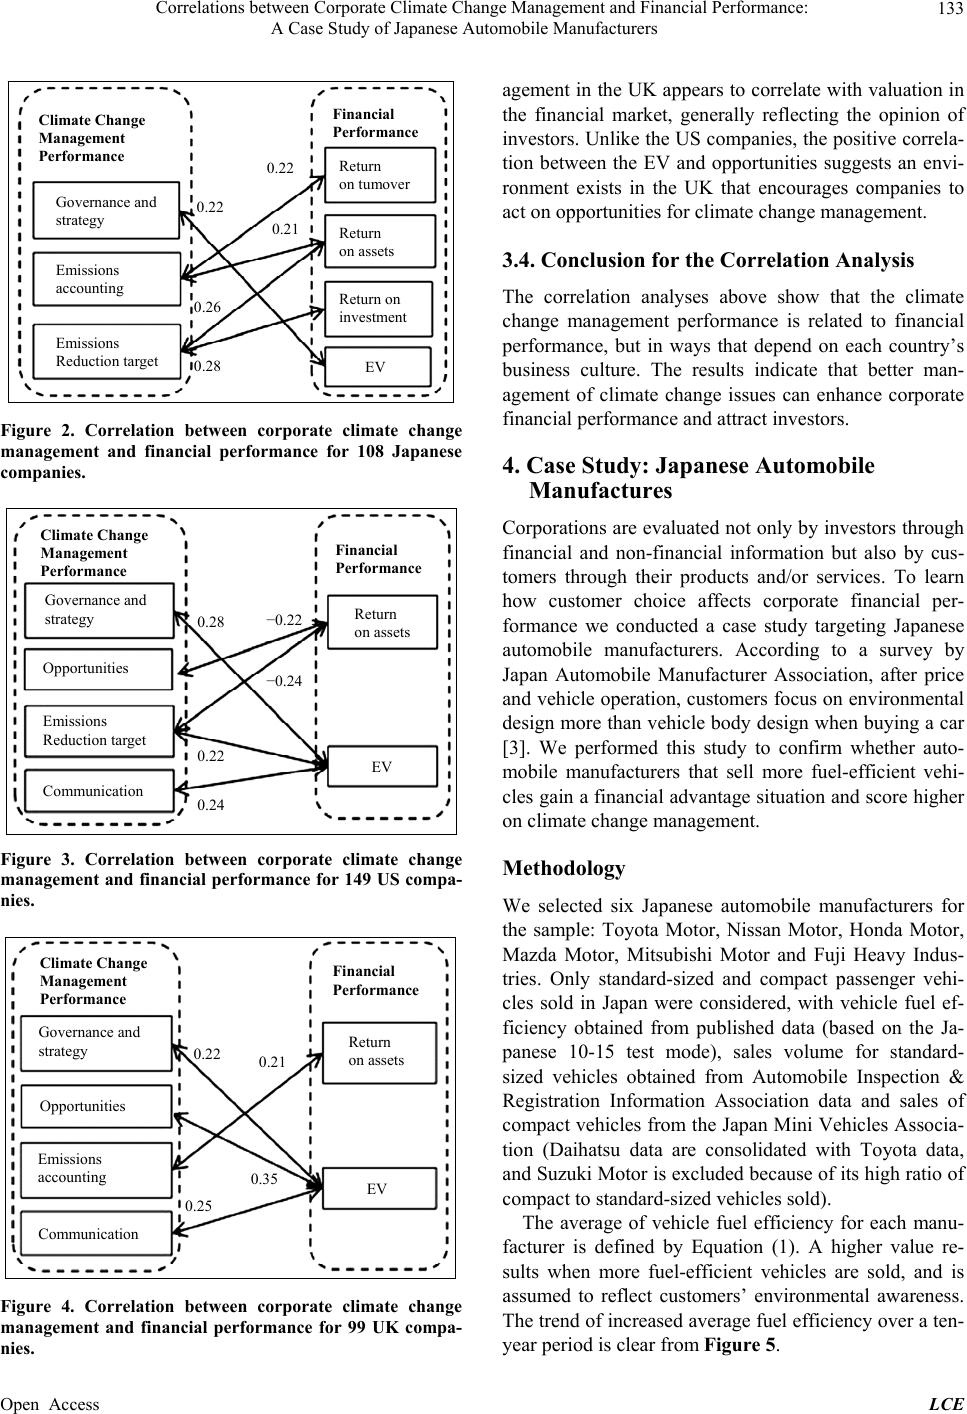 Correlations between Corporate Climate Change Management and Financial Performance: A Case Study of Japanese Automobile Manufacturers 133 Climate Change Management Performance Financial Performance 0.22 0.22 0.21 0.26 0.28 Governance and strategy Emissions accounting Emissions Reduction target Return on tumover Return on assets Return on investment EV Figure 2. Correlation between corporate climate change management and financial performance for 108 Japanese companies. Opportunities Climate Change Management Performance Financial Performance Governance and strategy Emissions Reduction target Opportunities Communication 0.28 0.22 0.24 −0.24 −0.22 Return on assets EV Figure 3. Correlation between corporate climate change management and financial performance for 149 US compa- nies. Climate Change Management Performance Financial Performance Return on assets EV Governance and strategy Opportunities Emissions accounting Communication 0.22 0.25 0.35 0.21 Figure 4. Correlation between corporate climate change management and financial performance for 99 UK compa- nies. agement in the UK appears to correlate with valuation in the financial market, generally reflecting the opinion of investors. Unlike the US companies, the positive correla- tion between the EV and opportunities suggests an envi- ronment exists in the UK that encourages companies to act on opportunities for climate change management. 3.4. Conclusion for the Correlation Analysis The correlation analyses above show that the climate change management performance is related to financial performance, but in ways that depend on each country’s business culture. The results indicate that better man- agement of climate change issues can enhance corporate financial performance and attract investors. 4. Case Study: Japanese Automobile Manufactures Corporations are evaluated not only by investors through financial and non-financial information but also by cus- tomers through their products and/or services. To learn how customer choice affects corporate financial per- formance we conducted a case study targeting Japanese automobile manufacturers. According to a survey by Japan Automobile Manufacturer Association, after price and vehicle operation, customers focus on environmental design more than vehicle body design when buying a car [3]. We performed this study to confirm whether auto- mobile manufacturers that sell more fuel-efficient vehi- cles gain a financial advantage situation and score higher on climate change management. Methodology We selected six Japanese automobile manufacturers for the sample: Toyota Motor, Nissan Motor, Honda Motor, Mazda Motor, Mitsubishi Motor and Fuji Heavy Indus- tries. Only standard-sized and compact passenger vehi- cles sold in Japan were considered, with vehicle fuel ef- ficiency obtained from published data (based on the Ja- panese 10-15 test mode), sales volume for standard- sized vehicles obtained from Automobile Inspection & Registration Information Association data and sales of compact vehicles from the Japan Mini Vehicles Associa- tion (Daihatsu data are consolidated with Toyota data, and Suzuki Motor is excluded because of its high ratio of compact to standard-sized vehicles sold). The average of vehicle fuel efficiency for each manu- facturer is defined by Equation (1). A higher value re- sults when more fuel-efficient vehicles are sold, and is assumed to reflect customers’ environmental awareness. The trend of increased average fuel efficiency over a ten- year period is clear from Figure 5. Open Access LCE 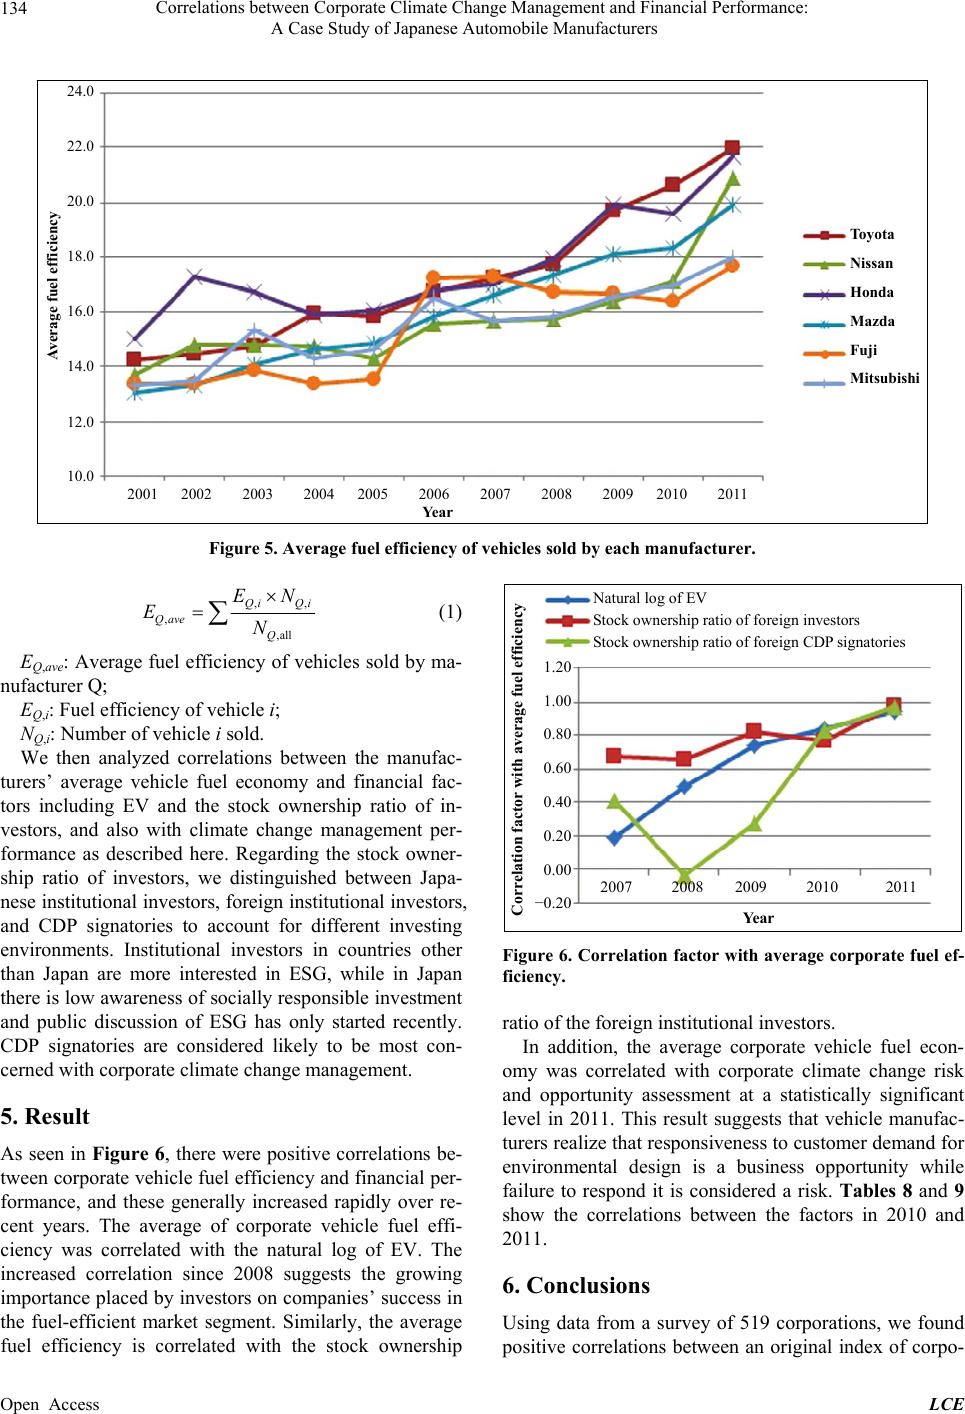 Correlations between Corporate Climate Change Management and Financial Performance: A Case Study of Japanese Automobile Manufacturers 134 24.0 22.0 20.0 18.0 16.0 14.0 12.0 10.0 2001 2002 2003 2004 2005 2006 2007 2008 2009 2010 2011 Year Toyota Nissan Honda Mazda Fuji Mitsubishi Average fuel efficiency Figure 5. Average fuel efficiency of vehicles sold by each manufacturer. , , ,all Qi Qi Qave Q EN EN , (1) EQ,ave: Average fuel efficiency of vehicles sold by ma- nufacturer Q; EQ,i: Fuel efficiency of vehicle i; NQ,i: Number of vehicle i sold. We then analyzed correlations between the manufac- turers’ average vehicle fuel economy and financial fac- tors including EV and the stock ownership ratio of in- vestors, and also with climate change management per- formance as described here. Regarding the stock owner- ship ratio of investors, we distinguished between Japa- nese institutional investors, foreign institutional investors, and CDP signatories to account for different investing environments. Institutional investors in countries other than Japan are more interested in ESG, while in Japan there is low awareness of socially responsible investment and public discussion of ESG has only started recently. CDP signatories are considered likely to be most con- cerned with corporate climate change management. 5. Result As seen in Figure 6, there were positive correlations be- tween corporate vehicle fuel efficiency and financial per- formance, and these generally increased rapidly over re- cent years. The average of corporate vehicle fuel effi- ciency was correlated with the natural log of EV. The increased correlation since 2008 suggests the growing importance placed by investors on companies’ success in the fuel-efficient market segment. Similarly, the average fuel efficiency is correlated with the stock ownership 2007 2008 2009 2010 2011 Year 1.20 1.00 0.80 0.60 0.40 0.20 0.00 −0.20 Correlation factor with average fuel efficiency N atural log of EV Stock ownership ratio of foreign investors Stock ownership ratio of foreign CDP signatories Figure 6. Correlation factor with average corporate fuel ef- ficiency. ratio of the foreign institutional investors. In addition, the average corporate vehicle fuel econ- omy was correlated with corporate climate change risk and opportunity assessment at a statistically significant level in 2011. This result suggests that vehicle manufac- turers realize that responsiveness to customer demand for environmental design is a business opportunity while failure to respond it is considered a risk. Tables 8 and 9 show the correlations between the factors in 2010 and 2011. 6. Conclusions Using data from a survey of 519 corporations, we found positive correlations between an original index of corpo- Open Access LCE 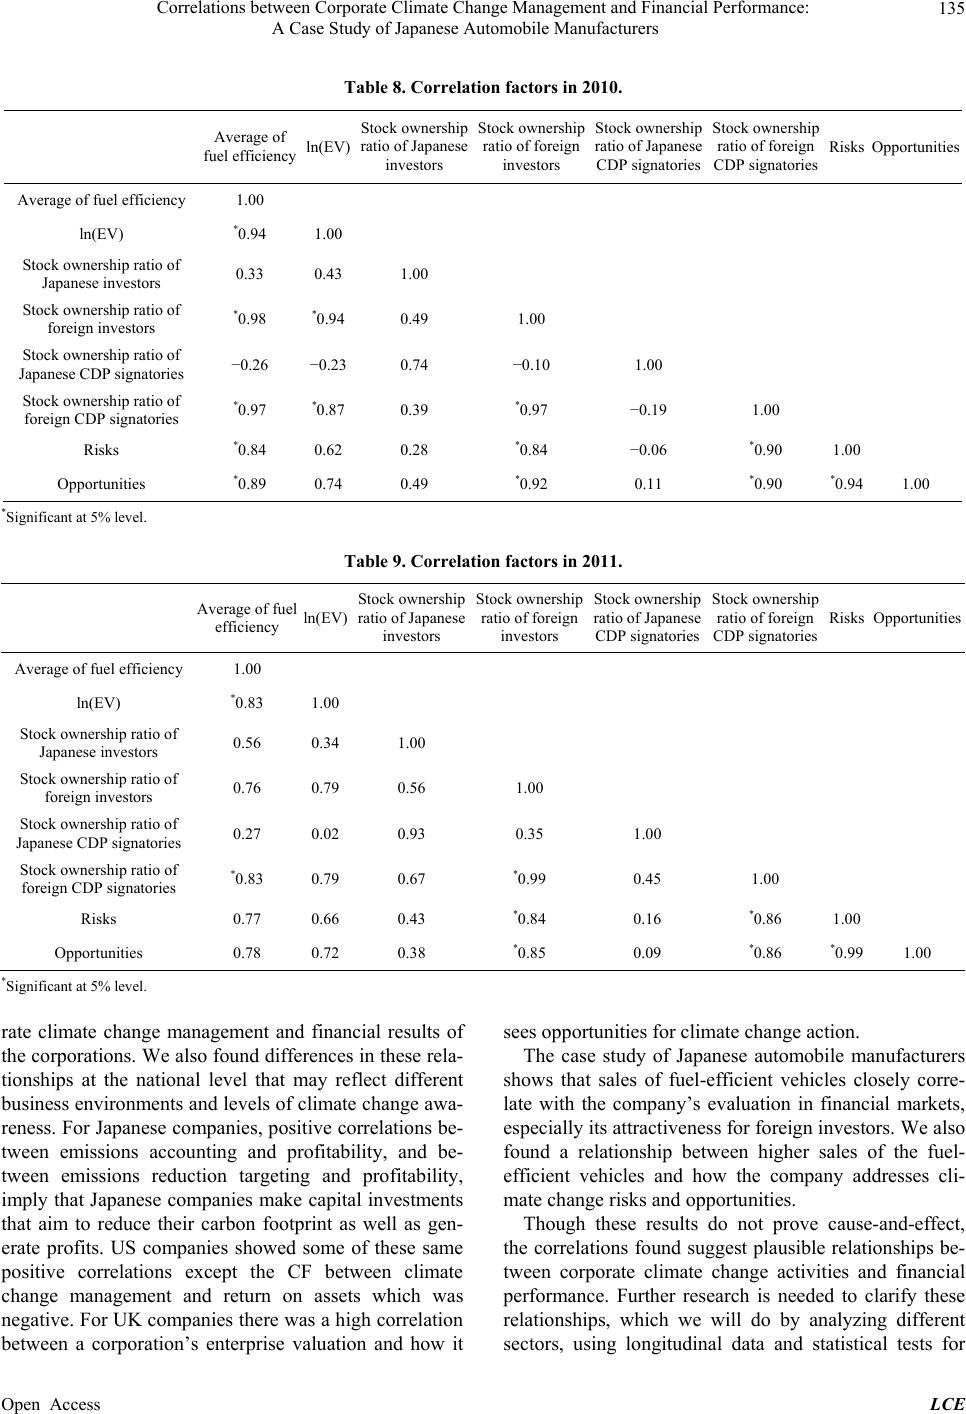 Correlations between Corporate Climate Change Management and Financial Performance: A Case Study of Japanese Automobile Manufacturers 135 Table 8. Correlation factors in 2010. Average of fuel efficiency ln(EV) Stock ownership ratio of Japanese investors Stock ownership ratio of foreign investors Stock ownership ratio of Japanese CDP signatories Stock ownership ratio of foreign CDP signatories Risks Opportunities Average of fuel efficiency 1.00 ln(EV) *0.94 1.00 Stock ownership ratio of Japanese investors 0.33 0.43 1.00 Stock ownership ratio of foreign investors *0.98 *0.94 0.49 1.00 Stock ownership ratio of Japanese CDP signatories −0.26 −0.23 0.74 −0.10 1.00 Stock ownership ratio of foreign CDP signatories *0.97 *0.87 0.39 *0.97 −0.19 1.00 Risks *0.84 0.62 0.28 *0.84 −0.06 *0.90 1.00 Opportunities *0.89 0.74 0.49 *0.92 0.11 *0.90 *0.94 1.00 *Significant at 5% level. Table 9. Correlation factors in 2011. Average of fuel efficiency ln(EV) Stock ownership ratio of Japanese investors Stock ownership ratio of foreign investors Stock ownership ratio of Japanese CDP signatories Stock ownership ratio of foreign CDP signatories Risks Opportunities Average of fuel efficiency 1.00 ln(EV) *0.83 1.00 Stock ownership ratio of Japanese investors 0.56 0.34 1.00 Stock ownership ratio of foreign investors 0.76 0.79 0.56 1.00 Stock ownership ratio of Japanese CDP signatories 0.27 0.02 0.93 0.35 1.00 Stock ownership ratio of foreign CDP signatories *0.83 0.79 0.67 *0.99 0.45 1.00 Risks 0.77 0.66 0.43 *0.84 0.16 *0.86 1.00 Opportunities 0.78 0.72 0.38 *0.85 0.09 *0.86 *0.99 1.00 *Significant at 5% level. rate climate change management and financial results of the corporations. We also found differences in these rela- tionships at the national level that may reflect different business environments and levels of climate change awa- reness. For Japanese companies, positive correlations be- tween emissions accounting and profitability, and be- tween emissions reduction targeting and profitability, imply that Japanese companies make capital investments that aim to reduce their carbon footprint as well as gen- erate profits. US companies showed some of these same positive correlations except the CF between climate change management and return on assets which was negative. For UK companies there was a high correlation between a corporation’s enterprise valuation and how it sees opportunities for climate change action. The case study of Japanese automobile manufacturers shows that sales of fuel-efficient vehicles closely corre- late with the company’s evaluation in financial markets, especially its attractiveness for foreign investors. We also found a relationship between higher sales of the fuel- efficient vehicles and how the company addresses cli- mate change risks and opportunities. Though these results do not prove cause-and-effect, the correlations found suggest plausible relationships be- tween corporate climate change activities and financial performance. Further research is needed to clarify these relationships, which we will do by analyzing different sectors, using longitudinal data and statistical tests for Open Access LCE  Correlations between Corporate Climate Change Management and Financial Performance: A Case Study of Japanese Automobile Manufacturers 136 causality. REFERENCES [1] F. Takeda and T. Tomozawa, “A Change in Market Re- sponses to the Environmental Management Ranking in Japan,” Ecological Economics, Vol. 67, No. 3, 2008, pp. 465-472. http://dx.doi.org/10.1016/j.ecolecon.2007.12.027 [2] M. Kuribayashi and Y. Kameyama, “Estimation of Influ- ence of Environmental Management Activities and Em- ployment System of Machinery Manufacturers on Their Management,” Environmental Information Science, Vol. 24, 2010, pp. 189-194. [3] Japan Automobile Manufacturers Association, Inc., “Mo- torcycle Market Trends in Japan in Fiscal 2011,” 2012. http://www.jama.or.jp/release/news/attachement/2012040 4_jouyou.pdf Open Access LCE |