

Paper Menu >>
Journal Menu >>
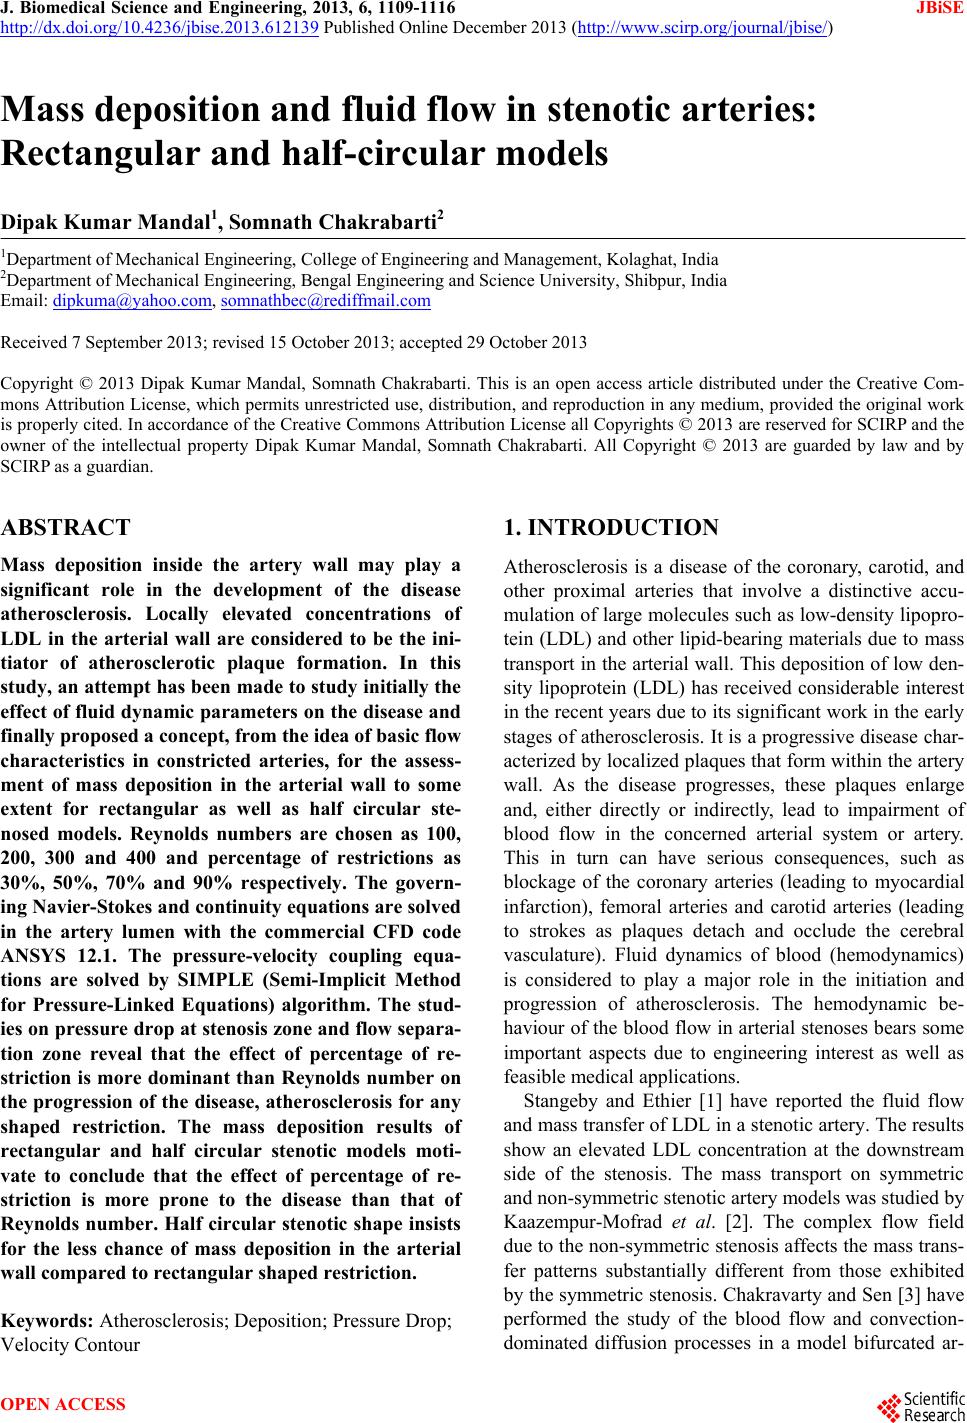 J. Biomedical Science and Engineering, 2013, 6, 1109-1116 JBiSE http://dx.doi.org/10.4236/jbise.2013.612139 Published Online December 2013 (http://www.scirp.org/journal/jbise/) Mass deposition and fluid flow in stenotic arteries: Rectangular and half-circular models Dipak Kumar Mandal1, Somnath Chakrabarti2 1Department of Mechanical Engineering, College of Engineering and Management, Kolaghat, India 2Department of Mechanical Engineering, Bengal Engineering and Science University, Shibpur, India Email: [email protected], [email protected] Received 7 September 2013; revised 15 October 2013; accepted 29 October 2013 Copyright © 2013 Dipak Kumar Mandal, Somnath Chakrabarti. This is an open access article distributed under the Creative Com- mons Attribution License, which permits unrestricted use, distribution, and reproduction in any medium, provided the original work is properly cited. In accordance of the Creative Commons Attribution License all Copyrights © 2013 are reserved for SCIRP and the owner of the intellectual property Dipak Kumar Mandal, Somnath Chakrabarti. All Copyright © 2013 are guarded by law and by SCIRP as a guardian. ABSTRACT Mass deposition inside the artery wall may play a significant role in the development of the disease atherosclerosis. Locally elevated concentrations of LDL in the arterial wall are considered to be the ini- tiator of atherosclerotic plaque formation. In this study, an attempt has been made to study initially the effect of fluid dyna mic parameters on the disease and finally proposed a concept, from the idea of basic flow characteristics in constricted arteries, for the assess- ment of mass deposition in the arterial wall to some extent for rectangular as well as half circular ste- nosed models. Reynolds numbers are chosen as 100, 200, 300 and 400 and percentage of restrictions as 30%, 50%, 70% and 90% respectively. The govern- ing Navier-Stokes and continuity equations are solved in the artery lumen with the commercial CFD code ANSYS 12.1. The pressure-velocity coupling equa- tions are solved by SIMPLE (Semi-Implicit Method for Pressure-Linked Equations) algorithm. The stud- ies on pressure drop at stenosis zone and flow separa- tion zone reveal that the effect of percentage of re- striction is more dominant than Reynolds number on the progression of the disease, atherosclerosis for any shaped restriction. The mass deposition results of rectangular and half circular stenotic models moti- vate to conclude that the effect of percentage of re- striction is more prone to the disease than that of Reynolds number. Half circular stenotic shape insists for the less chance of mass deposition in the arterial wall compared to rectangular shaped restriction. Keywords: Atherosclerosis; Deposition; Pressure Drop; Velocity Contour 1. INTRODUCTION Atherosclerosis is a disease of the coronary, carotid, and other proximal arteries that involve a distinctive accu- mulation of large molecules such as low-density lipopro- tein (LDL) and other lipid-bearing materials due to mass transport in the arterial wall. This deposition of low den- sity lipoprotein (LDL) has received considerable interest in the recent years due to its significant work in the early stages of atherosclerosis. It is a progressive disease char- acterized by localized plaques that form within the artery wall. As the disease progresses, these plaques enlarge and, either directly or indirectly, lead to impairment of blood flow in the concerned arterial system or artery. This in turn can have serious consequences, such as blockage of the coronary arteries (leading to myocardial infarction), femoral arteries and carotid arteries (leading to strokes as plaques detach and occlude the cerebral vasculature). Fluid dynamics of blood (hemodynamics) is considered to play a major role in the initiation and progression of atherosclerosis. The hemodynamic be- haviour of the blood flow in arterial stenoses bears some important aspects due to engineering interest as well as feasible medical applications. Stangeby and Ethier [1] have reported the fluid flow and mass transfer of LDL in a stenotic artery. The results show an elevated LDL concentration at the downstream side of the stenosis. The mass transport on symmetric and non-symmetric stenotic artery models was studied by Kaazempur-Mofrad et al. [2]. The complex flow field due to the non-symmetric stenosis affects the mass trans- fer patterns substantially different from those exhibited by the symmetric stenosis. Chakravarty and Sen [3] have performed the study of the blood flow and convection- dominated diffusion processes in a model bifurcated ar- OPEN ACCESS 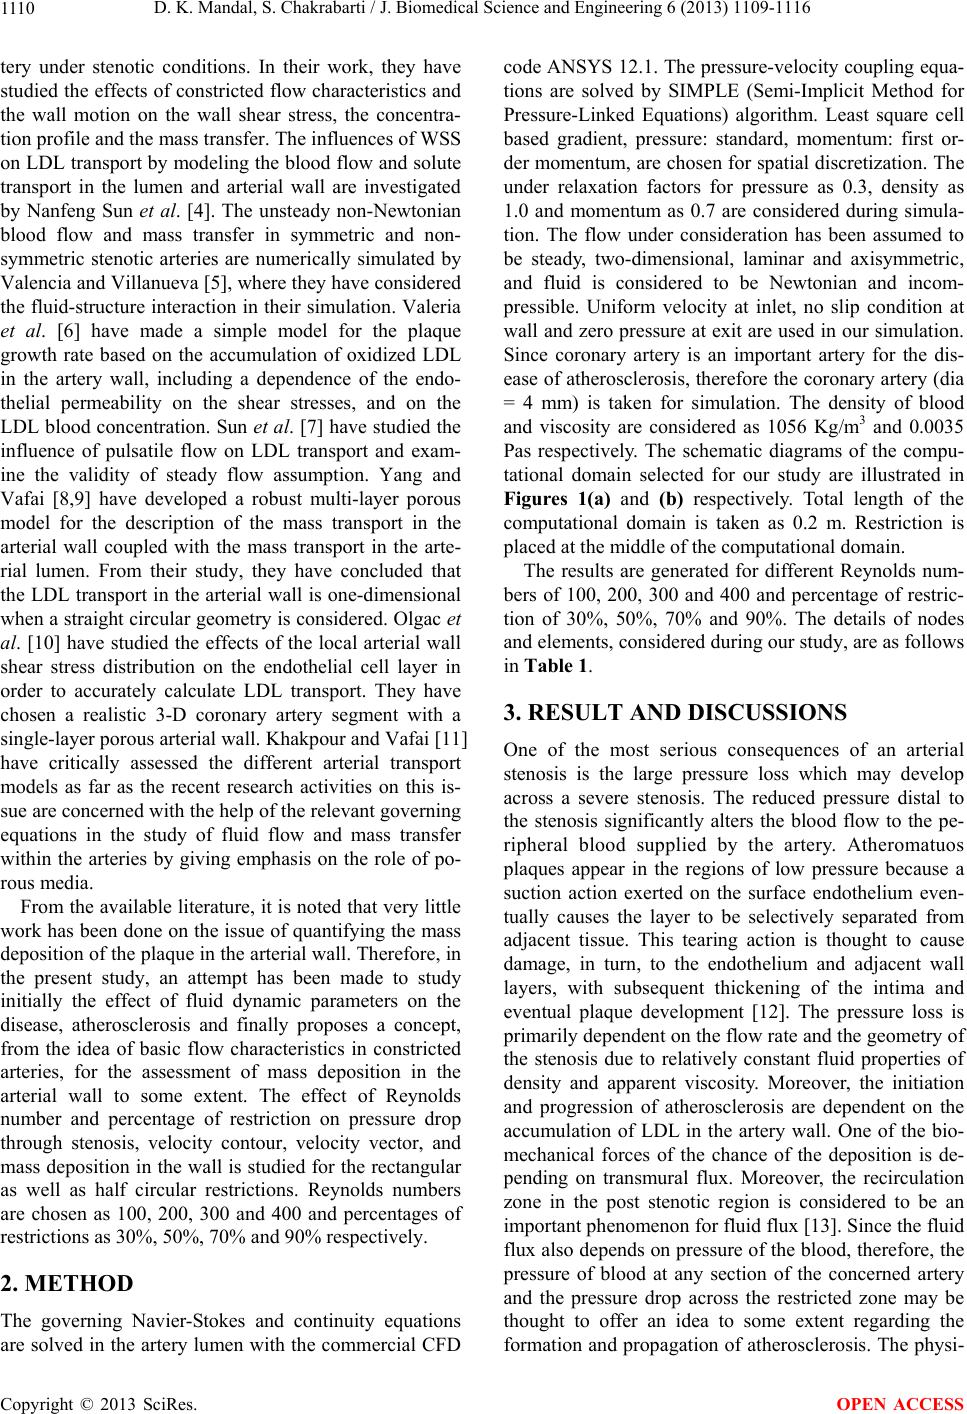 D. K. Mandal, S. Chakrabarti / J. Biomedical Science and Engineering 6 (2013) 1109-1116 1110 tery under stenotic conditions. In their work, they have studied the effects of constricted flow characteristics and the wall motion on the wall shear stress, the concentra- tion profile and the mass transfer. The influences of WSS on LDL transport by modeling the blood flow and solute transport in the lumen and arterial wall are investigated by Nanfeng Sun et al. [4]. The unsteady non-Newtonian blood flow and mass transfer in symmetric and non- symmetric stenotic arteries are numerically simulated by Valencia and Villanueva [5], where they have considered the fluid-structure interaction in their simulation. Valeria et al. [6] have made a simple model for the plaque growth rate based on the accumulation of oxidized LDL in the artery wall, including a dependence of the endo- thelial permeability on the shear stresses, and on the LDL blood concentration. Sun et al. [7] have studied the influence of pulsatile flow on LDL transport and exam- ine the validity of steady flow assumption. Yang and Vafai [8,9] have developed a robust multi-layer porous model for the description of the mass transport in the arterial wall coupled with the mass transport in the arte- rial lumen. From their study, they have concluded that the LDL transport in the arterial wall is one-dimensional when a straight circular geometry is considered. Olgac et al. [10] have studied the effects of the local arterial wall shear stress distribution on the endothelial cell layer in order to accurately calculate LDL transport. They have chosen a realistic 3-D coronary artery segment with a single-layer porous arterial wall. Khakpour and Vafai [11] have critically assessed the different arterial transport models as far as the recent research activities on this is- sue are concerned with the help of the relevant governing equations in the study of fluid flow and mass transfer within the arteries by giving emphasis on the role of po- rous media. From the available literature, it is noted that very little work has been done on the issue of quantifying the mass deposition of the plaque in the arterial wall. Therefore, in the present study, an attempt has been made to study initially the effect of fluid dynamic parameters on the disease, atherosclerosis and finally proposes a concept, from the idea of basic flow characteristics in constricted arteries, for the assessment of mass deposition in the arterial wall to some extent. The effect of Reynolds number and percentage of restriction on pressure drop through stenosis, velocity contour, velocity vector, and mass deposition in the wall is studied for the rectangular as well as half circular restrictions. Reynolds numbers are chosen as 100, 200, 300 and 400 and percentages of restrictions as 30%, 50%, 70% and 90% respectively. 2. METHOD The governing Navier-Stokes and continuity equations are solved in the artery lumen with the commercial CFD code ANSYS 12.1. The pressure-velocity coupling equa- tions are solved by SIMPLE (Semi-Implicit Method for Pressure-Linked Equations) algorithm. Least square cell based gradient, pressure: standard, momentum: first or- der momentum, are chosen for spatial discretization. The under relaxation factors for pressure as 0.3, density as 1.0 and momentum as 0.7 are considered during simula- tion. The flow under consideration has been assumed to be steady, two-dimensional, laminar and axisymmetric, and fluid is considered to be Newtonian and incom- pressible. Uniform velocity at inlet, no slip condition at wall and zero pressure at exit are used in our simulation. Since coronary artery is an important artery for the dis- ease of atherosclerosis, therefore the coronary artery (dia = 4 mm) is taken for simulation. The density of blood and viscosity are considered as 1056 Kg/m3 and 0.0035 Pas respectively. The schematic diagrams of the compu- tational domain selected for our study are illustrated in Figures 1(a) and (b) respectively. Total length of the computational domain is taken as 0.2 m. Restriction is placed at the middle of the computational domain. The results are generated for different Reynolds num- bers of 100, 200, 300 and 400 and percentage of restric- tion of 30%, 50%, 70% and 90%. The details of nodes and elements, considered during our study, are as follows in Table 1. 3. RESULT AND DISCUSSIONS One of the most serious consequences of an arterial stenosis is the large pressure loss which may develop across a severe stenosis. The reduced pressure distal to the stenosis significantly alters the blood flow to the pe- ripheral blood supplied by the artery. Atheromatuos plaques appear in the regions of low pressure because a suction action exerted on the surface endothelium even- tually causes the layer to be selectively separated from adjacent tissue. This tearing action is thought to cause damage, in turn, to the endothelium and adjacent wall layers, with subsequent thickening of the intima and eventual plaque development [12]. The pressure loss is primarily dependent on the flow rate and the geometry of the stenosis due to relatively constant fluid properties of density and apparent viscosity. Moreover, the initiation and progression of atherosclerosis are dependent on the accumulation of LDL in the artery wall. One of the bio- mechanical forces of the chance of the deposition is de- pending on transmural flux. Moreover, the recirculation zone in the post stenotic region is considered to be an important phenomenon for fluid flux [13]. Since the fluid flux also depends on pressure of the blood, therefore, the pressure of blood at any section of the concerned artery and the pressure drop across the restricted zone may be thought to offer an idea to some extent regarding the formation and propagation of atherosclerosis. The physi- Copyright © 2013 SciRes. OPEN ACCESS 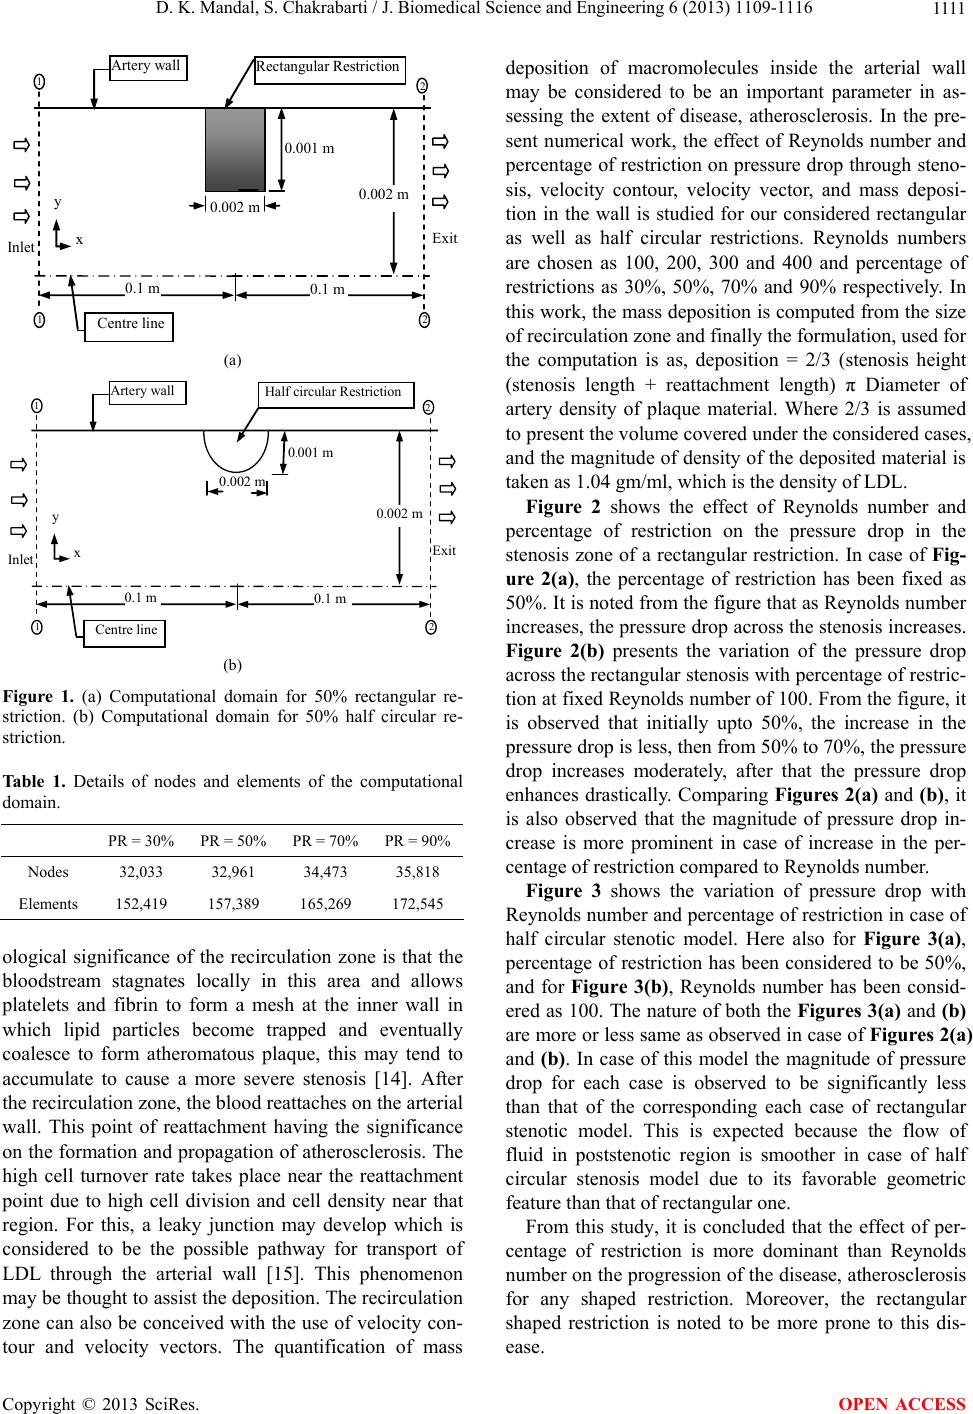 D. K. Mandal, S. Chakrabarti / J. Biomedical Science and Engineering 6 (2013) 1109-1116 1111 0.002 m 0.001 m Centre line Rectangular Restriction x y Inlet 0.1 m Artery wall Exit 0.1 m 0.002 m 21 1 2 (a) 0 . 001 m 0.002 m Centre line Half circular Restriction x y Inlet 0.1 m Artery wall Exit 0.1 m 0.002 m 21 1 2 (b) Figure 1. (a) Computational domain for 50% rectangular re- striction. (b) Computational domain for 50% half circular re- striction. Table 1. Details of nodes and elements of the computational domain. PR = 30% PR = 50% PR = 70% PR = 90% Nodes 32,033 32,961 34,473 35,818 Elements 152,419 157,389 165,269 172,545 ological significance of the recirculation zone is that the bloodstream stagnates locally in this area and allows platelets and fibrin to form a mesh at the inner wall in which lipid particles become trapped and eventually coalesce to form atheromatous plaque, this may tend to accumulate to cause a more severe stenosis [14]. After the recirculation zone, the blood reattaches on the arterial wall. This point of reattachment having the significance on the formation and propagation of atherosclerosis. The high cell turnover rate takes place near the reattachment point due to high cell division and cell density near that region. For this, a leaky junction may develop which is considered to be the possible pathway for transport of LDL through the arterial wall [15]. This phenomenon may be thought to assist the deposition. The recirculation zone can also be conceived with the use of velocity con- tour and velocity vectors. The quantification of mass deposition of macromolecules inside the arterial wall may be considered to be an important parameter in as- sessing the extent of disease, atherosclerosis. In the pre- sent numerical work, the effect of Reynolds number and percentage of restriction on pressure drop through steno- sis, velocity contour, velocity vector, and mass deposi- tion in the wall is studied for our considered rectangular as well as half circular restrictions. Reynolds numbers are chosen as 100, 200, 300 and 400 and percentage of restrictions as 30%, 50%, 70% and 90% respectively. In this work, the mass deposition is computed from the size of recirculation zone and finally the formulation, used for the computation is as, deposition = 2/3 (stenosis height (stenosis length + reattachment length) π Diameter of artery density of plaque material. Where 2/3 is assumed to present the volume covered under the considered cases, and the magnitude of density of the deposited material is taken as 1.04 gm/ml, which is the density of LDL. Figure 2 shows the effect of Reynolds number and percentage of restriction on the pressure drop in the stenosis zone of a rectangular restriction. In case of Fig- ure 2(a), the percentage of restriction has been fixed as 50%. It is noted from the figure that as Reynolds number increases, the pressure drop across the stenosis increases. Figure 2(b) presents the variation of the pressure drop across the rectangular stenosis with percentage of restric- tion at fixed Reynolds number of 100. From the figure, it is observed that initially upto 50%, the increase in the pressure drop is less, then from 50% to 70%, the pressure drop increases moderately, after that the pressure drop enhances drastically. Comparing Figures 2(a) and (b), it is also observed that the magnitude of pressure drop in- crease is more prominent in case of increase in the per- centage of restriction compared to Reynolds number. Figure 3 shows the variation of pressure drop with Reynolds number and percentage of restriction in case of half circular stenotic model. Here also for Figure 3(a), percentage of restriction has been considered to be 50%, and for Figure 3(b), Reynolds number has been consid- ered as 100. The nature of both the Figures 3(a) and (b) are more or less same as observed in case of Figures 2(a) and (b). In case of this model the magnitude of pressure drop for each case is observed to be significantly less than that of the corresponding each case of rectangular stenotic model. This is expected because the flow of fluid in poststenotic region is smoother in case of half circular stenosis model due to its favorable geometric feature than that of rectangular one. From this study, it is concluded that the effect of per- centage of restriction is more dominant than Reynolds number on the progression of the disease, atherosclerosis for any shaped restriction. Moreover, the rectangular shaped restriction is noted to be more prone to this dis- ease. Copyright © 2013 SciRes. OPEN ACCESS 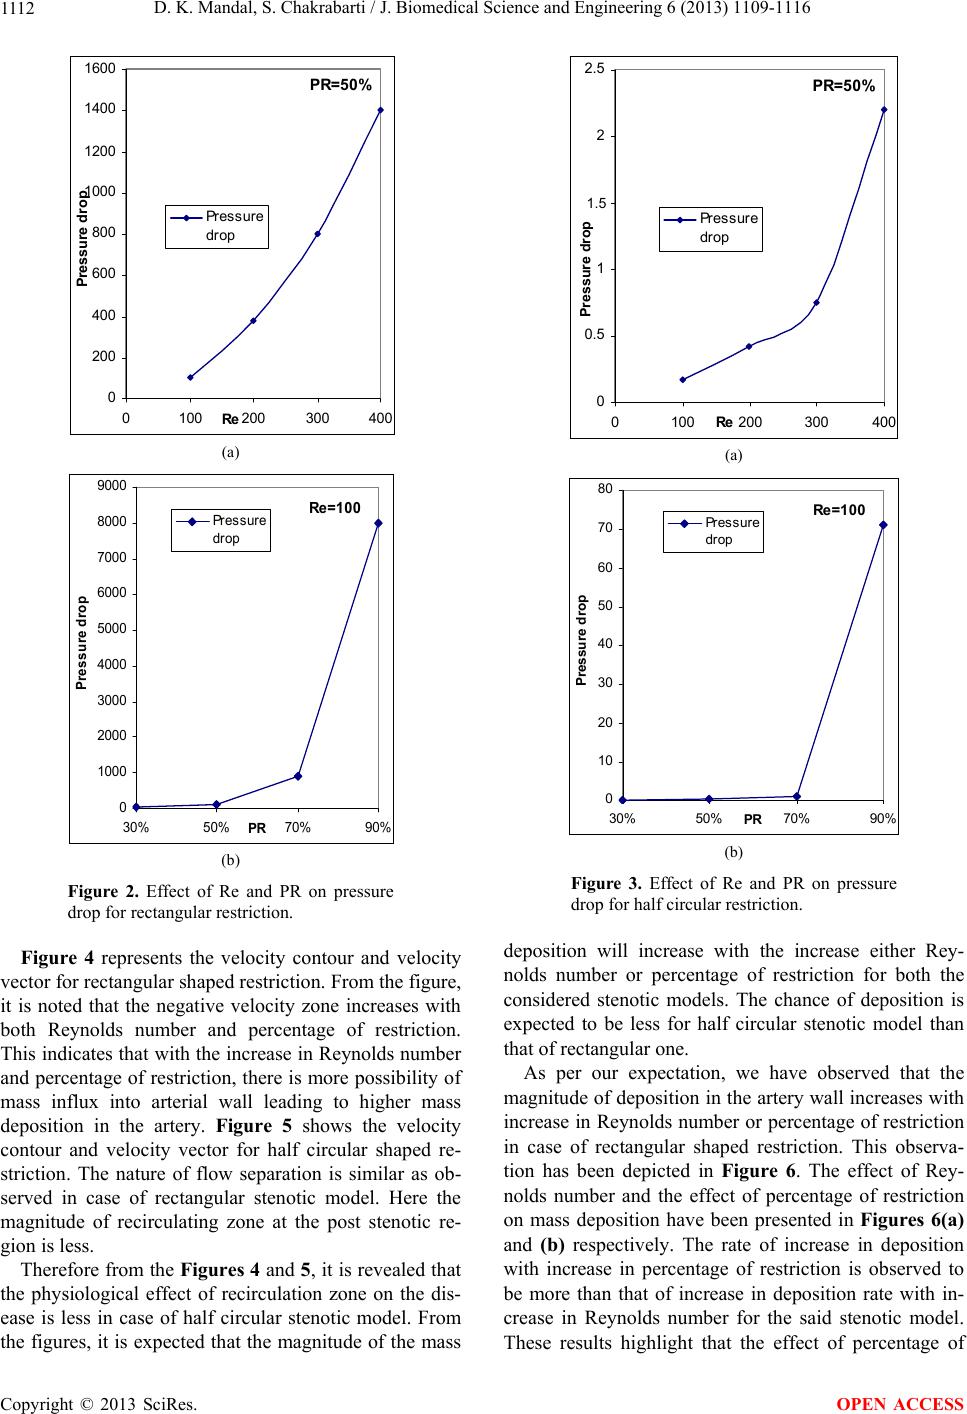 D. K. Mandal, S. Chakrabarti / J. Biomedical Science and Engineering 6 (2013) 1109-1116 1112 PR=50% 0 200 400 600 800 1000 1200 1400 1600 0100 200300 400 Re Pressure drop Pr es s ur e dr o p (a) Re=100 0 1000 2000 3000 4000 5000 6000 7000 8000 9000 30% 50%70% 90% PR Pressure drop Pressure dr op (b) Figure 2. Effect of Re and PR on pressure drop for rectangular restriction. Figure 4 represents the velocity contour and velocity vector for rectangular shaped restriction. From the figure, it is noted that the negative velocity zone increases with both Reynolds number and percentage of restriction. This indicates that with the increase in Reynolds number and percentage of restriction, there is more possibility of mass influx into arterial wall leading to higher mass deposition in the artery. Figure 5 shows the velocity contour and velocity vector for half circular shaped re- striction. The nature of flow separation is similar as ob- served in case of rectangular stenotic model. Here the magnitude of recirculating zone at the post stenotic re- gion is less. Therefore from the Figures 4 and 5, it is revealed that the physiological effect of recirculation zone on the dis- ease is less in case of half circular stenotic model. From the figures, it is expected that the magnitude of the mass PR=50% 0 0.5 1 1.5 2 2.5 0100 200300 400 Re Pressure drop Pressure dr op 1.5 Pressure drop (a) Re=100 0 10 20 30 40 50 60 70 80 30% 50%70% 90% PR Pressure drop Pressure dr op (b) Figure 3. Effect of Re and PR on pressure drop for half circular restriction. deposition will increase with the increase either Rey- nolds number or percentage of restriction for both the considered stenotic models. The chance of deposition is expected to be less for half circular stenotic model than that of rectangular one. As per our expectation, we have observed that the magnitude of deposition in the artery wall increases with increase in Reynolds number or percentage of restriction in case of rectangular shaped restriction. This observa- tion has been depicted in Figure 6. The effect of Rey- nolds number and the effect of percentage of restriction on mass deposition have been presented in Figures 6(a) and (b) respectively. The rate of increase in deposition with increase in percentage of restriction is observed to be more than that of increase in deposition rate with in- crease in Reynolds number for the said stenotic model. These results highlight that te effect of percentage of h Copyright © 2013 SciRes. OPEN ACCESS 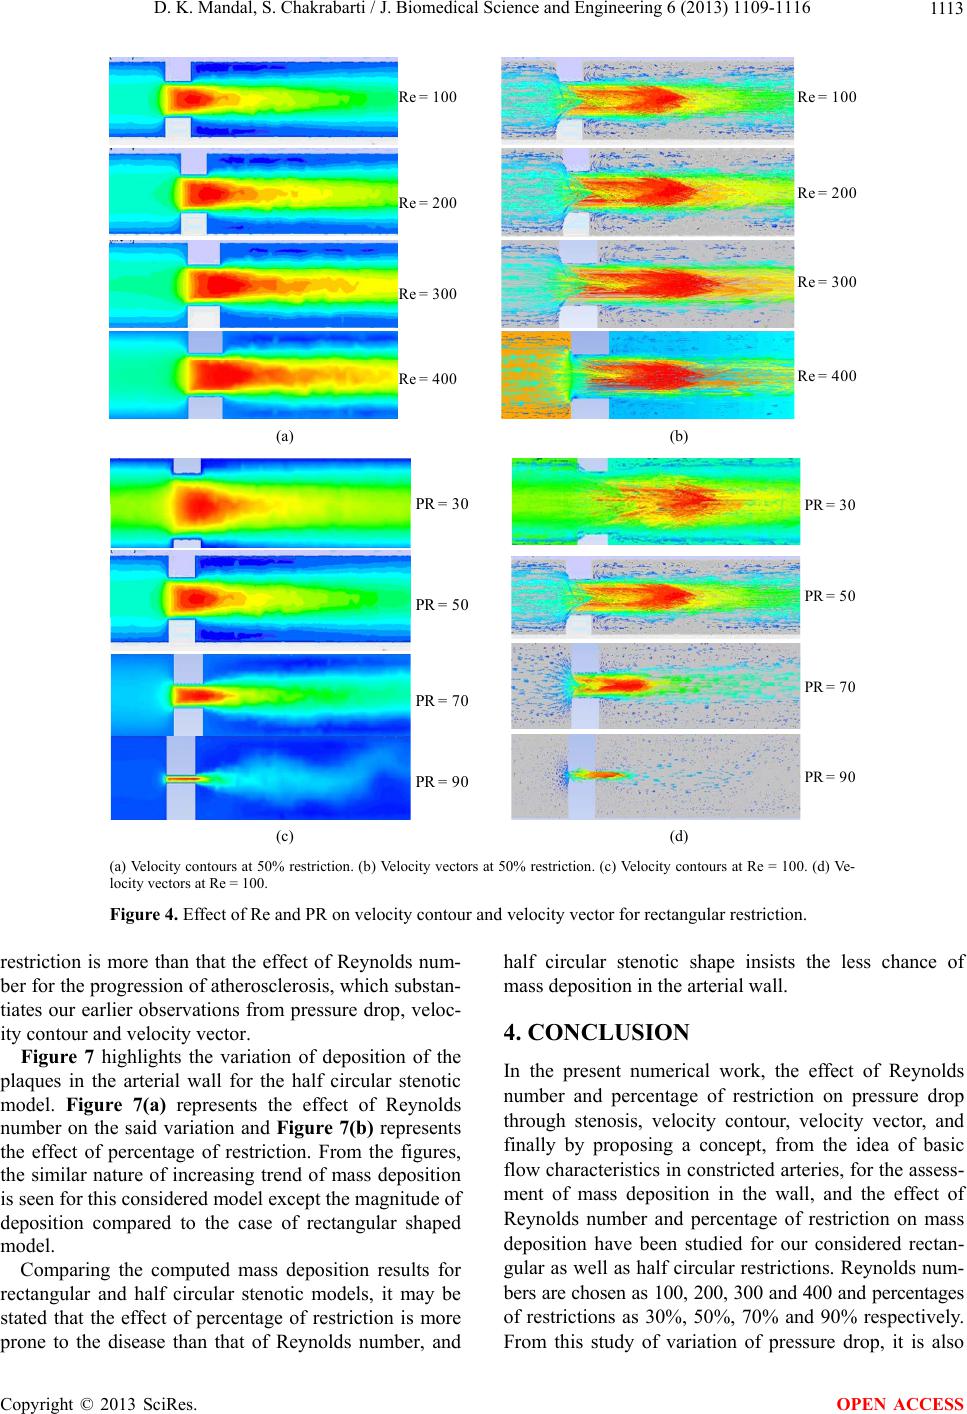 D. K. Mandal, S. Chakrabarti / J. Biomedical Science and Engineering 6 (2013) 1109-1116 Copyright © 2013 SciRes. 111 3 Re = 100 Re = 200 Re = 300 Re = 400 Re = 10 0 Re = 20 0 Re = 30 0 Re = 40 0 (a) (b) PR = 30 PR = 50 PR = 70 PR = 90 PR = 3 0 PR = 5 0 PR = 7 0 PR = 9 0 (c) (d) (a) Velocity contours at 50% restriction. (b) Velocity vectors at 50% restriction. (c) Velocity contours at Re = 100. (d) Ve- locity vectors at Re = 100. Figure 4. Effect of Re and PR on velocity contour and velocity vector for rectangular restriction. restriction is more than that the effect of Reynolds num- ber for the progression of atherosclerosis, which substan- tiates our earlier observations from pressure drop, veloc- ity contour and velocity vector. OPEN ACCESS Figure 7 highlights the variation of deposition of the plaques in the arterial wall for the half circular stenotic model. Figure 7(a) represents the effect of Reynolds number on the said variation and Figure 7(b) represents the effect of percentage of restriction. From the figures, the similar nature of increasing trend of mass deposition is seen for this considered model except the magnitude of deposition compared to the case of rectangular shaped model. Comparing the computed mass deposition results for rectangular and half circular stenotic models, it may be stated that the effect of percentage of restriction is more prone to the disease than that of Reynolds number, and half circular stenotic shape insists the less chance of mass deposition in the arterial wall. 4. CONCLUSION In the present numerical work, the effect of Reynolds number and percentage of restriction on pressure drop through stenosis, velocity contour, velocity vector, and finally by proposing a concept, from the idea of basic flow characteristics in constricted arteries, for the assess- ment of mass deposition in the wall, and the effect of Reynolds number and percentage of restriction on mass deposition have been studied for our considered rectan- gular as well as half circular restrictions. Reynolds num- bers are chosen as 100, 200, 300 and 400 and percentages of restrictions as 30%, 50%, 70% and 90% respectively. From this study of variation of pressure drop, it is also 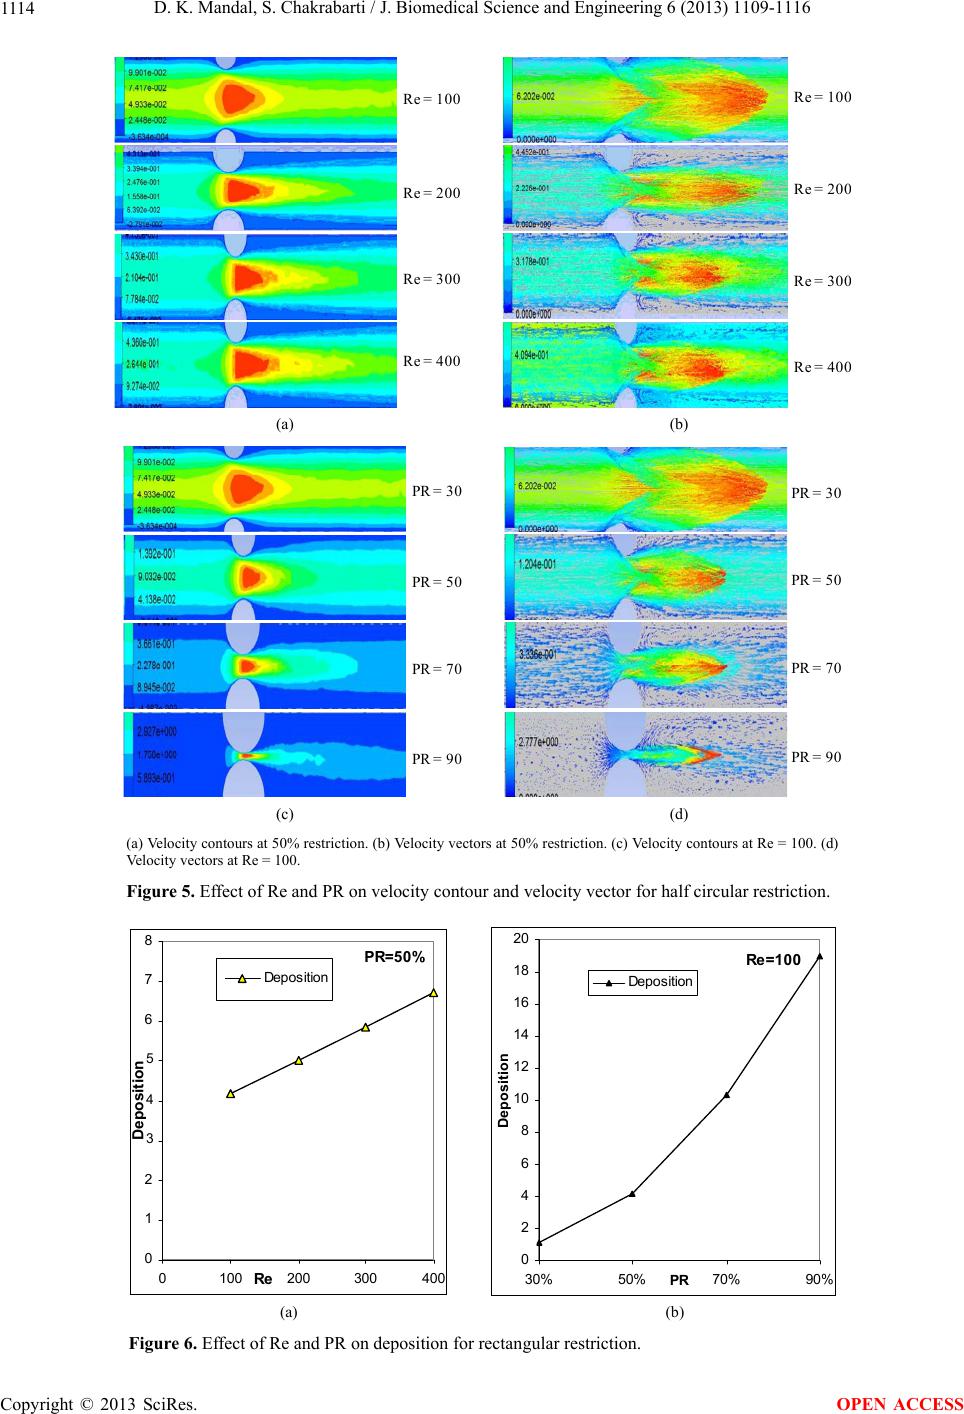 D. K. Mandal, S. Chakrabarti / J. Biomedical Science and Engineering 6 (2013) 1109-1116 1114 Re = 10 0 Re = 20 0 Re = 30 0 Re = 40 0 Re = 10 0 Re = 20 0 Re = 30 0 Re = 40 0 (a) (b) PR = 3 0 PR = 5 0 PR = 7 0 PR = 9 0 PR = 30 PR = 50 PR = 70 PR = 90 (c) (d) (a) Velocity contours at 50% restriction. (b) Velocity vectors at 50% restriction. (c) Velocity contours at Re = 100. (d) Velocity vectors at Re = 100. Figure 5. Effect of Re and PR on velocity contour and velocity vector for half circular restriction. PR=50% 0 1 2 3 4 5 6 7 8 0100 200300 400 Re Deposition Deposition 5 4 3 De p osition Re=100 0 2 4 6 8 10 12 14 16 18 20 30% 50%70% 90% PR Depo sitio n Deposition (a) (b) Figure 6. Effect of Re and PR on deposition for rectangular restriction. Copyright © 2013 SciRes. OPEN ACCESS 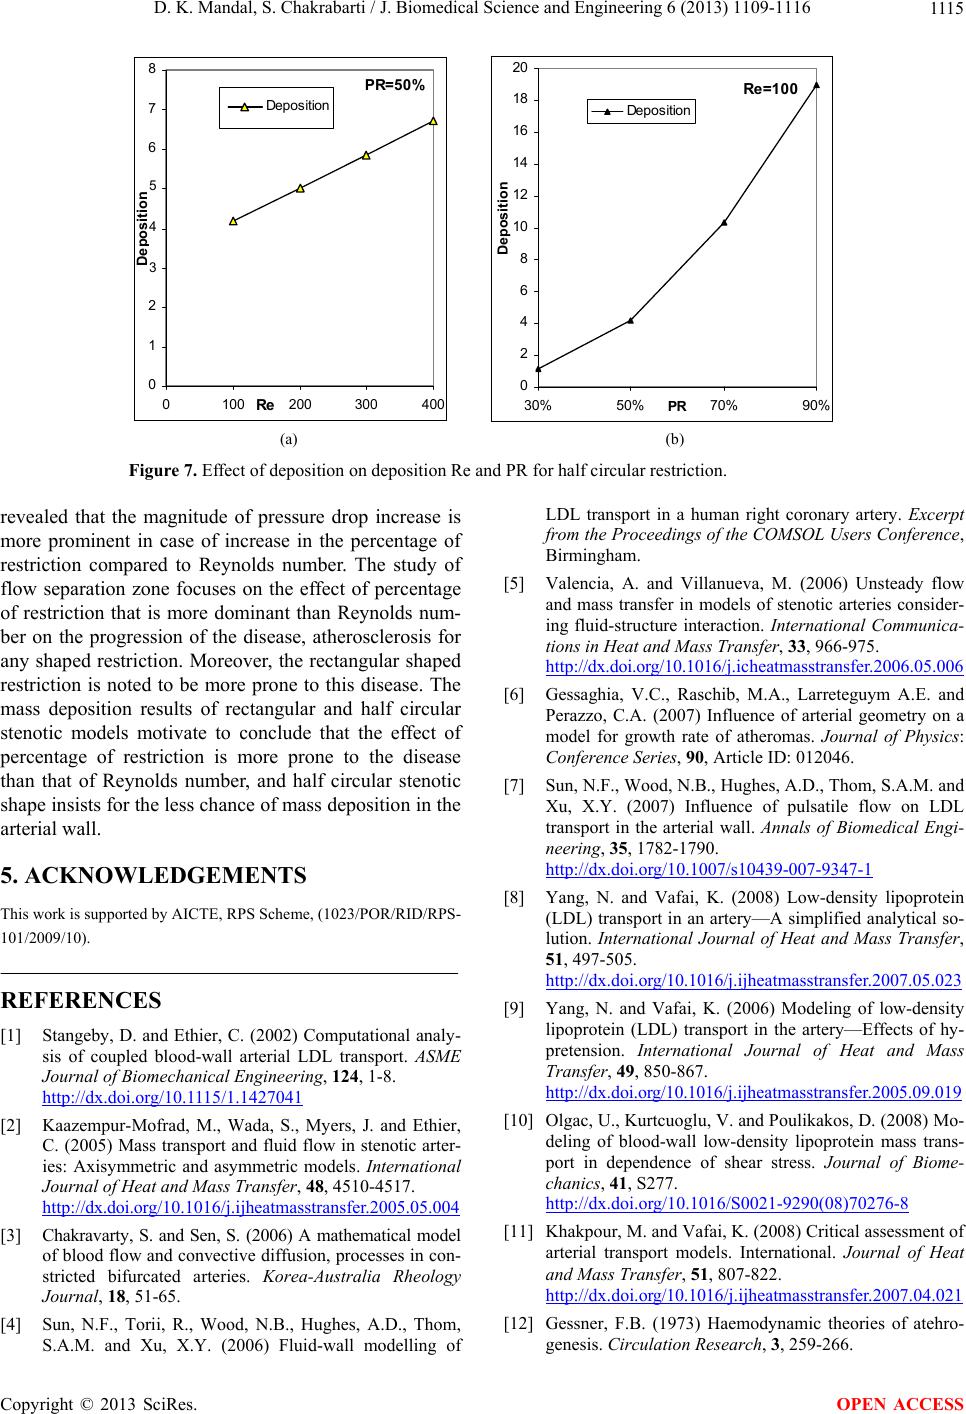 D. K. Mandal, S. Chakrabarti / J. Biomedical Science and Engineering 6 (2013) 1109-1116 1115 PR=50% 0 1 2 3 4 5 6 7 8 0100 200300 400 Re Deposition Deposition 5 4 3 De p osition Re=100 0 2 4 6 8 10 12 14 16 18 20 30% 50%70% 90% PR Depo sit ion Depos ition (a) (b) Figure 7. Effect of deposition on deposition Re and PR for half circular restriction. revealed that the magnitude of pressure drop increase is more prominent in case of increase in the percentage of restriction compared to Reynolds number. The study of flow separation zone focuses on the effect of percentage of restriction that is more dominant than Reynolds num- ber on the progression of the disease, atherosclerosis for any shaped restriction. Moreover, the rectangular shaped restriction is noted to be more prone to this disease. The mass deposition results of rectangular and half circular stenotic models motivate to conclude that the effect of percentage of restriction is more prone to the disease than that of Reynolds number, and half circular stenotic shape insists for the less chance of mass deposition in the arterial wall. 5. ACKNOWLEDGEMENTS This work is supported by AICTE, RPS Scheme, (1023/POR/RID/RPS- 101/2009/10). REFERENCES [1] Stangeby, D. and Ethier, C. (2002) Computational analy- sis of coupled blood-wall arterial LDL transport. ASME Journal of Biomechanical Engineering, 124, 1-8. http://dx.doi.org/10.1115/1.1427041 [2] Kaazempur-Mofrad, M., Wada, S., Myers, J. and Ethier, C. (2005) Mass transport and fluid flow in stenotic arter- ies: Axisymmetric and asymmetric models. International Journal of Heat and Mass Transfer, 48, 4510-4517. http://dx.doi.org/10.1016/j.ijheatmasstransfer.2005.05.004 [3] Chakravarty, S. and Sen, S. (2006) A mathematical model of blood flow and convective diffusion, processes in con- stricted bifurcated arteries. Korea-Australia Rheology Journal, 18, 51-65. [4] Sun, N.F., Torii, R., Wood, N.B., Hughes, A.D., Thom, S.A.M. and Xu, X.Y. (2006) Fluid-wall modelling of LDL transport in a human right coronary artery. Excerpt from the Proceedings of the COMSOL Users Conference, Birmingham. [5] Valencia, A. and Villanueva, M. (2006) Unsteady flow and mass transfer in models of stenotic arteries consider- ing fluid-structure interaction. International Communica- tions in Heat and Mass Transfer, 33, 966-975. htt p ://dx.doi.org/10.1016/ j . i ch e at ma s st r a n sf e r.2006 . 05 . 0 06 [6] Gessaghia, V.C., Raschib, M.A., Larreteguym A.E. and Perazzo, C.A. (2007) Influence of arterial geometry on a model for growth rate of atheromas. Journal of Physics: Conference Series, 90, Article ID: 012046. [7] Sun, N.F., Wood, N.B., Hughes, A.D., Thom, S.A.M. and Xu, X.Y. (2007) Influence of pulsatile flow on LDL transport in the arterial wall. Annals of Biomedical Engi- neering, 35, 1782-1790. http://dx.doi.org/10.1007/s10439-007-9347-1 [8] Yang, N. and Vafai, K. (2008) Low-density lipoprotein (LDL) transport in an artery—A simplified analytical so- lution. International Journal of Heat and Mass Transfer, 51, 497-505. http://dx.doi.org/10.1016/j.ijheatmasstransfer.2007.05.023 [9] Yang, N. and Vafai, K. (2006) Modeling of low-density lipoprotein (LDL) transport in the artery—Effects of hy- pretension. International Journal of Heat and Mass Transfer, 49, 850-867. htt p : // d x . doi.org/10.1016/j . ijheatmasstransfer.2005.09.019 [10] Olgac, U., Kurtcuoglu, V. and Poulikakos, D. (2008) Mo- deling of blood-wall low-density lipoprotein mass trans- port in dependence of shear stress. Journal of Biome- chanics, 41, S277. http://dx.doi.org/10.1016/S0021-9290(08)70276-8 [11] Khakpour, M. and Vafai, K. (2008) Critical assessment of arterial transport models. International. Journal of Heat and Mass Transfer, 51, 807-822. ht tp : / /d x . d oi . org/10.1016/j . i j h ea t ma ss t r a ns f e r.2007 . 0 4. 0 2 1 [12] Gessner, F.B. (1973) Haemodynamic theories of atehro- genesis. Circulation Research, 3, 259-266. Copyright © 2013 SciRes. OPEN ACCESS 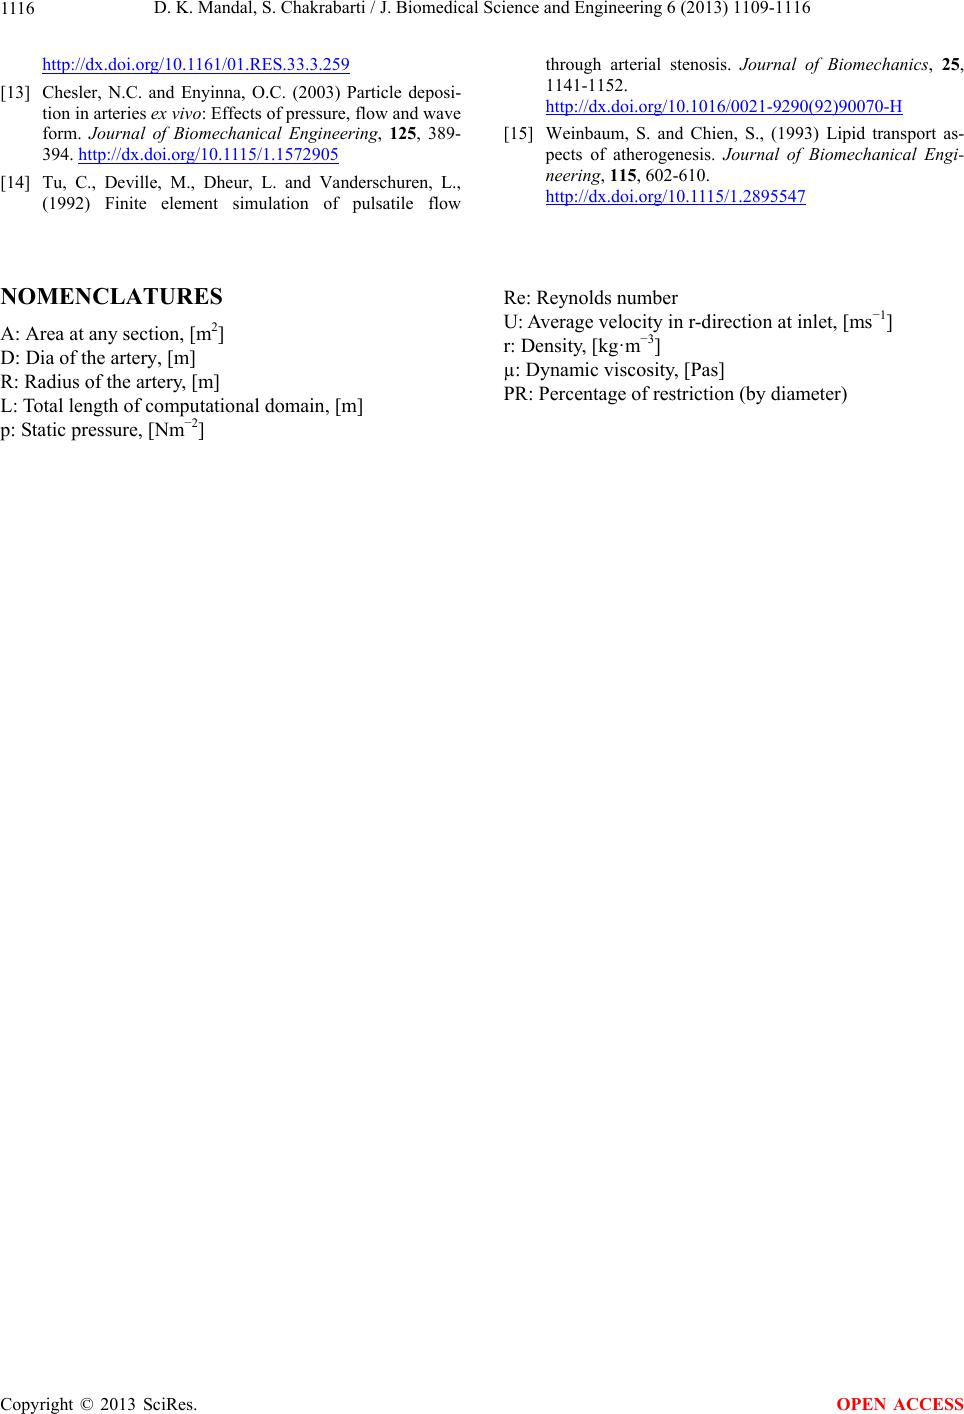 D. K. Mandal, S. Chakrabarti / J. Biomedical Science and Engineering 6 (2013) 1109-1116 1116 http://dx.doi.org/10.1161/01.RES.33.3.259 [13] Chesler, N.C. and Enyinna, O.C. (2003) Particle deposi- tion in arteries ex vivo: Effects of pressure, flow and wave form. Journal of Biomechanical Engineering, 125, 389- 394. http://dx.doi.org/10.1115/1.1572905 [14] Tu, C., Deville, M., Dheur, L. and Vanderschuren, L., (1992) Finite element simulation of pulsatile flow through arterial stenosis. Journal of Biomechanics, 25, 1141-1152. http://dx.doi.org/10.1016/0021-9290(92)90070-H [15] Weinbaum, S. and Chien, S., (1993) Lipid transport as- pects of atherogenesis. Journal of Biomechanical Engi- neering, 115, 602-610. http://dx.doi.org/10.1115/1.2895547 NOMENCLATURES A: Area at any section, [m2] D: Dia of the artery, [m] R: Radius of the artery, [m] L: Total length of computational domain, [m] p: Static pressure, [Nm−2] Re: Reynolds number U: Average velocity in r-direction at inlet, [ms−1] r: Density, [kg·m−3] µ: Dynamic viscosity, [Pas] PR: Percentage of restriction (by diameter) Copyright © 2013 SciRes. OPEN ACCESS |