

Paper Menu >>
Journal Menu >>
 Psychology 2013. Vol.4, No.12, 937-939 Published Online December 2013 in SciRes (http://www.scirp.org/journal/psych) http://dx.doi.org/10.4236/psych.2013.412135 Open Access 937 The Relationship between Locus of Control and the South African National Political Environment Charles H. Van Wi jk Private Practice, Main Road, Simon’s Town, South Africa Email: [email protected] Received September 23rd, 2 013 ; revised October 25th, 2013; accep t e d N o ve mber 27th, 2013 Copyright © 2013 Charles H. Van Wijk. This is an open access article distributed under the Creative Commons Attribution License, which permits unrestricted use, distribution, and reproduction in any medium, provided the original work is properly cited. In accordance of the Creative Commons Attribution License all Copyrights © 2013 are reserved for SCIRP and the owner of the intellectual property Charles H. Van Wijk. All Copyright © 2013 are guarded by law and by SCIRP as a guardian. Locus of control refers to the prediction of how reinforcements change expectancies. An internal locus of control was previously reported to be associated with access to political and economic power in “Apart- heid” South Africa. The democratisation of South Africa gave equal access to political power to all its citizens. This study set out to investigate whether post-apartheid political changes have altered the way a group of technical engineers in the public service perceived their own ability to influence their personal lives and political environment. A total of 297 male participants with a mean age of 30 years, comprising Black, Mixed-race, and White government employees, completed Rotter’s Internality-Externality Scale. This was scored using Ferguson’s (1993) two-factor solution, which comprised of a personal and a politi- cal control factor. The scores of the three race groups were then compared. Results indicated that there were no significant differences between the groups on the total score and scores on the Personal Control factor. All participants believed in an equal internal control over their personal lives. However, Black re- spondents scored more external than the other race groups on the Political Control factor, indicating a perception of lesser influence over political affairs. The results suggest that the effects of the shift in po- litical power have not fully filtered down to ordinary citizens yet. Keywords: Locus of Control; Internality-Externality; Political Environment; Race; Perceptions of Personal and Political Control Introduction The concept of internal vs external control of reinforcement— also referred to as locus of control (LoC)—was developed to predict how reinforcements change expectancies (Rotter, 1975), i.e. if a person perceives that an outcome is contingent upon his own behaviour or his own relatively permanent characteristics, it is termed a belief in internal control. In contrast, if a person believes an outcome is the result of chance, fate, under the con- trol of powerful others, or as unpredictable because of the great complexity of the forces surrounding him, it is labelled a belief in external control. The Internal-External Locus of Control (I-E) Scale (Rotter, 1966) was developed to measure individual differences on this construct. Originally conceived as a unidimensional measure, subsequent factor analytic studies suggested a multidimensional structure. Initial studies (Mirels, 1970) found two factors, the first later labelled as General, or Personal Control, and the sec- ond as Political Control. Other studies indicated the same basic structure, although with some disagreement on the exact item content of each factor (cf. Coombs & Schroeder, 1988; Lange & Tiggeman, 1981, for discussion), and on how many factors need to be extracted (cf. Parkes, 1985, for discussion). The optimal number of interpretable factors appears to be two (Parkes, 1985), and was most often found in subsequent studies (Lefcourt, 1991). There is evidence that the two factors meas- ure largely independent dimensions (cf. Lange & Tiggeman, 1981). Ferguson (1993) provided the most convincing psycho- metric evidence for a specific two-model factor structure (per- sonal and political control) to date, which was used in the pre- sent study. Studies in South Africa (SA) using the I-E Scale found high test-retest reliability (Moosa, Moonsamy, & Fridjhon, 1997). Older SA studies indicated that White respondents scored sig- nificantly more towards internality than Black respondents, and internality across all the racial groups was closely associated with access to political and economic power (Riordan, 1981). In SA, power—the ability of individuals to influence out- comes—was previously ensconced in a social and political system based on race, known as Apartheid. A minority group— White citizens—occupied the dominant political and economic positions, followed, in descending order of access to power and resources, by Coloureds (citizens of mixed race), Asians (citi- zens of Indian decent), and finally Black citizens. Apartheid was replaced with a democratic political order in 1994, al- though its social vestiges can still be found in South African society. The past decade in post-apartheid SA saw monumental changes in the distribution of power within society. This refers to both political power, e.g. the achievement of universal suf- frage and a parliament dominated by Black citizens, and eco- nomic power, e.g. through government policies facilitating 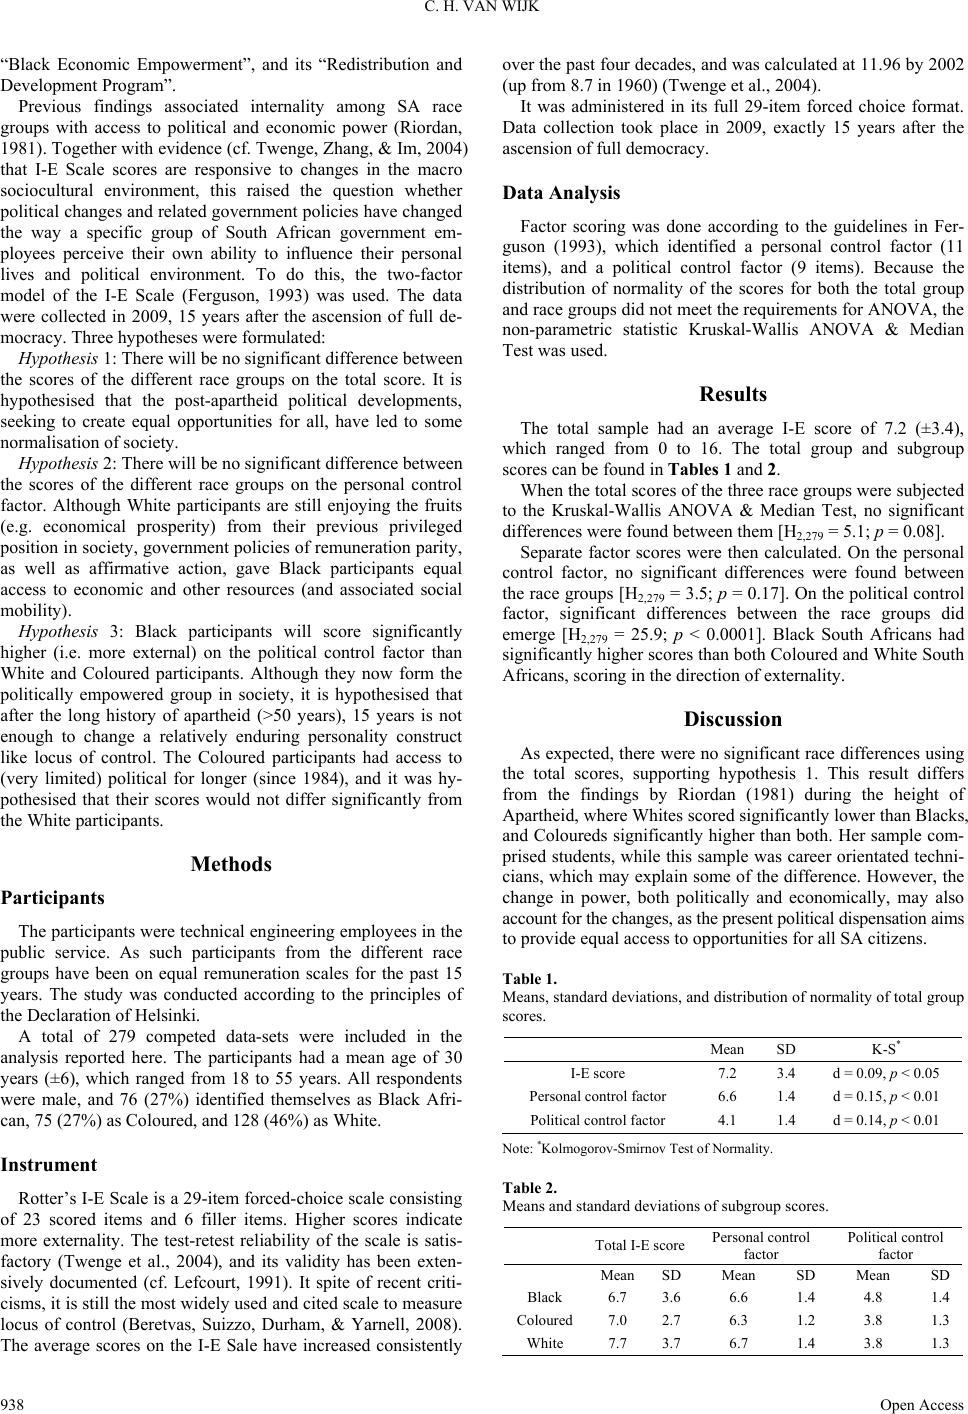 C. H. VAN WIJK “Black Economic Empowerment”, and its “Redistribution and Development Program”. Previous findings associated internality among SA race groups with access to political and economic power (Riordan, 1981). Together with evidence (cf. Twenge, Zhang, & Im, 2004) that I-E Scale scores are responsive to changes in the macro sociocultural environment, this raised the question whether political changes and related government policies have changed the way a specific group of South African government em- ployees perceive their own ability to influence their personal lives and political environment. To do this, the two-factor model of the I-E Scale (Ferguson, 1993) was used. The data were collected in 2009, 15 years after the ascension of full de- mocracy. Three hypotheses were formulated: Hypothesis 1: There will be no significant difference between the scores of the different race groups on the total score. It is hypothesised that the post-apartheid political developments, seeking to create equal opportunities for all, have led to some normalisation of society. Hypothesis 2: There will be no significant difference between the scores of the different race groups on the personal control factor. Although White participants are still enjoying the fruits (e.g. economical prosperity) from their previous privileged position in society, government policies of remuneration parity, as well as affirmative action, gave Black participants equal access to economic and other resources (and associated social mobility). Hypothesis 3: Black participants will score significantly higher (i.e. more external) on the political control factor than White and Coloured participants. Although they now form the politically empowered group in society, it is hypothesised that after the long history of apartheid (>50 years), 15 years is not enough to change a relatively enduring personality construct like locus of control. The Coloured participants had access to (very limited) political for longer (since 1984), and it was hy- pothesised that their scores would not differ significantly from the White participants. Methods Participants The participants were technical engineering employees in the public service. As such participants from the different race groups have been on equal remuneration scales for the past 15 years. The study was conducted according to the principles of the Declaration of Helsinki. A total of 279 competed data-sets were included in the analysis reported here. The participants had a mean age of 30 years (±6), which ranged from 18 to 55 years. All respondents were male, and 76 (27%) identified themselves as Black Afri- can, 75 (27%) as Coloured, and 128 (46%) as White. Instrument Rotter’s I-E Scale is a 29-item forced-choice scale consisting of 23 scored items and 6 filler items. Higher scores indicate more externality. The test-retest reliability of the scale is satis- factory (Twenge et al., 2004), and its validity has been exten- sively documented (cf. Lefcourt, 1991). It spite of recent criti- cisms, it is still the most widely used and cited scale to measure locus of control (Beretvas, Suizzo, Durham, & Yarnell, 2008). The average scores on the I-E Sale have increased consistently over the past four decades, and was calculated at 11.96 by 2002 (up from 8.7 in 1960) (Twenge et al., 2004). It was administered in its full 29-item forced choice format. Data collection took place in 2009, exactly 15 years after the ascension of full democracy. Data Analysis Factor scoring was done according to the guidelines in Fer- guson (1993), which identified a personal control factor (11 items), and a political control factor (9 items). Because the distribution of normality of the scores for both the total group and race groups did not meet the requirements for ANOVA, the non-parametric statistic Kruskal-Wallis ANOVA & Median Test was used. Results The total sample had an average I-E score of 7.2 (±3.4), which ranged from 0 to 16. The total group and subgroup scores can be found in Tables 1 and 2. When the total scores of the three race groups were subjected to the Kruskal-Wallis ANOVA & Median Test, no significant differences were found between them [H2,279 = 5.1; p = 0.08]. Separate factor scores were then calculated. On the personal control factor, no significant differences were found between the race groups [H2,279 = 3.5; p = 0.17]. On the political control factor, significant differences between the race groups did emerge [H2,279 = 25.9; p < 0.0001]. Black South Africans had significantly higher scores than both Coloured and White South Africans, scoring in the direction of externality. Discussion As expected, there were no significant race differences using the total scores, supporting hypothesis 1. This result differs from the findings by Riordan (1981) during the height of Apartheid, where Whites scored significantly lower than Blacks, and Coloureds significantly higher than both. Her sample com- prised students, while this sample was career orientated techni- cians, which may explain some of the difference. However, the change in power, both politically and economically, may also account for the changes, as the present political dispensation aims to provide equal access to opportunities for all SA citizens. Table 1. Means, standard deviations, and distribution of normality of total group scores. Mean SD K-S* I-E score 7.2 3.4 d = 0.09, p < 0.05 Personal c on trol factor 6.6 1.4 d = 0.15, p < 0.01 Political control factor 4.1 1.4 d = 0.14, p < 0.01 Note: *Kolmogorov-Smi rnov Test of Normality. Table 2. Means and standard deviations of subgroup scores. Total I-E scorePersonal control factor Political control factor MeanSDMean SD Mean SD Black 6.7 3.66.6 1.4 4.8 1.4 Coloured7.0 2.76.3 1.2 3.8 1.3 White 7.7 3.76.7 1.4 3.8 1.3 Open Access 938  C. H. VAN WIJK Open Access 939 Hypothesis 2, which did not expect significant differences between the race groups in terms of personal control, was sup- ported. Although they all had access to the same resources (equal salaries, etc.), the similitude of their scores can also be attributed to the context: to be successful in their occupational environment, participants may require a strong belief that their behaviour can positively influence outcomes in their immediate environment, irrespective of race or other background vari- ables. Hypothesis 3, which expected that Black participants would score significantly higher than Coloured and White participants, was also supported. Previous studies indicated that internality across all the racial groups was closely associated with access to political and economic power (Riordan, 1981). It may thus be that the Black participants, after 15 years of democracy, do not yet believe that they can influence political processes (to the same extent that other groups believe they can), even while sharing in the economic benefits of democra- tisation in their personal lives. The support of hypothesis 3 suggests that enduring personal constructs, like LoC, are not unambiguously contingent on political developments. Further, apartheid had been the domi- nant political dispensation for more than 50 years, and 10 years may be too short a time to see such societal changes emerge under a different political environment. Follow up studies in another five or ten years time may shed more light on this in- teraction. On a cautionary note, the present sample scored unusually low, which may reflect the particular context of these partici- pants rather than the national sociopolitical situation. Other SA populations may thus reveal different profiles. Conclusion The findings indicate that changes in South African political power did not yet change the participants’ perceptions of their own influence on their political environment. In particular, Black respondents believed in an internal control over their personal lives equal to White and Coloured respondents, but still perceived themselves to have lesser influence over political affairs. This may suggest that the effects of the change of po- litical power have not yet filtered down to the citizen in the street. This comes in spite of the government’s aggressive agenda for the transformation of the public service in the post-1994 era (e.g. White Paper on Transformation of the Public Service, 1995; White Paper on Affirmative Action in the Public Service, 1998). It seems that more needs to be done to inculcate an un- derstanding that individuals can influence the political devel- opments in their environme n t s . Finally, these findings further suggest the usefulness of the I-E Scale factors in studying locus of control in contexts of disproportionate political and economic power. Acknowledgements The initial results of this study was presented as a poster at the 30th International Congress of Psychology, 22-27 July 2012, Cape Town, South Africa. REFERENCES Beretvas, S. N., Suizzo, M.-A., Durham, J. A., & Yarnell, L. M. (2008). A reliability generalization study of scores on Rotter’s and Nowicki- Strickland’s locus of control scales. Educational and Psychological Measurement, 68, 97-119. http://dx.doi.org/10.1177/0013164407301529 Coombs, W. N., & Schroeder, H. E. (1988). Generalized locus of con- trol: An analysis of factor analytic data. Personality and Individual Differences, 9, 79- 85. http://dx.doi.org/10.1016/0191-8869(88)90032-3 Ferguson, E. (1993). Rotter’s locus of control scale: A ten-item two- factor model. Psychological Reports, 73, 1267-1278. http://dx.doi.org/10.2466/pr0.1993.73.3f.1267 Lange, R. V., & Tiggemann, M. (1981). Dimensionality and reliability of the Rotter I-E locus of control scale. Journal of Personality As- sessment, 45, 398-406. http://dx.doi.org/10.1207/s15327752jpa4504_9 Lefcourt, H. M. (1991). Locus of control. In J. P. Robinson, P. R. Shaver, & L. S. Wrightman (Eds.), Measures of personality and so- cial psychology attitudes (pp. 413-425). London: Academic Press Ltd. http://dx.doi.org/10.1016/B978-0-12-590241-0.50013-7 Mirels, H. L. (1970). Dimensions of internal versus external control. Journal of Consulting and Cli n ic al Psychology, 34, 226-228. http://dx.doi.org/10.1037/h0029005 Moosa, F., Moonsamy, G., & Fridjhon, P. (1997). Identification pat- terns among black students at a predominantly white university. South African Journal of Psychology, 27, 256-260. http://dx.doi.org/10.1177/008124639702700409 Parkes, K. R. (1985). Dimensionality of Rotter’s locus of control scale: An application of the “very simple structure” technique. Personality and Individual Diff erences, 6, 115-119. http://dx.doi.org/10.1016/0191-8869(85)90036-4 Riordan, Z. V. A. (1981). Locus of contr ol in South Africa. The Journal of Social Psychology, 115, 159-168. http://dx.doi.org/10.1080/00224545.1981.9711654 Rotter, J. B. (1966). Generalised expectancies for internal versus exter- nal control of reinforcement. Psychological Monographs, 80, 1-28. http://dx.doi.org/10.1037/h0092976 Rotter, J. B. (1975). Some problems and misconceptions related to the construct of internal versus external control of reinforcement. Jour- nal of Clinical and Consulting Psychology, 43, 56-67. http://dx.doi.org/10.1037/h0076301 Twenge, J. M., Zhang, L., & Im, C. (2004). It’s beyond my control: A cross-temporal meta-analysis of increasing externality in locus of control, 1960-2002. Personality and Social Psychology Review, 8, 308-319. http://dx.doi.org/10.1207/s15327957pspr0803_5 |