

Paper Menu >>
Journal Menu >>
 American Journal of Analytical Chemistry, 2013, 4, 732-738 Published Online December 2013 (http://www.scirp.org/journal/ajac) http://dx.doi.org/10.4236/ajac.2013.412088 Open Access AJAC Coag-Flocculation Kinetics of Mucuna sloanei Seed for Phosphorus Removal from Waste Water Kamoru Akinpelu Babayemi1*, Okechukwu Dominic Onukwuli2, Matthew Chukwudi Menkiti2, Akindele Oyetunde Okewale3 1Department of Chemical Engineering, Anambra State University, Uli, Nigeria 2Department of Chemical Engineering, Nnamdi Azikiwe University, Awka, Nigeria 3Department of Chemical Engineering, Landmark University, Omuaran, Nigeria Email: *[email protected] Received October 2, 2013; revised November 15, 2013; accepted November 25, 2013 Copyright © 2013 Kamoru Akinpelu Babayemi et al. This is an open access article distributed under the Creative Commons Attribu- tion License, which permits unrestricted use, distribution, and reproduction in any medium, provided the original work is properly cited. ABSTRACT Mucuna sloanei (MS) an environmentally friendly biomass was used as a coagulant for treatment of phosphorus con- taining waste water. The study evaluates the coag-flocculation efficiency of MS and its functional kinetic parameter response to varying pH and dosage of the waste water effluent. Coag-flocculation reaction order α, coag-flocculation rate constant K, and coagulation period τ1/2 were determined. The maximum coag-flocculation performance (97.4%) is recorded at rate constant, K of 1.24 × 10⁻⁴ l/mg·min, dosage of 400 mg/l, pH of 8 and coagulation period τ1/2 of 0.100 min while the minimum (61%) is recorded at K of 3 × 10⁻⁵ l/gm·min, dosage 100 mg/l, pH of 2 and τ1/2 of 8.900 mins. The results confirm that MS coagulant is an effective coagulant obeying the theory of fast coagulation in the conditions of the experiments. Keywords: Coag-Flocculation; Mucuna slonaei; Phosphorus 1. Introduction Coagulation is an established process for transforming small particles into larger aggregates (flocs) and for ad- sorbing dissolved organic matter onto particulate aggre- gates so that these impurities can be removed in subse- quent sedimentation and filtration stages [1]. Coag-flocculation of waste water may be accomplished with any of the common water coagulants including lime, iron and aluminum salts and synthetic polymers. However, the search for a better alternative to conven- tional coagulants has become an important challenge in the water treatment process with the aim of minimizing the detrimental effects associated with the use of such coagulants. The use of coagulants of biological origin has become imperative. Some of the coagulants and floccu- lants of biological origin that have been used include Chitosan [2], tannins [3], aqueous extract of the seed of Moringa Oleifera [4], extract of Okra, nirmali seed [5] and Mucuna sloanei which is the subject of the study. Mucuna sloanei are wild plants found in some parts of the semi and sub-Saharan and tropical zones of Africa. The seeds are edible and are used for the thickening of soups in some parts of Nigeria. They possess unique characteristic behavior in hot water displaying different degrees of the viscoelastic properties [6]. The seeds are toasted for easy removal of the hull or par-boiled and then ground to obtain a fine powder or paste, when wet milled. The powder may be used as recipes of some food items and in beverages [7]. Consumption of Mucuna as food has also been reported from Mozambique and Ma- lawi [8]. Mucuna gum is a galactomannan consisting of D-ga- lactose and D-mannose as the main sugars [9]. The en- dosperm was found to constitute 67.15% of the whole seed with about 32.6% as gum. It may also be a rich source of crude protein [10]. The chemical and nutritional evaluation of the raw seed of M. sloanei suggested that this could be a rich source of crude protein after cooking. The galactoxy- loglucan isolated from the cotyledon consists of Glc:Xyl: Gal in a molar ratio of 1:8:1.7:1.0 and a molar mass of 1.6 × 10⁶ g·mol−1 [11]. This work, however, attempts to *Corresponding author.  K. A. BABAYEMI ET AL. 733 explore and generate interest in the utilization of Mucuna sloanei (MS) seed as a coagulant. Coag-flocculation per- formance and kinetic of MS under various pH of the in- dustrial waste effluent are also investigated. 2. Materials and Methods The sample of Mucuna sloanei seed was sourced from a village market, in Ihiala, Anambra State. The seeds were dried, dehulled and ground into fine power after which it was sieved through 0.2 mm sieve. The fraction with par- ticle size less than 0.2 mm was then processed into a co- agulant using standard method [12]. The jar test was conducted based on standard Bench Schale Nehelometric method (single angle procedure) for the examination of water and waste water [13,14] using model WZS-185MC Turbidimeter, Gulenhamp magnetic stirrer and Delta 320 pH meter. The percentage of turbidity removal was calculated using Equation (1) Removal efficiency 0 0 % CC EC 100 (1) where C0 and C are the initial and residual concentration of the waste water effluent respectively. Theoretical Principle The rate of flocculation is a function of the particles (count) concentration C, and the intensity of Brownian motion characterized by the diffusivity D. Consideration of the particle diffusion flux in a mono dispersed system toward a particle of radius “a” (chosen as the central one) on the basis of Fick’s equation yields an expression for the rate of decrease in the particle number. d d cKC t (2) Integrating Equation (1) gives d lnln ln d c K C t (3) From which K and can be determined from a plot of d ln d c t against . ln C In Equation (1), K is coagulation rate constant/colli- sion frequency α: is the order of coagulation reaction C: is the concentration of the particles (TSS) It has been shown by some researchers that for the conditions described above [15]. 8πKR D (4) where 2Ra From Einstein’s equation [16] B D KTB (5) where B is the friction factor, T is the absolute tempera- ture (0K) and KB is the Boltzman constant (Molar gas constant per particle). For the simplest case of a smooth spherical particle of radius “a” immersed in a fluid of viscosity µ, B is given by Stoke’s relation. 6π B a (6) Putting Equation (6) into Equation (5) gives 6π B K T Da (7) But 2Ra Therefore 2 6π3π BB K TKT DRR (8) Putting Equation (8) into Equation (4) gives 8 8π 3π3 B KT KT KR R B (9) Putting Equation (9) into Equation (2) when 2 yields 2 d8 d3 B KT cC t (10) Applying the method of separable variable and inte- grating Equation (2) within the following limits: At t = 0, C = c0 at t = t, C = C, yields 2 dd d cKt c (11) Integrating Equation (11) above yields 0 11 K t cc (12) Multiply both sides of Equation (12) by C0 to give 0 0 1 CCKt C (13) Making “C” the subject of the formular, yields 00 0 0 111 CC CCKt t CK (14) Let 0 1CK (15) Therefore Equation (14) becomes 0 1 C Ct (16) When t then Equation (16) becomes Open Access AJAC  K. A. BABAYEMI ET AL. 734 0 11 2 CC C 0 (17) Thus at 0 ,2 C tC . This quantity is called the co- agulation period, which is the time during which the ini- tial concentration of particles is halved. For Brownian coagulation of mono dispersed particles at early stage (t ≤ 30 minutes), the time evolution of the cluster-size dis- tribution for colloidal particle is usually described thus: 11 d1,, d2 n ij in jn i Cijcc incc t (18) where d d n C t is the rate of change of concentration of particle of size n (concentration/time). β is a function of the coag-flocculation transport mecha- nism. The appropriate value of β for Brownian transport is given by [15]. 8 3 B BR P K T (19) where KB is Boltzman’s constant (J/K) T is Absolute temperature (K) For Brownian aggregation at early stages (t ≤ 30 min- utes) Equation (18) can be solved exactly, resulting in the expression [16]. 1 0 1 0 0 1 2 11 2 n nt n t CKC C t KC (20) Recall from Equation (15) 0 1 CK , Putting Equa- tion (15) in Equation (20) We have 1 1 0 2 12 n nt n t C Ct (21) Let 2 and put in Equation (21) 1 1 01 n nt n Ct Ct (22) Equation (22) gives general expression for particle of n-th order. Hence for primary particles (n = 1) 10 2 1 1 CC t (23) For twins (n = 2) 20 3 1 t CC t (24) For triplets (n = 3) 2 30 4 1 t CC t (25) The process of aggregation is a complicated phe- nomenon. Analysis shows that Equation (16) holds for the overall concentration of all particles, which mono- tonically decreases in time like the number of primary particles: 0 1 i C Ct (26) Linearising Equation (26) gives 00 111 i t CC C (27) where a plot of 1 i C versus t gives Slope = 0 1 C , Intercept = 0 1 C Now that can be obtained from slope of Equation (27) while the theoretical quantities is found with the aid of Equation (15) [16]. 00 13 8B CK KTC (28) As 0 01 , 2 C Ct 2 Therefore, 12 00 33 80.5 4 BB tKT CKTC (29) where 12 t is coagulation period/half life. In the work of [16] it was shown that the coagulation rate constant could be determined by monitoring the chan- ges in the turbidity of the coagulation liquid with time. The particle concentration during early stages of co- agulation can be determined directly, by visual particle counting or indirectly from turbidity measurement [17]. 3. Results and Discussion Figures 1-5 show the effect of coagulant dosage on the turbidity removal at various pH. It can be seen from the figure that turbidity removal increases with increase in coagulant dosage. Figures 1-4 show the removal effi- ciency as function of time for various MS coagulant dosages at pH of 2, 4, 6 and 8 respectively. It can be seen from the figure that the removal efficiency increases very fast within the first ten minutes for a particular dosage after which a decrease in efficiency began to set in. The figures also show that the removal efficiency of MS co- Open Access AJAC 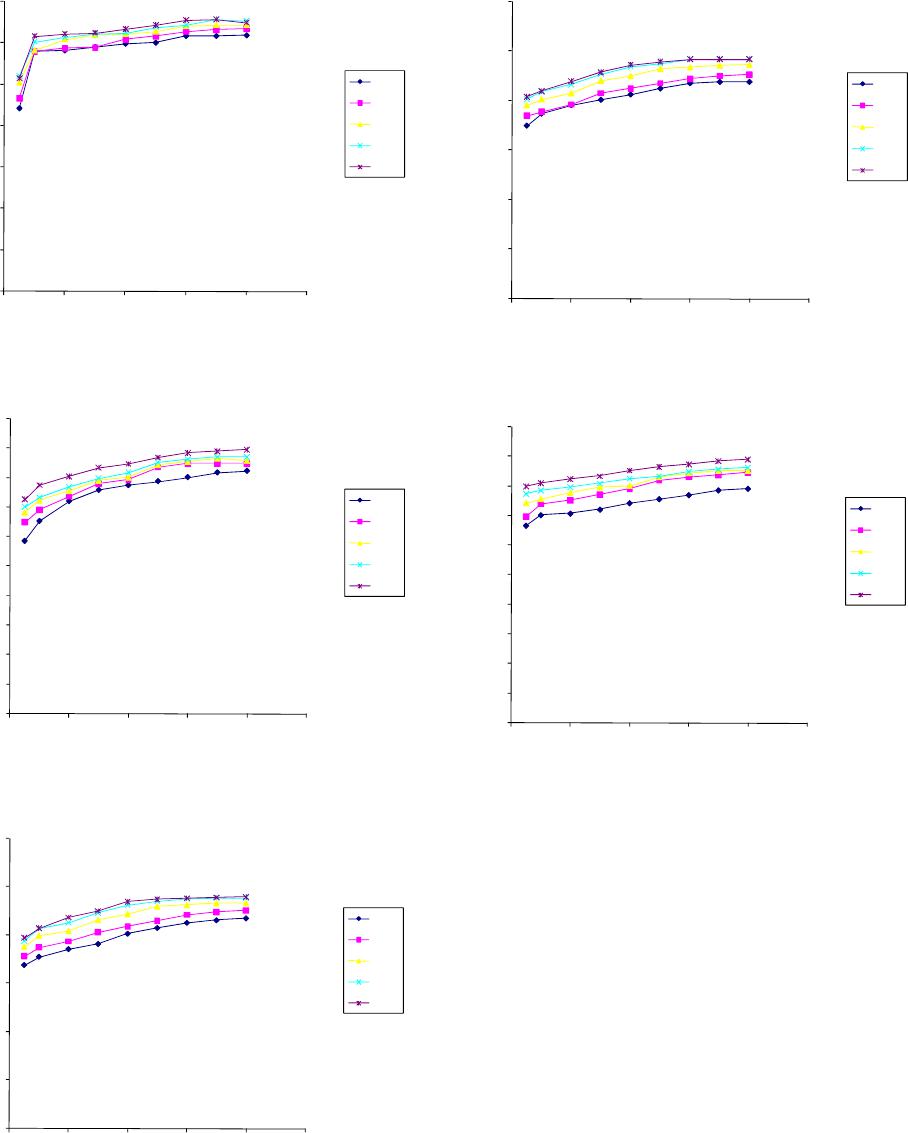 K. A. BABAYEMI ET AL. 735 0 10 20 30 40 50 60 70 0 20406080100 E% t, mi n 100mg/l 200mg/l 300mg/l 400mg/l 500mg/l Figure 1. Coagulation efficiency profile for varying MS dosage at pH = 2. 0 10 20 30 40 50 60 70 80 90 100 0 20406080100 E% t, m in 100mg/l 200mg/l 300mg/l 400mg/l 500mg/l Figure 2. Coagulation efficiency profile for varying MS dosage at pH = 4. 0 20 40 60 80 100 120 0 20406080100 E% t, m in 100mg/l 200mg/l 300mg/l 400mg/l 500mg/l Figure 3. Coagulation efficiency profile for varying MS agulant increases with dosage. However, in Figure 5, it dosage at pH = 6. was observed that as pH was increased further to 10, the 0 20 40 60 80 100 120 0 20406080100 E% t, m in 100mg/l 200mg/l 300mg/l 400mg/l 500mg/l Figure 4. Coagulation efficiency profile for varying MS dosage at pH = 8. 0 10 20 30 40 50 60 70 80 90 100 0 20406080100 E% t, m in 100mg/l 200mg/l 300mg/l 400mg/l 500mg/l Figure 5. Coagulation efficiency profile for varying varyin rate of removal began to decrease. It could be deduced occulation parameters at various do 9000 with the ex g MS dosage at pH = 10. from the above observation that the optimum turbidity removal of MS coagulant occurred at the optimum pH of 8 and 400 mg/l dosage. The values of coag-fl sages and pH are presented in Tables 1 to 5 above. The R2 and coag-flocculation rate constant K contained in the various tables were determined from plots 1/ct versus time as shown in Figures 6 to 10. The values of, R2, being greater than 0. ception of the results at pH of 2, are satisfactory and this confirms the theory of perikinetic as the controlling mechanism of coag-flocculation under study [18]. The- highest value of K is recorded for 400 mg/l at pH of 8 while the least value is recorded for K at pH of 2 as pre- sented in Table 4. The corresponding value of τ1/2 is 0.100 min at pH of 8 and 400 mg/l dosage. For pH of 2, and 400 mg/l dosage, τ1/2 is 8.900 mins. This indicates that the best coagulation performance could be achieved Open Access AJAC  K. A. BABAYEMI ET AL. Open Access AJAC 736 MS at varying pH and 100 mg/l dosage. Parameters pH = 10 Table 1. Coagulation kinetic parameters of pH = 2 pH = 4 pH = 6 pH = 8 γ α R2 K (l/ 1 5. 8.60 × 1025 1. 1. 4.45 × 1025 1 1. 3.31 × 1025 1 2. 2.89 × 1025 5.18 × 10 mg·min) βBR (l/mg·min) εp (l/mg) τ1/2 (min) C0 (mg/l) (Np)0 .0 × 10−3 2.0000 0.5870 3 × 10⁻⁵ 6 × 10⁻⁵ 40 × 1012 8.900 373 0 × 10−3 2.0000 0.9540 2 × 10⁻⁴ 2.4 × 10⁻⁴ 2.18 × 10¹³ 2.200 373 .0 × 10−3 2.0000 0.9794 8 × 10⁻⁴ 3.6 × 10⁻⁴ 3.30 × 10¹³ 1.400 373 .0 × 10−3 2.0000 0.9840 0 × 10−4 4.0 × 10⁻⁴ 3.60 × 10¹³ 1.300 373 1.0 × 10⁻³ 2.0000 0.9713 6 × 10⁻⁵ 1.2 × 10⁻⁶ 1.10 × 10¹³ 4.400 373 25 Table 2. Coagulation kinetic parameters MS at varying pH and 200 mg/l dosage. Parameters pH = 10 of pH = 2 pH = 4 pH = 6 pH = 8 γ α R2 K (l/ 1 8.37 × 10 1 1 3.37 × 10 1. 2. 2.59 × 1025 1. 2. 2.47 × 1025 1. 3.79 × 1025 mg·min) βBR (l/mg·min) εp (l/mg) τ1/2 (min) C0 (mg/l) (Np)0 .0 × 10−3 2.0000 0.7070 3 × 10⁻⁵ 6 × 10⁻⁵ 5.4 × 10¹² 8.900 373 25 .0 × 10−3 2.0000 0.9836 .8 × 10−4 3.6 × 10⁻⁴ 3.30 × 10¹³ 1.400 373 25 0 × 10−3 2.0000 0.9749 4 × 10⁻⁴ 4.8 × 10⁻⁴ 4.40 × 10¹³ 1.100 373 0 × 10−3 2.0000 0.9854 6 × 10⁻⁴ 5.2 × 10⁻⁴ 4.70 × 10¹³ 1.000 373 1.0 × 10⁻³ 2.0000 0.9742 2 × 10⁻⁴ 2.4 × 10⁻⁴ 2.20 × 10¹³ 2.200 373 Table 3. Coagulation kinetic parameters MS at varying pH and 300 mg/l dosage. Parameters pH = 10 of pH = 2 pH = 4 pH = 6 pH = 8 γ α R2 K (l/ 1 8.06 × 1025 1. 1. 3.25 × 1025 1 4. 1.68 × 1025 1 5. 1.44 × 1025 1. 3.49 × 10 mg·min) βBR (l/mg·min) εp (l/mg) τ1/2 (min) C0 (mg/l) (Np)0 .0 × 10−3 2.0000 0.7420 3 × 10⁻⁵ 6 × 10⁻⁵ 5.4 × 10¹² 8.900 373 0 × 10−3 2.0000 0.9738 8 × 10⁻⁴ 3.6 × 10⁻⁴ 3.30 × 10¹³ 1.400 373 .0 × 10−3 2.0000 0.9616 7 × 10⁻⁴ 9.4 × 10⁻⁴ 8.54 × 10¹³ 0.500 373 .0 × 10−3 2.0000 0.9610 6 × 10⁻⁴ 1.1 × 10⁻⁵ 1.01 × 10¹⁴ 0.400 373 1.0 × 10⁻³ 2.0000 0.9696 2 × 10⁻⁴ 2.4 × 10⁻⁴ 2.18 × 10¹³ 2.200 373 25 Table 4. Coagulation kinetic parameters MS at varying pH and 400 mg/l dosage. Parameters pH = 10 of pH = 2 pH = 4 pH = 6 pH = 8 γ α R2 K (l/ 1. 8.00 × 1025 1. 1. 3.07 × 1025 1. 7. 1.08 × 1025 1 1. 4 7.22 × 1024 3.37 × 1025 mg·min) βBR (l/mg·min) εp (l/mg) τ1/2 (min) C0 (mg/l) (Np)0 0 × 10−3 2.0000 0.6830 3 × 10⁻⁵ 6 × 10⁻⁵ 5.4 × 10¹² 8.900 373 0 × 10−3 2.0000 0.9844 9 × 10⁻⁴ 3.8 × 10⁻⁴ 3.45 × 10¹³ 1.400 373 0 × 10−3 2.0000 0.9703 9 × 10⁻⁴ 1.58 × 10⁻⁵ 1.44 × 10¹⁴ 0.300 373 .0 × 10−3 2.0000 0.9576 24 × 10− 2.48 × 10⁻⁵ 2.25 × 10¹⁴ 0.100 373 1.0 × 10⁻³ 2.0000 0.9850 1 × 10⁻⁴ 2.0 × 10⁻⁴ 1.81 × 10¹³ 2.600 373 Table 5. Coagulation kinetic parameters MS at varying pH and 500 mg/l dosage. Parameters pH = 10 of pH = 2 pH = 4 pH = 6 pH = 8 γ α R2 K (l/mg·min) βBR (l/mg·min) εp (l/mg) τ1/2 (min) C0 (mg/l) (Np)0 1. 2.0000 0.6830 3 × 10⁻⁵ 6 × 10⁻⁵ 5.4 × 10¹² 8.900 373 7.76 × 1025 1. 2.0000 0.9840 2.3 × 10⁻⁴ 4.6 × 10⁻⁴ 4.18 × 10¹³ 1.100 373 2.59 × 1025 1 2.0000 0.9749 8.9 × 10⁻⁴ 17.8 × 10⁻⁴ 1.61 × 10¹⁴ 0.300 373 1.02 × 1025 1 2.0000 0.2764 4.1 × 10⁻⁴ 8.2 × 10⁻⁴ 7.45 × 10¹³ 0.600 373 7.22 × 1024 2.0000 0.9882 1.5 × 10⁻⁴ 3.0 × 10⁻⁴ 2.72 × 10¹³ 1.700 373 2.83 × 1025 0 × 10−3 0 × 10−3 .0 × 10−3 .0 × 10−3 1.0 × 10⁻³ 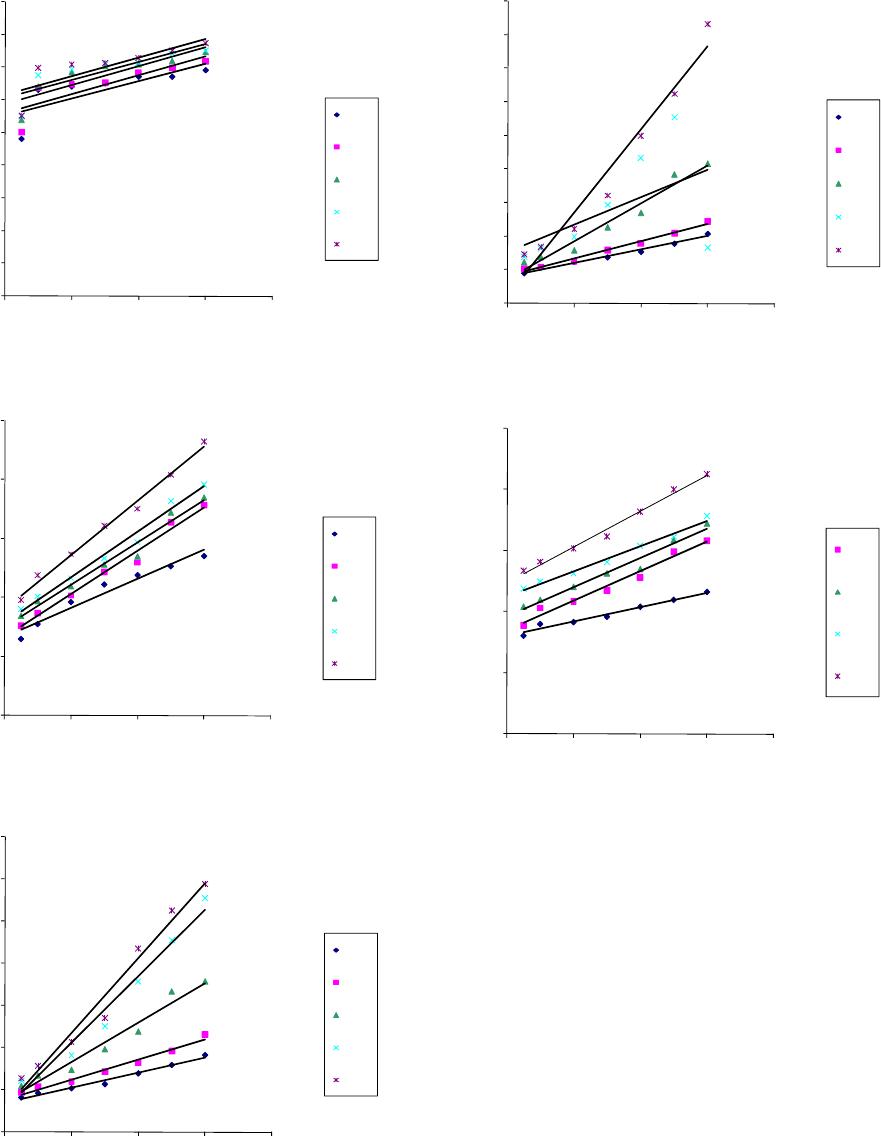 K. A. BABAYEMI ET AL. 737 y = 3E-05x + 0.005 0.587R² = y = 3E-05x + 0. R² = y = 3E-05x + 0.005 R² = 0.742 y = 3E-05x + 0.006 R² = 0.683 y = 3E-05x + 0.006 R² = 0.656 0.00E+00 1.00E-03 2.00E-03 3.00E-03 4.00E- 5.00 6.00 7. 8.00E-03 9.00E-03 020406080 C t , l/mg t, mi n 005 0.707 03 E-03 E-03 00E-03 1/ 100mg/l 200mg/l 300mg/l 400mg/l 500mg/l Figure 6. Kinetic plot of 1/Ct versus time for MS dosage at pH = 2. y = 0.00012x + 0.00663 R² = 0.95395 y = 0.00018x + 0.00661 1.50E-02 1/C t , l/mg R² = 0.98357 y = 0.00018x + 0.00750 R² = 0.97381 y = 0.00019x + 0.00787 R² = 0.98441 y = 0.00023x + 0.00903 R² = 0.99126 0.00E+00 5.00E-03 1.00E-02 2.00E-02 2.50E-02 0 20406080 t, m in 100mg/l 200mg/l 300mg/l 400mg/l 500mg/l Figure 7. Kinetic plot of 1/Ct versus time for varying MS dosage at pH = 4. y = 0.00018x + 0.00706 R² = 0.97935 y = 0.00024x + 0.00767 4.00E-02 1/C t , l/mg y = 0.00020x R² = 0.974 94 y = 0.00047x + 0.00721 R² = 0.96167 y = 0.00079x + 0.00542 R² = 0.97028 y = 0.00089x + 0.00574 R² = 0.97486 0.00E+00 1.00E-02 2.00E-02 3.00E-02 5.00E-02 6.00E-02 7.00E-02 0 20406080 t, mi n 100mg/l 200mg/l 300mg/l 400mg/l 500mg/l Figure 8. Kinetic plot of 1/Ct versus time for varying MS dosage at pH = 6. of MS coagulant at K = 1.24 × 10⁻³ (mg·min)−1 and τ1/2 = 0.100 mins. + 0.00808 8397R² = 0.9 y = 0.00026x R² = y = 0.00056x + 0.00725 R² = 0.96106 y = 0.00041x + 0.01534 R² = 0.27636 y = 0.00124x + 0.00228 R² = 0.95768 0.00E+00 1.00E-02 2.00E-02 3.00E-02 5.0 8. 0 20406080 1/C t , l/mg t, m in + 0.98535 0.00826 4.00E-02 0E-02 6.00E-02 7.00E-02 00E-02 9.00E-02 100mg/l 200mg/l 300mg/l 400mg/l 500mg/l Figure 9. Kinetic plot of 1 C t versus time for varying MS dosage at pH = 8. y = 0.00006x + 0.00801 R² = 0.97133 1.50E-02 t , l/mg y = 0.00012x + 0.00848 R² = 0.97417 y = 0.00010x + 0.01125 R² = 0.98499 y = 0.00015x + 0.01238 R² = 0.98821 0.00E+00 5.00E-03 2.00E-02 2.50E-02 0 20406080 C t, mi n y = 0.00012x + 0.00963 R² = 0.96961 1.00E-02 1/ 200mg/l 300 g/lm 400mg/l 500mg/l Figure 10. Kinetic plot of 1/Ct versus time for varying MS dosage at pH = 10. At nearly invariant values of K, εp relates directly to 2K = βBR. The consequence is that high εp results in high kinetic energy to overcome the zeta potential. The impli- cation is that the double layer is either reduced or the colloids destabilized to actualize low τ1/2 in favour of high rate of coagulation [18]. re obtai previous researches [19]. 4. Conclusion The removal efficiency E > 80% recorded at the opti- mum pH of 8 and dosage of 400 mg/l supported by the value of τ1/2 = 0.100 minute presents the potential of Mucuna sloanei as a source of organic derived coagulant applicable in large scale water treatment. The obtained results are in agreement with previous works [19]. The results show that high values of τ1/2 correspond to low εp and K, an indication of repulsion in the system. Similar results wened by Open Access AJAC  K. A. BABAYEMI ET AL. 738 REFERENCES [1] J.-Q. Jiang and N. J. D. Graham, “Observations of the Comparative Hydrolysis/Precipitation Behavior of Ferric Sulphate and Ferric Sulphate,” Water Research Vol. 32, 1998, pp. 930-935. [2] Ozacar and A. Sengli, “Effectiveness of Tannins Ob- tained from Velunia as a Coagulant Aid for Dewatering of Sludge,” Water Research, Vol. 34, No. 4, 2002, pp. 1407-1412. [3] A. Ndabigengesere and K. S. Narasiah, “Quality of Water Treated by Coagulation Using Moringa Oleifera Seeds,” Water Research, Vol. 32, No. 3, 1998, pp. 781-791. http://dx.doi.org/10.1016/S0043-1354(97)00295-9 Poly , [4] M. A. Oladoja and Y. D. Ahu, “Evaluation of Plantain Peelings Ash Extract as Coagulant of Colloidal Particle in Low pH Aqua System,” Water Quality Research Journal ts, A. Domard and K. M. Varum, Interna- ood Science, Vol. 5, No. 13, of Canada, Vol. 43, No. 2-3, 2008, p. 231. [5] G. A. F. Rober tional Conference on Chitin and Chitosan and 2nd Inter- national Conference of the European Chitin Society, Jacques Publisher, Lyon, 1998. [6] A. Uzomah and O. S. Odusanya, “Mucuna sloanei, De- tarium Micro Carpum and Brachstegia Eurycoma Seeds: A Preliminary Study of Their Starch-Hydrocolloicds Sys- tem,” African Journal of F 2011, pp. 733-740. http://dx.doi.org/10.5897/AJFS11.088 [7] Wanjekeche, et al., “Effect of Germination, Alkaline and Acid Soaking and Boiling on the Nutritional Value of Mature and Immature Mucuna Beam,” Tropical and Sub- tropical Agroecosystems, Vol. 1, 2003, pp. 183-192. et al., “Outbreak of Acute Psychosis At- una Pruriens,” Lancet, Vol. 336, No. 8723 [8] M. E. Infante, tributed to Muc, 1990, p. 1129. http://dx.doi.org/10.1016/0140-6736(90)92603-F [9] M. Strivastava and V. P. Kapoor, “Seed Galactomannans: An Overview,” Chemistry & Biodiversity, Vol. 2, No. 3, 2005, pp. 295-317. http://dx.doi.org/10.1002/cbdv.200590013 [10] L. M. Nwokoms, “Isolatiocha and P. A. Willia haracterization of Mucu n and Seed Rheological Cna Flagellipes yd.2008.08.014 Gum,” Food Hydrocolloids, Vol. 23, No. 5, 2009, pp. 1394-1397. http://dx.doi.org/10.1016/j.foodh [11] S. A. Teixeira, et al., “Isolation of a Lectin and a Galac- toxyloglucan from Mucuna sloanei Seeds,” Phytochem- istry, Vol. 70, No. 17-18, 2009, pp. 1965-1972. http://dx.doi.org/10.1016/j.phytochem.2009.08.011 [12] Fernandez-Kin, “Physio Chemical and Functional Proper- ties of Craw Fish Chitosan as Affected by Different Proc- essing Protocols,” M.Sc. Thesis, Louisiana State Univer- sity and Agricultural and Mechanical College, USA, 2004. [13] Water Specialist Technology (WST), “About Coagulation and Flocculation,” Information Bulletins, USA, 2003, pp. 1-10. [14] AWWA, “Standard Methods for the Examination of Wa- ider Lougsun- Vol. 92, 1917, 1996, p. ter and Waste Water Effluent,” New York, 2005. [15] M. Von Smoluchowski, “Versuchener Mathematischen Theorie der Koagulations Kinetic Kollo gen,” Zeitschrift für Physikalische Chemie, pp. 129-168. [16] H. Holthof, et al., “Coagulation Rate Measurement of Colloidal Particles by Simultaneous Static and Dynamic Light Scattering,” Langmuir, Vol. 12, No. 23, 5541. http://dx.doi.org/10.1021/la960326e [17] H. A. Nicholls, “Ortho Kinetic Flocculation of Phosphate Precipitates in a Multi Compartment Reactor with Mon- Ideal Flow,” Programme of Water Technology, Pergamon Press, 1999, pp. 61-88. [18] M. C. Menkiti, “Sequential Treatment of Coal Washery Effluents by Bio Coag-Flocculation and Activated Car- bon Adsorption,” Ph.D Thesis, Nnamdi Azikiwe Univer- sity, Nigeria, 2010. [19] M. C. Menkiti and O. D. Onukwuli, “Coag-Flocculation Studies of Afzella Bella Coagulant (ABC) in Coal Efflu- ent Using Single and Simulated Multi Angle Nephelome- try,” Journal of Minerals and Materials Characterization factor for Brownian transport and Engineering, Vol. 10, No. 3, 2011, pp. 279-298. Nomenclatures βBR: Collision εp: Collision efficiency τ1/2: Coagulation period/Half life R2: Coefficient of Determination α: Coag-flocculation reaction order MS: Mucuna sloanei K: Coagulation rate constant C: Concentration of particles Open Access AJAC |