

Paper Menu >>
Journal Menu >>
 American Journal of Analytical Chemistry, 2013, 4, 715-724 Published Online December 2013 (http://www.scirp.org/journal/ajac) http://dx.doi.org/10.4236/ajac.2013.412086 Open Access AJAC New Stability Indicating Method for Quantification of Impurities in Amlodipine and Benazepril Capsules by Validated HPLC Rama Joga Venkata Eranki1,2*, Gopichand Inti1, Venkatasubramanian Jayaraman1, Raghuram Pannala3, Sudhakar Rao Vidiyala1, Jadi Sree Ramulu2 1Quality & Analytical Development Department, InvaGen Pharmaceuticals, Inc., Hauppauge, USA 2Department of Chemistry, Sri Krishnadevaraya University, Anantapur, India 3Quality Assurance Department, ScieGen Pharmaceuticals, Inc., Hauppauge, USA Email: *[email protected] Received October 21, 2013; revised November 25, 2013; accepted December 1, 2013 Copyright © 2013 Rama Joga Venkata Eranki et al. This is an open access article distributed under the Creative Commons Attribu- tion License, which permits unrestricted use, distribution, and reproduction in any medium, provided the original work is properly cited. ABSTRACT A stability indicating LC method was developed for the simultaneous determination of Amlodipine and Benazepril capsules in pharmaceutical dosage form. Efficient chromatographic separation was achieved on Symmetry C18 station- ary phase with simple combination of amobile phase containing 750 mL of DI Water, 250 mL of Acetonitrile and 2 mL of Octylamine into suitable container with adjusted pH to 2.50 ± 0.05 with the aid of Ortho phosphoric acid delivered in an isocratic mode and quantification was carried out using UV detection at 240 nm at a flow rate of 1.0 mL·min−1 with an injection volume of 20 μl and ambient column temperature. This method is capable to detect both the drug compo- nents of Amlodipine and Benazepril in presence of their degradation products (Amlodipine Imp-A and Benazepril Im- purity-C) with a detection level of 0.05%. Amlodipine/Benazepril in their combination drug product were exposed to thermal, photolytic, hydrolytic and oxidative stress conditions, and the samples were analysed. Peak homogeneity data of Amlodipine and Benazeprilis were obtained using PDA detector, in the stressed sample chromatograms, demonstrat- ing the specificity. The method shows excellent linearity over a range of 0.05% - 2.0% for Amlodipine, Amlodipine Impurity-A and 0.05% - 5.0% for Benazepril and Benazepril Impurity-C. The correlation coefficient for Amlodipine and Benazepril is 1. The relative standard deviation was always less than 2%. The proposed method was found to be suitable and accurate for quantitative determination and the stability study of Amlodipine and Benazepril in pharmaceu- tical preparations. The developed HPLC method was validated with respect to linearity & range, accuracy, precision and robustness. Keywords: Column Liquid Chromatography; Method Validation; Stability Indicating Study Amlodipine and Benazepril 1. Introduction The amlodipine besylate component of amlodipine/bena- zepril capsules is chemically described as 3-ethyl-5-me- thyl (±)-2-[(2-aminoethoxy)methyl]-4-(2-chlorophenyl)-1, 4-dihydro-6-methyl-3,5-pyridinedicarboxylate, monoben- zenesulphonate [1]. Amlodipine is a dihydropyridine cal- cium antagonist (calcium ion antagonist or slow-channel blocker) that inhibits the movement of calcium ions into vascular smooth muscle cells and cardiac muscle cells. Amlodipinebesylate is a white to pale yellow crystalline powder, slightly soluble in water and sparingly soluble in ethanol. Amlodipine besylate has an empirical formula of C20H25ClN2O5·C6H6O3S, and its molecular weight is 567.1, its structural formula is shown in Scheme 1. Benazepril, the active metabolite of benazepril, is a no sulfhydryl angiotensin-converting enzyme (ACE) inhibi- tor. Benazepril is converted to benazeprilat by hepatic cleavage of the ester group. Benazepril hydrochloride is a white to off-white crys- *Corresponding author. 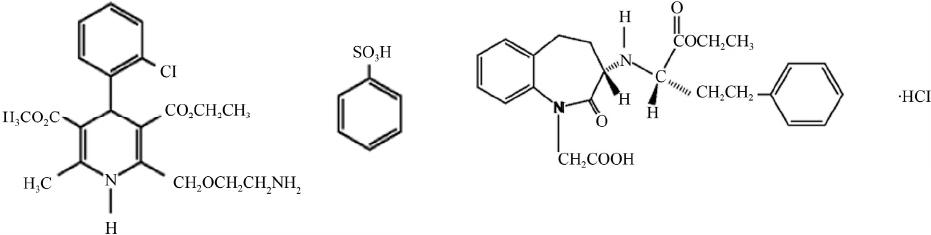 R. J. V. ERANKI ET AL. 716 Scheme 1. Amlodipine besy late c he mical str ucture. talline powder, soluble (>100 mg/mL) in water, in etha- nol, and in methanol. Benazepril hydrochloride’s chemi- cal name is 3-[[1-(ethoxycarbonyl)-3-phenyl-(1S)-propyl] amino]-2,3,4,5tetrahydro-2-oxo-1H-1-(3S)-benzazepine- 1-acetic acid monohydrochloride Benazepril Hydrochloride has an empirical formula of C24H28N2O5·HCl, and its molecular weight is 460.96 and its structural formula is shown in Scheme 2. Amlodipine/Benazepril Capsules Brand name is called as Lotrel [2]. Lotrel is a combination drug, containing benazepril (Lotensin) and amlodipine (Norvasc) and is used for treating high blood pressure. Benazepril is an angiotensin converting enzyme (ACE) inhibitor. ACE is an enzyme in the body that is important for the formation of angiotensin II. Angiotensin II causes constriction of the muscles surrounding arteries in the body, thereby nar- rowing the arteries and elevating blood pressure. ACE inhibitors such as benazepril lower blood pressure by inhibiting the formation of angiotensin II, thus relaxing the muscles and dilating the arteries. Relaxing the arter- ies not only lowers blood pressure, but also improves the pumping efficiency of a failing heart and improves the pumping of blood by the heart in patients with heart fail- ure. Amlodipine belongs to a class of medications called calcium channel blockers. These medications block the transport of calcium into the smooth muscle cells lining the coronary arteries and other arteries of the body. Since calcium is important in muscle contraction, blocking cal- cium transport relaxes artery muscles and dilates coro- nary arteries and other arteries of the body. Relaxing muscles of arteries lowers blood pressure. The FDA ap- proved Lotrel in March 1995. Amlodipine is official in USP [3] and Benazepril is also official in USP [4] and their combination drug prod- uct also official in USP pharmacopoeia. Lotrel is available in a variety of dosage combinations that can be adjusted to best fit your needs. The Dosage combinations are given as amlodipine besylate equiva- lent to 2.5 mg, 5 mg or 10 mg of amlodipine, with 10 mg, 20 mg or 40 mg of benazepril hydrochloride providing for the following available combinations: 2.5/10 mg, 5/10 mg, 5/20 mg, 5/40 mg, 10/20 mg and 10/40 mg. Scheme 2. Benazepril hydroc hlor ide chemical structure. Even though the products have been captured in USP, an in-house method has been developed and validated as per ICH guideline and monitoring of these impurities with good separation of peaks and quantification of im- purities in Amlodipine/Benazepril capsules as shown in Schemes 3 and 4. Stability testing forms an important part of the process of drug product testing to provide evidence on how qual- ity of a drug substance or drug product varies with time under the influence of a variety of environmental factors such as temperature, humidity, light and enables recom- mendation of storage conditions, retest periods and shelf life to be established. The two main aspects of drug products that play an important role in shelf life deter- minations are assay of active drug and degradants gener- ated during the stability study. Stability-indicating meth- ods have been reported for assays of various drugs in drug products containing only one active drug substance. Only few stability-indicating methods are reported for the impurity assay of combination drug products con- taining two or more active drug substances. The objec- tive of this work was to develop an analytical LC proce- dure, which would serve as stability-indicating impurity assay method for combination drug products of Am- lodipine and Benazepril. The literature survey reveals that several methods were reported for the individual estimation of Amlodipine and Benazepril. Various methods using HPLC [5-7], RP- HPLC [8,9], HPTLC [10,11], LC-MS [12], LCMS/MS [13] and simultaneous UV spectrophotometric methods [14,15] are reported for the estimation of Amlodipine alone or Be- nazepril alone or in combination with other agents [16]. In USP, the reported analytical procedures describe a me- thod for simultaneous determination of Amlodipine and Be- nazepril in combined pharmaceutical dosage form in the presence of their degradants with 110 minutes as runtime. If the reported individual methods are applied for the analysis of the capsules containing Amlodipine and Be- nazepril, it would require UPLC to have shorter runtime and it’s not possible for all to afford the same and the method would not be rapid, less expensive, or economi- cal, whereas the simultaneous determination of the in- gredients of the Capsules would be rapid, stability in- dicative and also economical and can be afforded by all. In the present study, attempts were made to develop a Open Access AJAC 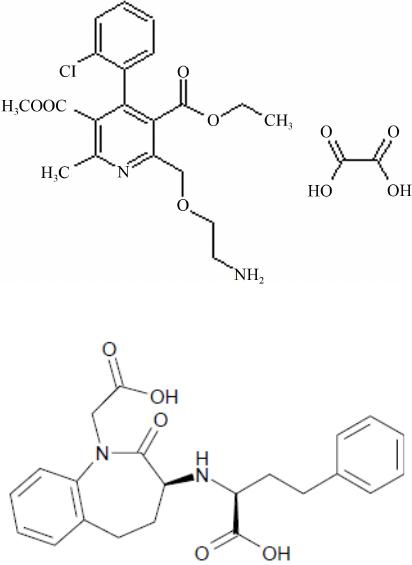 R. J. V. ERANKI ET AL. 717 Scheme 3. Amlodipine impurity -A chem ic al str uc t ur e . Scheme 4. Benazepril impurity-C chemical structure. rapid, economical, precise and accurate method for the simultaneous estimation of the ingredients of this com- bination in the presence of their degradants. 2. Experimental 2.1. Chemicals & Reagents Samples of amlodipine Impurity-A and the Benazepril impurity-C were synthesized and characterized at Hetero Drugs and Aarti Industries Limited, India. HPLC grade acetonitrile & Methanol was procured from Honeywell: Burdick & Jackson, Muskegon, MI 49442 and analytical grade Octylamine was procured from Sigma Aldrich Com- pany, 3050 spruce Street, St. Louis, MO-63103, High purity water was generated in-house from Siemens water purification system. The product Amlodipine Tablets in Benazepril Cap- sules consists of dibasic calcium phosphate, microcrys- talline cellulose, crospovidone colloidal silicon dioxide, magnesium stearate lactose monohydrate, pregelatinized starch and hydrogenated vegetable oil as excipients. The combination drug product samples were provided by InvaGen Pharmaceuticals, Inc. for this work. 2.2. Chromatographic Conditions The chromatographic system used was Shimadzu LC 2010 HPLC system comprised of degasser, quaternary pump, auto injector, column compartment, UV detector and the system was controlled through EZ chrome soft- ware. Symmetry C18, (4.6 × 150 mm), 5 micron or equiva- lent (Advance Chromatography, USA), maintained at 25˚C using a column oven, eluted with mobile phase at the flow rate of 1.0 mL·min−1 with Isocratic program. Mobile Phase: Transferred 700 mL of DI Water, 200 mL of Acetonitrile and 100 mL of Methanol into suitable container, Added 2.0 mL of Octylamine and mixed well. Adjusted the pH to 2.50 ± 0.05 using Ortho Phosphoric acid. Filtered through 0.45 µm nylon membrane filter and degassed. Measurements were made with injection volume 20 µl and ultraviolet (UV) detection at 240 nm. For standard and sample solution were prepared using the diluent nothing but Mobile phase. For analysis of forced degradation samples, the photo- diode array detector (Model No. 2998) and Empower Software was used in scan mode with a scan range of 200 - 400 nm. The peak homogeneity was expressed in terms of peak purity and was obtained directly from the spec- tral analysis report using the above-mentioned software. 2.3. Preparation of Solutions Standard Stock Solutions: Standard solutions were prepared by dissolving the drugs in the diluent and diluting them to the desired con- centration. Amlodipine: 34.7 mg AmlodipineStandard (99.8%) was accurately weighed, transferred into a 50 mL volumetric flask, and dissolved with diluent. Benazepril: 100.0 mg Benazepril standard (99.7%) was accurately weighed, transferred into a 100 mL volumetric flask, and dissolved with diluent. Low Level Standard Preparation: Transferred 1.0 mL of each above solution in 200 mL flask and diluted with diluent. The concentration of Low levelstandard Preparation contains 0.0003472 mg/mL of Amlodipine Besylate and 0.00050 mg/mL of Benazepril. Detectability Level Standard Preparation: Transferred 5.0 mL of the above Low level standard solution in 50mL flask and diluted with diluent. The concentration of Detectability level standard Preparation contains 0.000347 mg/mL of Amlodipine Besylate and 0.00050 mg/mL of Benazepril. Preparation of Sample: Weighed 20 capsules and recorded the weight. Emp- tied the capsules and cleaned the capsule shell with cot- ton swabs. Weighed the empty capsules and recorded the weight. Determined the average fill weight by subtract- ing empty capsule weight from filled capsule weight ob- tained. Open Access AJAC R. J. V. ERANKI ET AL. 718 A quantity of powder equivalent to 50.0 mg of Am- lodipine was transferred into a 100 mL volumetric flask. To this flask, 75 mL of diluent were added, and the solu- tion was sonicated for about 15 minutes with intermittent shaking and with mechanical shaking for about 15 min- utes. The solution was cooled to ambient temperature. Then the volume was made up with diluent and centri- fuged for about 15 minutes. Then the solution was used for injection. 2.4. Optimization of the Chromatographic Conditions To develop the stability-indicating method different sta- tionary phases like C18, Discovery HS C18, different mobile phases containing buffers like tri ethylamine in water, Tetra butyl ammonium hydrogen sulfate with dif- ferent pH (3 - 5) and organic modifier (acetonitrile) were used. Our objective of the chromatographic method devel- opment was to achieve a peak tailing factor <2, Signal to Noise Ratio should be above 10, Theoretical plates should be above 1000 for Amlodipine and Benazepril and % RSD for 5 consecutive injection should be less than NMT 10.0% and very good separation between am- lodipine Impurity-A, Benazepril Impurity-C along with drug peak amlodipine and benazepril. As this method is used for quantifying impurities in drug product only degradation products are monitored. This method is ca- pable of separating other process related impurities also but validation was done for only degradation products at this time. The chromatographic separation was achieved using a Symmetry C18, (4.6 × 150 mm), 5 micron or equivalent. Changing the composition of mobile phase optimized the chromatographic method. Segregation of both peaks (Amlodipine and Benazepril) was observed on any C18 or CN column but it was difficult to separate both drug de- gradants on these columns (amlodipine Impurity-A and Benazepril Impurity-C). The Symmetry C18 column showed better performance as compared to other columns. 3. Analytical Method Validation The developed chromatographic method was validated for selectivity, linearity, range, precision, accuracy, sen- sitivity, robustness and system suitability. 3.1. Selectivity/Specificity Selectivity of the developed method was assessed by performing forced degradation studies [9-13]. According to ICH [14] stress testing of the drug substance can help the intrinsic stability of the molecule and validate the stability indicating power of the analytical procedure used. Photo stability testing should be an integral part of stress testing. The standard conditions for photo stability testing are described in ICH Q1B [11]. The specificity of the developed LC method for Amlodipine and Benazepril was determined in the presence of its related compounds Amlodipine impurity-A, Benazepril impurity-C. The stress conditions employed on Amlodipine and Benazepril capsules as degradation study includes acid hydrolysis (5 mL of Conc. HCl), base hydrolysis (2 mL of 2N NaOH), oxidation (2 mL of 3% H2O2), photolysis (ICH Q1B) and thermal (80˚C) study. As such sample provided the Total Impurities level as below reporting limit (BRL) which includes Amlodipine Impurity-A and Benazepril Impurity-C as BRL whereas in acid degration the sample subjected to 5 mL of Conc. HCl for 2 hours and the Total degraded impurities were found 14.85%. In Base degradation the sample subjected to 2 mL of 2N NaOH for 2 hours which produces the total impurities of 0.29% and the samples under Oxidation with 2 mL of 3% H2O2 provides the Total impurities result as BRL. Under UV treatment of Sample on 3 days provides the Total impurities as 0.05% and in Thermal condition at 80˚C the total impurities were found 0.10%. For all the above, degradation studies results were pre- sented in Tables 1(a) and (b) and related chromatograms were represented in Figures 1 through 6. Tables 1(a) and (b) result of analysis of forced degra- dation study samples using the proposed method, indi- cating percentage of degradation and peak purity of Am- lodipine and Benazepril capsules. Figure 7 refers to Re- lated compound and Assay chromatogram of the combi- nation drug product. Figures 8 and 9 refer to peak purity plot of Amlodipine and Benazepril respectively. 3.2. Results and Discussion From the development studies, it was determined that using mobile phase as 750 mL of DI Water, 250 mL of Acetonitrile and 2 mL of Octylamine into a suitable con- tainer adjusted the pH of the solution to 2.50 ± 0.05 with the aid of Ortho phosphoric acid with Isocratic flow rate of 1.0 mL/min and ambient temperature. The analytes of this combination had adequate retentions, peak shape, less tailing, more resolution between drug and it’s de- gradantsand the chromatographic analysis time was about 60 minutes. In optimized conditions Amlodipine, Bena- zepril and their degradants were well separated. Typical retention times of Amlodipine and Benazepril were about 12.58 and 7.52 min and for amlodipine Impurity-A, Benazepril Impurity-C and benzene sulphonic acid were about 5.14 min, 3.57 min and 6.25 min respectively. The retention time asper USP monograph method was about 110 minutes but as per in-house validated method the retention time was 60 minutes which is reduced to Open Access AJAC 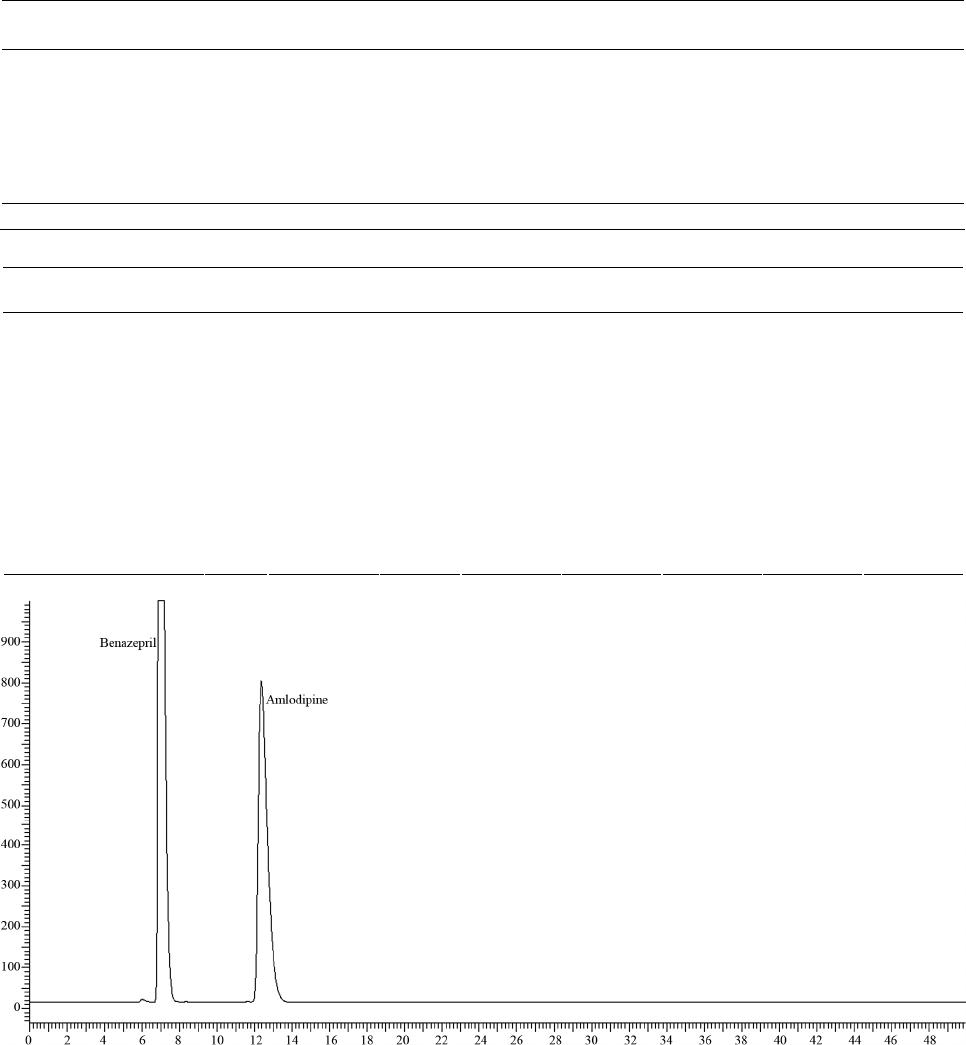 R. J. V. ERANKI ET AL. Open Access AJAC 719 Table 1. (a) Summary on forced degradation results-percentage of degradation; (b) Summary on forced degradation re- sults-peak purity. (a) Stress condition Time Amlodipine Imp-A (%) Benazepril Imp-C (%) Maximum individual unknown impurity (%) Total impurities (%) As such sample 0 hour BRL BRL BRL BRL Conc. HCl (5 mL) 2 hours 7.87 3.19 3.37 14.85 2N NaOH (2 mL) 2 hours BRL 0.29 BRL 0.29 3% H2O2(2 mL) 2 hours BRL BRL BRL BRL UV light 3 days BRL BRL 0.05 0.05 Thermal condition at 80˚C 7 days BRL BRL 0.05 BRL 0.10 ND: not detected; BRL: below reporting level (BRL = 0.05%), Imp: Impurity (b) Stress condition TimePeak Peak area Retention time (min)Purity angle Purity threshold Match angle Match threshold Amlodipine 203802 11.66 0.707 1.499 0.498 2.145 Conc. HCl (5 mL) 2 hours Benazepril 448906 7.62 0.125 0.440 0.124 1.226 Amlodipine 232198 11.56 0.413 0.683 0.605 1.846 2N NaOH (2 mL) 2 hours Benazepril 464553 7.64 0.090 0.272 0.128 1.157 Amlodipine 232336 11.51 1.013 1.863 1.136 2.664 3% H2O2 (2 mL) 2 hours Benazepril 466682 7.65 0.178 0.514 0.158 1.234 Amlodipine 231330 11.49 0.415 0.680 0.685 1.851 UV light 3 days Benazepril 467746 7.66 0.090 0.277 0.117 1.158 Amlodipine 233186 11.48 0.706 1.138 0.772 1.968 Thermal condition at 80˚C 7 days Benazepril 467911 7.66 0.133 0.387 0.126 1.186 Figure 1. Chromatogram of 10/40 mg sample on as such. fifty percent of total run time and at the same time the separations were achieved to greater extent and the meth- ods proved to be stability indicating. No EP methods are available on this combination. Instead of regular HPLC if we use UFLC the retention time can be reduced to an- other 20 minutes with the same suitability parameters. Development on UFLC is not an option in the present study keeping in view this application for cost effective generic products to help the people with low cost medi- cines. 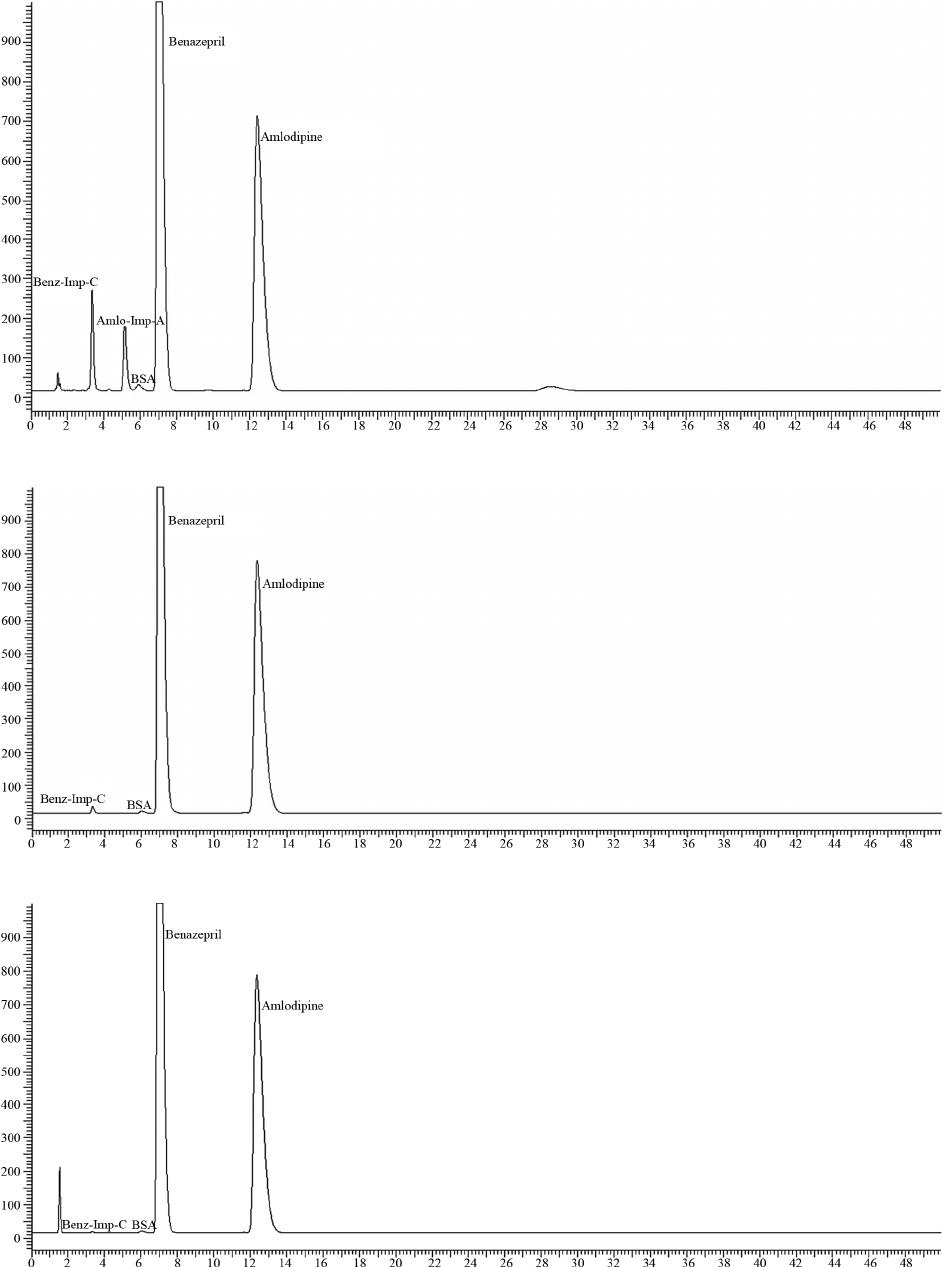 R. J. V. ERANKI ET AL. 720 Figure 2. Chromatogram of 10/40 mg sample on acid degradation. Figure 3. Chromatogram of 10/40 mg sample on Base degradation. Figure 4. Chromatogram of 10/40 mg sample on oxidation degradation. Open Access AJAC 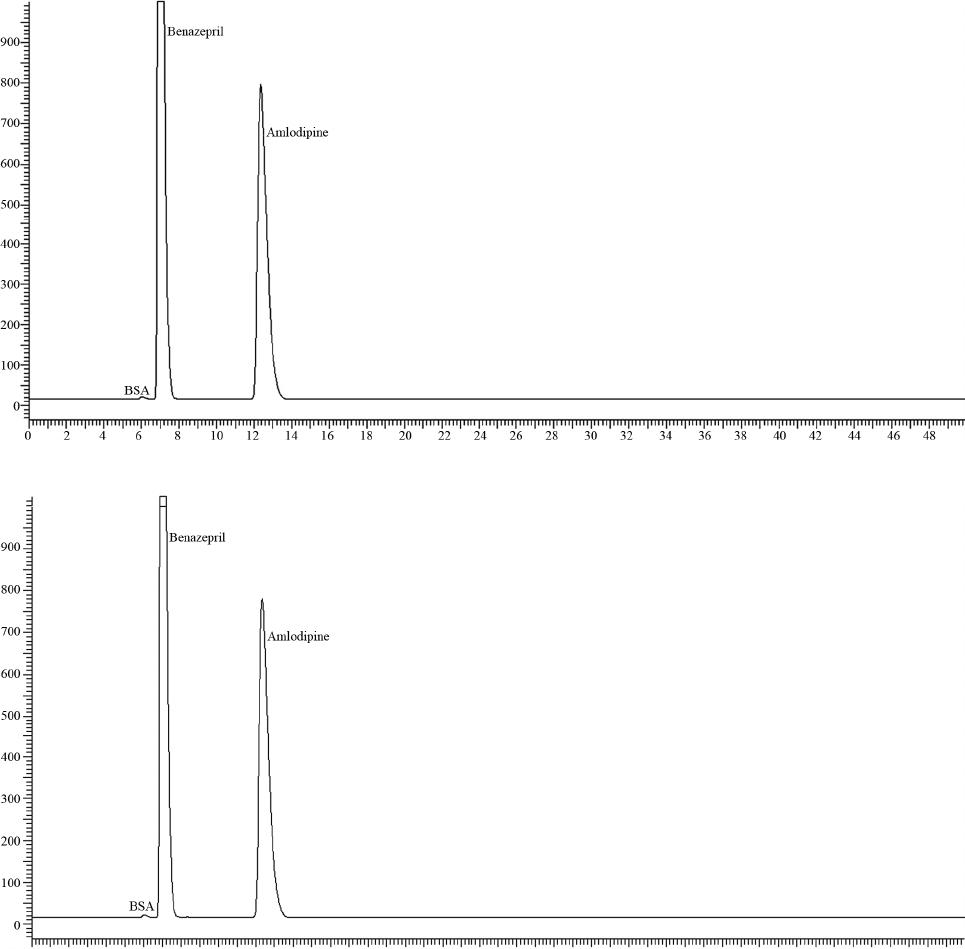 R. J. V. ERANKI ET AL. 721 Figure 5. Chromatogram of 10/40 mg sample on UV treatment. Figure 6. Chromatogram of 10/40 mg sample on Thermal treatment. During the initial forced degradation experiments, it was observed that acid hydrolysis was a fast reaction for Amlodipine and Benazepril capsules and almost complete degradation occurred when 5 mL of Conc. HCl solution was used.Both drugs showed extensive degradation in acidic condition and indicating homogeneous peaks and thus establishing the specificity of the Impurity assay method. 3.3. Calibration and Linearity Calibration curve obtained by the least square regression analysis between average peak area and concentration showed linear relationship with a regression coefficient of 0.999 over the calibration ranges tested. The results of linearity and range obtained for the two potential impurities were tabulated. Linear calibration plot for this chromatographic method was obtained over the calibration ranges tested, i.e. 0.05% to 1.0% for Am- lodipine impurity-A and 0.05% to 5.0% for Benazepril impurity-C. The correlation coefficient obtained was greater than 0.999 for the two impurities and the major com- pounds Amlodipine and Benazepril (Figures 10 and 11). The method exhibited good linearity with correlation coefficient values greater than 0.999. Open Access AJAC 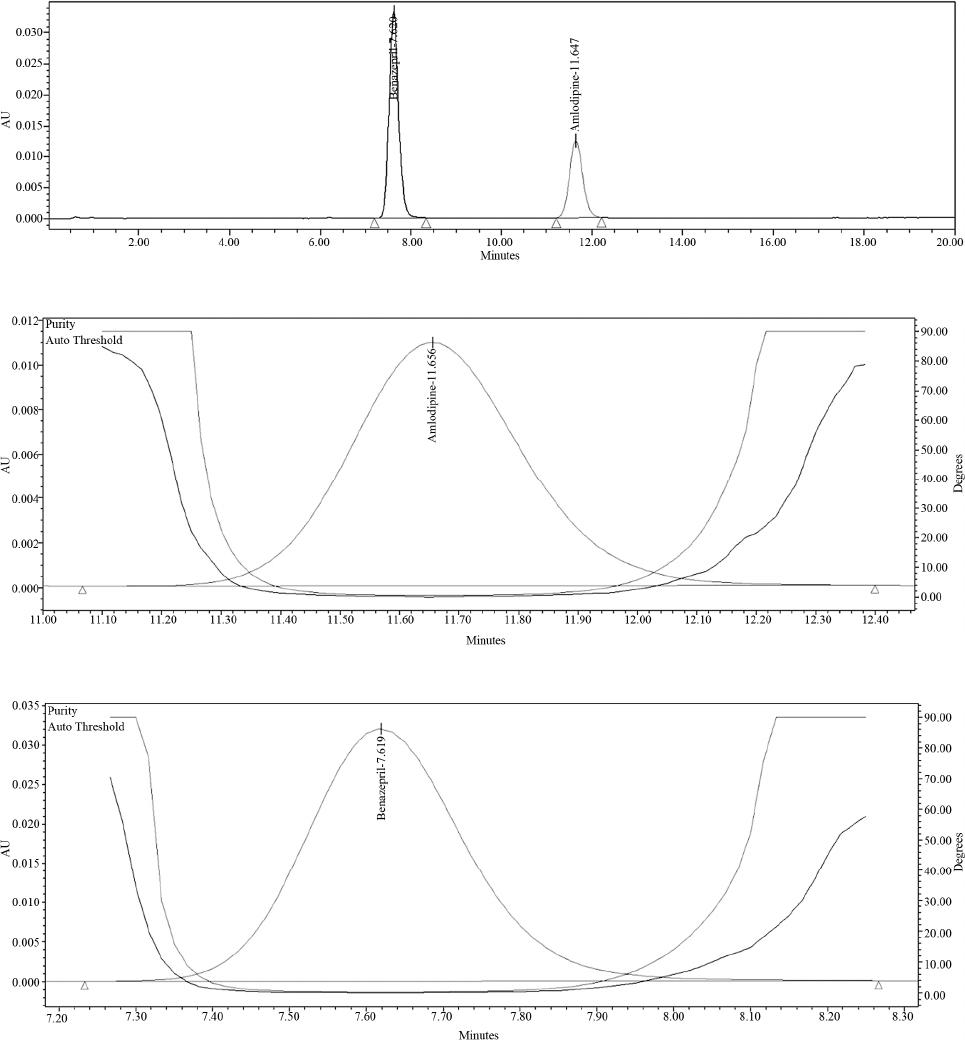 R. J. V. ERANKI ET AL. 722 Figure 7. Related substances and Assay chromatogram of amlodipine & benazepril 10/40 mg capsules. Figure 8. Purity plot of amlodipine from amlodipine & benazepril 10/40 mg capsules. Figure 9. Purity plot of benazepril from amlodipine & benazepril 10/40 mg capsules. 3.4. Precision (Repeatability) The precision of the method was studied by determining the concentrations of each0.13 and 0.16. The results of the precision study indicate that the method is reliable (RSD% < 10), in Tables 2(a) and (b). Table 2(a): % RSD of six (6) replicate injections of each impurity should be less than 10.0, theoretical plates should be NLT 1000 and tailing factor should be NMT 2.0 for system precision. Table 2(b): % RSD of six (6) sample preparations for each impurity should be less than 10.0 for method preci- sion. 3.5. Accuracy (Recovery Test) The percentage recovery was established for all the ana- lytes throughout the range concentration as explained Open Access AJAC 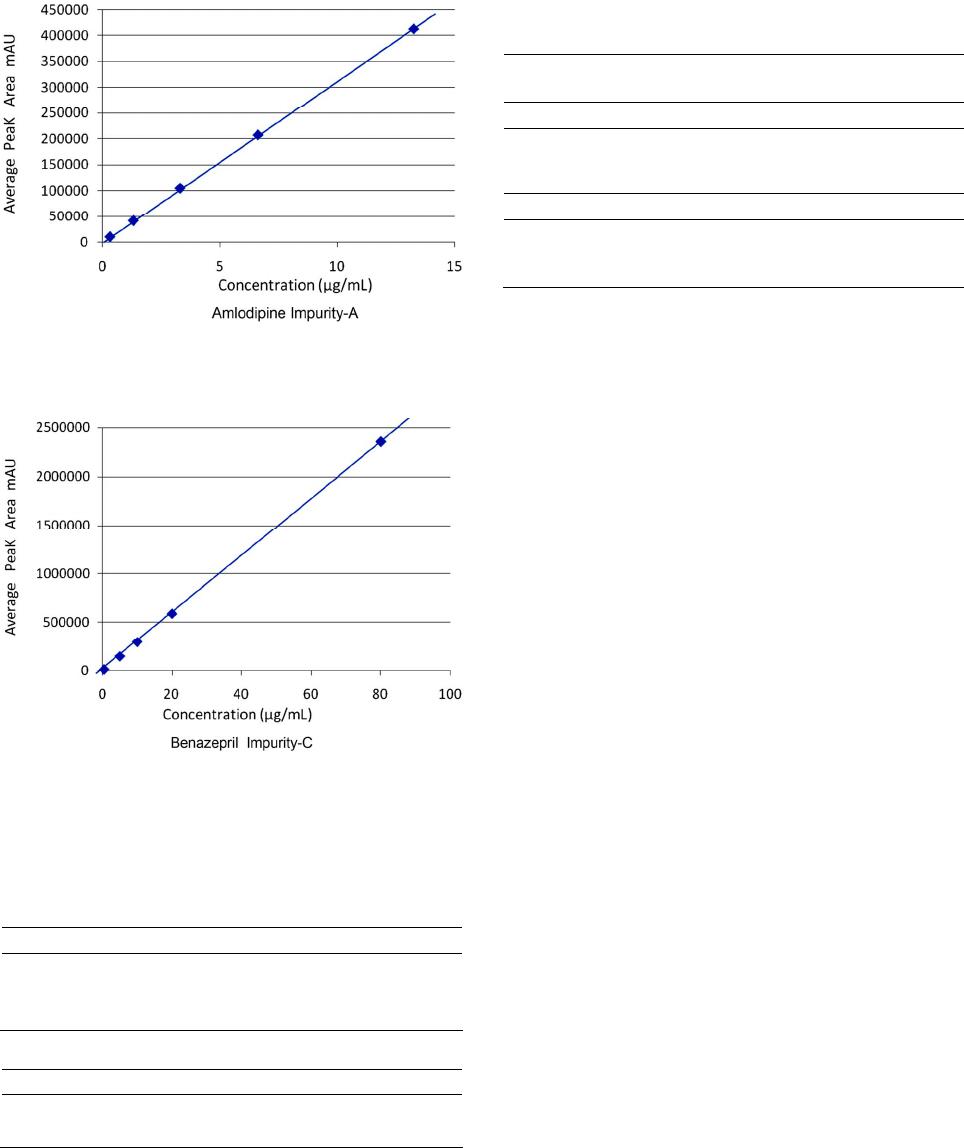 R. J. V. ERANKI ET AL. 723 Slope (m) = 31102.932 ,Intercept (c) = 883.342, Correlation Co-efficient (r) = 0.9999869. Figure 10. Linearity for amlodipine impurity-A. Slope (m) = 29317.229, Intercept = 3378.680, Correlation Co-efficient (r) = 0.99999. Figure 11. Linearity for benazepril impurity-C. Table 2. (a) System precision; (b) Method precision 10/40 mg. (a) Amlodipine Benazepril % RSD 0.13 0.16 Theoretical plates (N) 6881.82 6142.15 Tailing factor (T) 1.074 1.094 (b) Amlodipine Benazepril Amlodipine impurity-A % RSD 0.0 Benazepril impurity-C % RSD 0.0 under linearity studies and obtained results are tabulated in Table 3. 3.6. Robustness Robustness study was conducted by making small but Table 3. Recovery studies results for amlodipine Imp-A and benazepril Imp-C. R % Spiking level Average peak area % RecoveryMean recovery % Amlodipine Imp-A 0.4300 4.3000 17.2000 0.05 0.5 2.0 18,083 157,352 578,724 121.3 105.6 97.1 108.0 Benazepril Imp-C 1.0020 16.475 164.75 0.05 0.5 1.0 14,099 585,209 5,344,103 97.4 101.0 92.3 96.9 deliberate changes in the optimized method parameters. To determine robustness of the method, experimental conditions were purposely altered and chromatographic resolution between Amlodipine and Benazepril were evalu- ated. The flow rate of the mobile phase was 1.0 mL·min−1. To study the effect of flow rate on the retention time of Amlodipine and Benazepril it was changed to 0.9 ml/min and 1.1 ml/min. The effects of pH variation were studied at pH 2.40 and pH 2.60 instead of pH 2.50, while other mobile phase components were held constant. At all conditions the relative retention time found for Amlodipine Impu- rity-A and Benazepril Impurity-C were found 0.47 and 0.42 respectively. See Table 4. 3.7. Determination of Limit of Quantification Prepared Amlodipine and Benazepril LOQ solution as per the method containing the concentration of about 0.331 µg/mL of Amlodipine and 0.5000 µg/mL of Benazepril. Made five (5) replicate injections and re- corded % RSD. Calculated S/N ratio of 0.05% to estab- lish LOQ. See Table 5. 4. Conclusions The Isocratic RP-LC method developed the analysis of binary mixtures of Amlodipine and Benazeprilin. Their pharmaceutical preparation is precise, accurate and with a reasonable run time. This method is capable to detect both the drug components of Amlodipine and Benazepril in presence of their degradation products (Amlodipine Imp-A and Benazepril Impurity-C) with a detection level of 0.05%. The method was fully validated showing satisfactory data for all the method validation parameters tested. The developed method is stability-indicating, separates de- gradants and can be conveniently used by the quality control department to determine impurity assay of phar- maceutical preparations and also for stability sample analysis. Open Access AJAC  R. J. V. ERANKI ET AL. Open Access AJAC 724 Table 4. Summary on robustness paramete r study. Parameters Amlodipine impurity-A Benazepril impurity-C Flow rate of 1.0 mL/minute 0.46 0.43 Variation in flow rate of 0.9 mL/minute 0.47 0.42 Variation in flow rate of 1.1 mL/minute 0.47 0.42 Variation in pH of mobile phase—2.40 0.47 0.43 Variation in pH of mobile phase—2.60 0.47 0.42 Table 5. S/N ratio of amlodipine, benazepril and composite impurities at LOQ (0.05%) level. Component name Concentration µg/mL % RSD Signal to noise ratio (S/N) Amlodipine impurity-A 0.3310 0.27 78.915 Amlodipine 0.3469 0.21 188.860 Benazepril impurity-C 0.5010 0.13 197.081 Benazepril 0.5000 1.42 100.801 5. Acknowledgements The authors wish to thank the management of InvaGen Pharmaceuticals, Inc. for supporting this work. Coopera- tion from colleagues of Quality and Analytical Research and Development departments of InvaGen Pharmaceuti- cals, Inc. and Sciegen Pharmaceuticals, Inc. is appreciated. REFERENCES [1] S. Budavari, “The Merck Index,” 14th Edition, Merck and Co. Press, Whitehouse Station, 2006. [2] http://lotrel.org/ [3] The United States Pharmacopoeia Convention, Inc., Rock- ville, 2007, pp. 2466-2467. [4] The United States Pharmacopoeia Convention, Inc., Rock- ville, 2007, pp. 2608-2610. [5] A. Zarghi, S. M. Foroutan, A. Shafaati and A. Khoddam, “Validated HPLC Method for Determination of AML in Human Plasma and Its Application to Pharmacokinetic Studies,” Farmaco, Vol. 60, No. 9, 2005, pp. 789-792. http://dx.doi.org/10.1016/j.farmac.2005.06.012 [6] G. Bahrami and S. H. Mirzaeei, “Simple and Rapid HPLC Method for Determination of AML in Human Se- rum with Fluorescence Detection and Its Use in Pharma- cokinetic Studies,” Journal of Pharmaceutical and Bio- medical Analysis, Vol. 36, No. 1, 2004, pp. 163-168. http://dx.doi.org/10.1016/j.jpba.2004.05.016 [7] B. G. Chaudhari and N. M. Patel, “Development and Validation of HPLC Method for Simultaneous Estimation of Atorvastatin Calcium and Amlodipine Besylate,” Jour- nal of Pharmacy Research, Vol. 5, 2006, pp. 141-144. [8] A. P. Agrekar and S. G. Powar, “Reverse Phase High Per- formance Liquid Chromatographic Determination of Ra- mipril and AML in Tablets,” Journal of Pharmaceutical and Biomedical Analysis, Vol. 21, 2000, pp. 1137-1142. [9] B. G. Chaudhari, N. M. Patel and P. B. Shah, “Stability Indicating RP-HPLC for Simultaneous Determination of Atorvastatin Calcium and AML Besylate from Their Combination Drug Products,” Chemical and Pharmaceu- tical Bulletin, Vol. 55, No. 2, 2007, pp. 241-246. http://dx.doi.org/10.1248/cpb.55.241 [10] K. K. Pandya, M. Satia, T. P. Gandhi, I. A. Modi, R. I. Modi and B. K. Chakravarthy, “Detection and Determi- nation of Total AML by High Performance Thin Layer Chromatography,” Journal of Chromatography B: Bio- medical Sciences and Applications, Vol. 667, No. 2, 1995, pp. 315-320. http://dx.doi.org/10.1016/0378-4347(95)00016-C [11] S. N. Meyyanthan and B. Suresh, “HPTLC Method for the Simultaneous Determination of AML and Benazepril in Their Formulations,” Journal of Chromatographic Sci- ence, Vol. 43, No. 2, 2005, pp. 73-75. http://dx.doi.org/10.1093/chromsci/43.2.73 [12] Y. Feng, L. Zhang, Z. Shen, F. Pan and Z. Zhang, “Anal- ysis of AML in Human Plasma by Liquid Chromatogra- phy-Mass Spectrometry,” Journal of Chromatographic Science, Vol. 40, 2002, pp. 49-53. [13] J. Bhatt, S. Singh, G. Subbaiah, B. Shah, S. Kambli and S. Ameta, “A Rapid and Sensitive Liquid Chromatography Tandem Mass Spectrometry (LCMS/MS) for the Estima- tion of AML in Human Plasma,” Biomedical Chroma- tography, Vol. 21, No. 2, 2007, pp. 169-175. http://dx.doi.org/10.1002/bmc.730 [14] M. D. Malesuik, S. G. Cardoso, L. Bajerski and F. A. Lanzanova, “Determination of AML in Pharmaceutical Dosage Forms by Liquid Chromatography and Ultraviolet Spectrophotometry,” Journal of AOAC International, Vol. 89, 2006, pp. 359-364. [15] R. Sahu and V. B. Patel, “Simultaneous Spectrophoto- metric Determination of AML Besylate and Atorvastatin Calcium in Binary Mixture,” Indian Journal of Pharma- ceutical Sciences, Vol. 69, No. 1, 2007, pp. 110-111. http://dx.doi.org/10.4103/0250-474X.32119 [16] V. E. Rama Joga, I. Gopichand, J. S. Venkat, V. Sudhakar and J. Sree Ramulu, “New Stability Indicating Method for Quantification of Impurities in Amlodipine and Val- sartan Tablets by Validated HPLC,” ISRN Medicinal Chemistry, 2013. |