

Paper Menu >>
Journal Menu >>
 Journal of Applied Mathematics and Physics, 2013, 1, 54-56 Published Online November 2013 (http://www.scirp.org/journal/jamp) http://dx.doi.org/10.4236/jamp.2013.16011 Open Access JAMP Effect Analysis of Gurson Model Parameters on Crack Extension of Pipeline Tieping Li, Xinlu Tian Nuclear and Radiation Safety Center of MEP, Beijing, China Email: [email protected], [email protected] Received August 2013 ABSTRACT Leakage-before-break technique is widely used in high energy pipeline of nuclear plant, for which crack stability of pipeline under complex loading condition is a key issue, and crack growth resistance curve of pipeline material is the important foundation for crack stability analysis. In this paper, ferritic steel A533B is studied, Gurson damage model is used to simulate crack process of contact tension specimen under uni-tension, and effect of Gurson mod el parameter on simulation result is discu ssed. The following results are found dur ing simulation: initial porosity factor 0 f is the main parameter, when it increases gradually, unstable crack extension will be observed; however, only initial J toughness is affected by critical po rosity factor N f ; the minor parameter is loa d step control α , when it increases, stable and con- vergent result is obtained. All results in this paper can be used to determine parameters in Gurson mode, which will be foundation for cra c k extension anal y s i s of pi pe line. Keywords: Leakage-Before-Break; Crack Growth Resistance Curve; Gurson Damage Model; Crack Extension 1. Introduction In present, leakage-before-break (LBB) technique is widely used for collant pipeline in most operating and abuilding nuclear plants. In LBB technique, leakage can be detected in pipeline before unstable crack extension occurring in pipeline, and protective hardware and whip restraints can be removed for convenience of inspection operability, from which economic efficiency can be guaranteed. Since austenitic steel with high toughness is used for nuclear pipeline, elastic-plastic fracture is the main failure mode. Elastic-plastic fracture is a complex process, and fracture toughness IC J cannot be adapted directly to fracture analysis in complex structure [1]. Combination of fracture test and material model is pro- posed by some researchers since fracture mechanism is required by fracture process simulation [2], material model parameters can be deduced from combination re- sult [3], which can be used to simulate fracture process in any complex structure. Gurson model is proved to simulate fracture process well for metallic material from a lot of tests and theoretic studies [4]. Contact tension specimen made of ferritic steel A533B is studied in this paper, Gurson model is combined to describe micro fracture process in A533B material, and effect of Gurson model parameter on simu- lation results is analyzed by finite element method. 2. Gurson Model Metallic material is divided into two parts in Gurson model: basement material and porosity. In itial porosity is assumed as 0 f , when material is loaded, bigger poro sity is formed by connection of smaller porosity, and new crack surface is obtained at the same time. Material fail- ure can be judged by the following equation: ( ) 22 2 13 3 2 cosh10 2 em q g qfqf σσ σσ =+−+ = (1) In Equation (1), e σ is regarded as equivalent stress of the whole material, m σ is hydrostatic pressure, σ is equivalent stress of basement material, f is real-time porosity rate of the whole material. When f is larger than N f , which is defined as the critic porosity, crack extension will be found. In above equation, q1, q2, q3, is aspect ratio of porosity, which can be deduced by stress-strain curve of uni-tension test [5]. 3. Simulation Analysis 3.1. Material Property The stress-strain curve of ferritic steel A533B can be described as the following relationship: 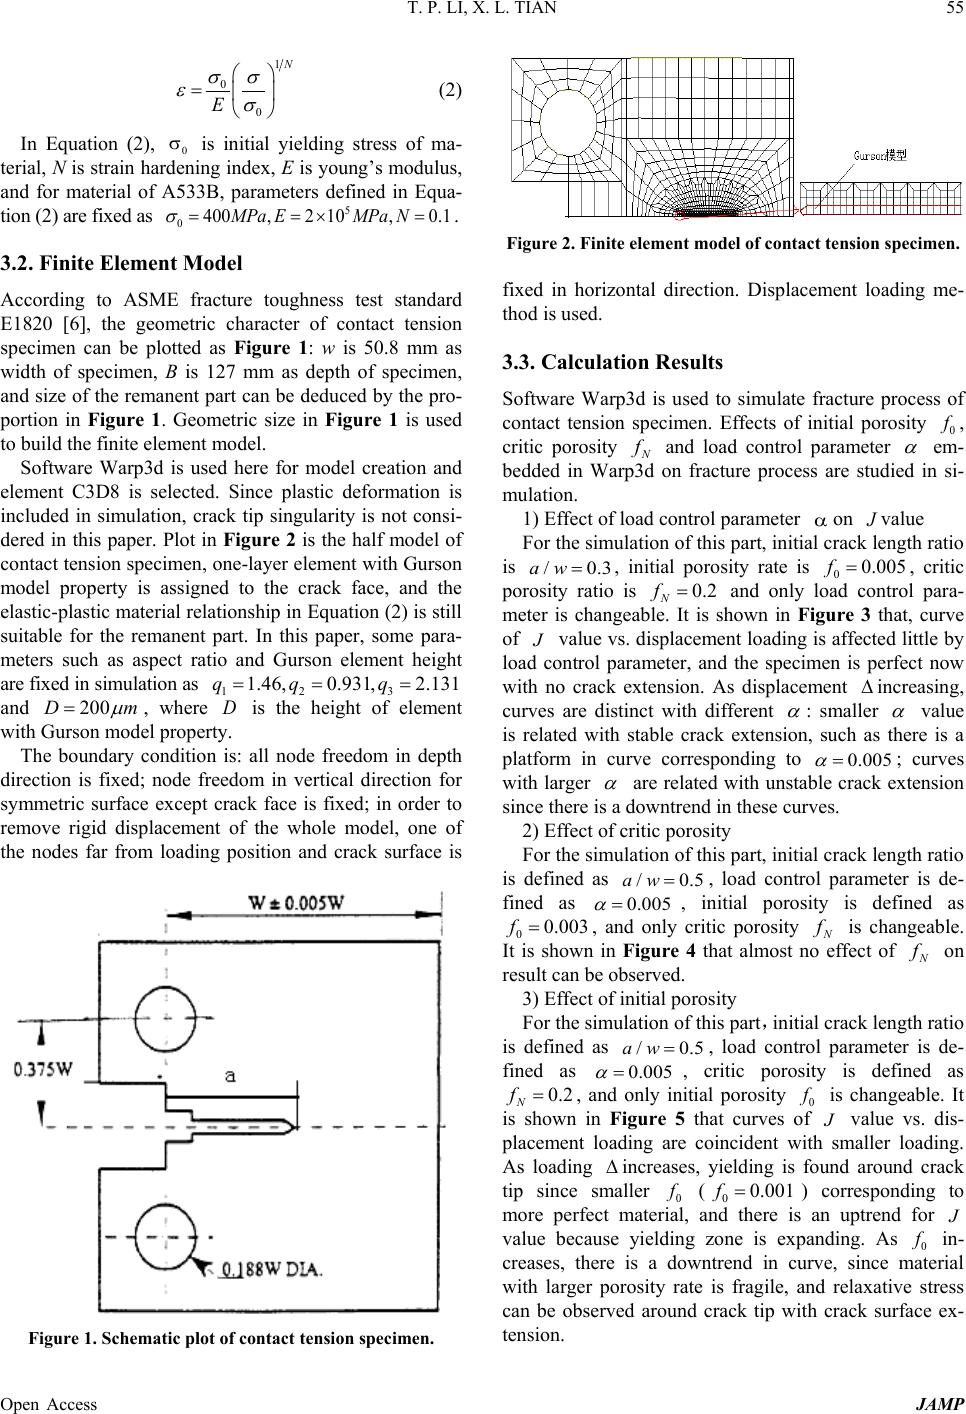 T. P. LI, X. L. TIAN Open Access JAMP 55 1 0 0 N E σσ εσ = (2) In Equation (2), 0 σ is initial yielding stress of ma- terial, N is strain hardening index, E is young’s modulus, and for material of A533B, parameters defined in Equa- tion (2) are fixed a s 5 0 400,2 10,0.1MPa EMPa N σ = =×= . 3.2. Finite Element Model According to ASME fracture toughness test standard E1820 [6], the geometric character of contact tension specimen can be plotted as Figure 1: w is 50.8 mm as width of specimen, B is 127 mm as depth of specimen, and size of the remanent part can be deduced by the pro- portion in Figure 1. Geometric size in Figure 1 is used to build the finite element model. Software Warp3d is used here for model creation and element C3D8 is selected. Since plastic deformation is included in simulation, crack tip singularity is not consi- dered in this paper. Plot in Figure 2 is the half model of contact tension specimen, one-layer element with Gurson model property is assigned to the crack face, and the elastic-plastic material relationsh ip in Equation (2) is still suitable for the remanent part. In this paper, some para- meters such as aspect ratio and Gurson element height are fixed in simulation as 12 3 1.46, 0.931, 2.131qq q= == and 200Dm µ = , where D is the height of element with Gurson model property. The boundary condition is: all node freedom in depth direction is fixed; node freedom in vertical direction for symmetric surface except crack face is fixed; in order to remove rigid displacement of the whole model, one of the nodes far from loading position and crack surface is Figure 1. Schematic plot of contact tension specimen. Figure 2. Finite element model of contact tension specimen. fixed in horizontal direction. Displacement loading me- thod is used. 3.3. Calculation Results Software Warp3d is used to simulate fracture process of contact tension specimen. Effects of initial porosity 0 f , critic porosity N f and load control parameter α em- bedded in Warp3d on fracture process are studied in si- mulation. 1) Effect of load control parameter α on J value For the simulation of this part, initial crack length ratio is / 0.3aw= , initial porosity rate is 0 0.005f= , critic porosity ratio is 0.2 N f= and only load control para- meter is changeable. It is shown in Figure 3 that, curve of J value vs. displacement loading is affected little by load control parameter, and the specimen is perfect now with no crack extension. As displacement ∆ increasing, curves are distinct with different α : smaller α value is related with stable crack extension, such as there is a platform in curve corresponding to 0.005 α = ; curves with larger α are related with unstable crack extension since there is a downtrend in these curves. 2) Effect of critic porosity For the simulation of this part, initial crack length ratio is defined as / 0.5aw= , load control parameter is de- fined as 0.005 α = , initial porosity is defined as 0 0.003f= , and only critic porosity N f is changeable. It is shown in Figure 4 that almost no effect of N f on result can be observed. 3) Effect of initial porosity For the simulation of this part,initial crack length ratio is defined as / 0.5aw= , load control parameter is de- fined as 0.005 α = , critic porosity is defined as 0.2 N f= , and only initial porosity 0 f is changeable. It is shown in Figure 5 that curves of J value vs. dis- placement loading are coincident with smaller loading. As loading ∆ increases, yielding is found around crack tip since smaller 0 f ( 0 0.001f= ) corresponding to more perfect material, and there is an uptrend for J value because yielding zone is expanding. As 0 f in- creases, there is a downtrend in curve, since material with larger porosity rate is fragile, and relaxative stress can be observed around crack tip with crack surface ex- tension. 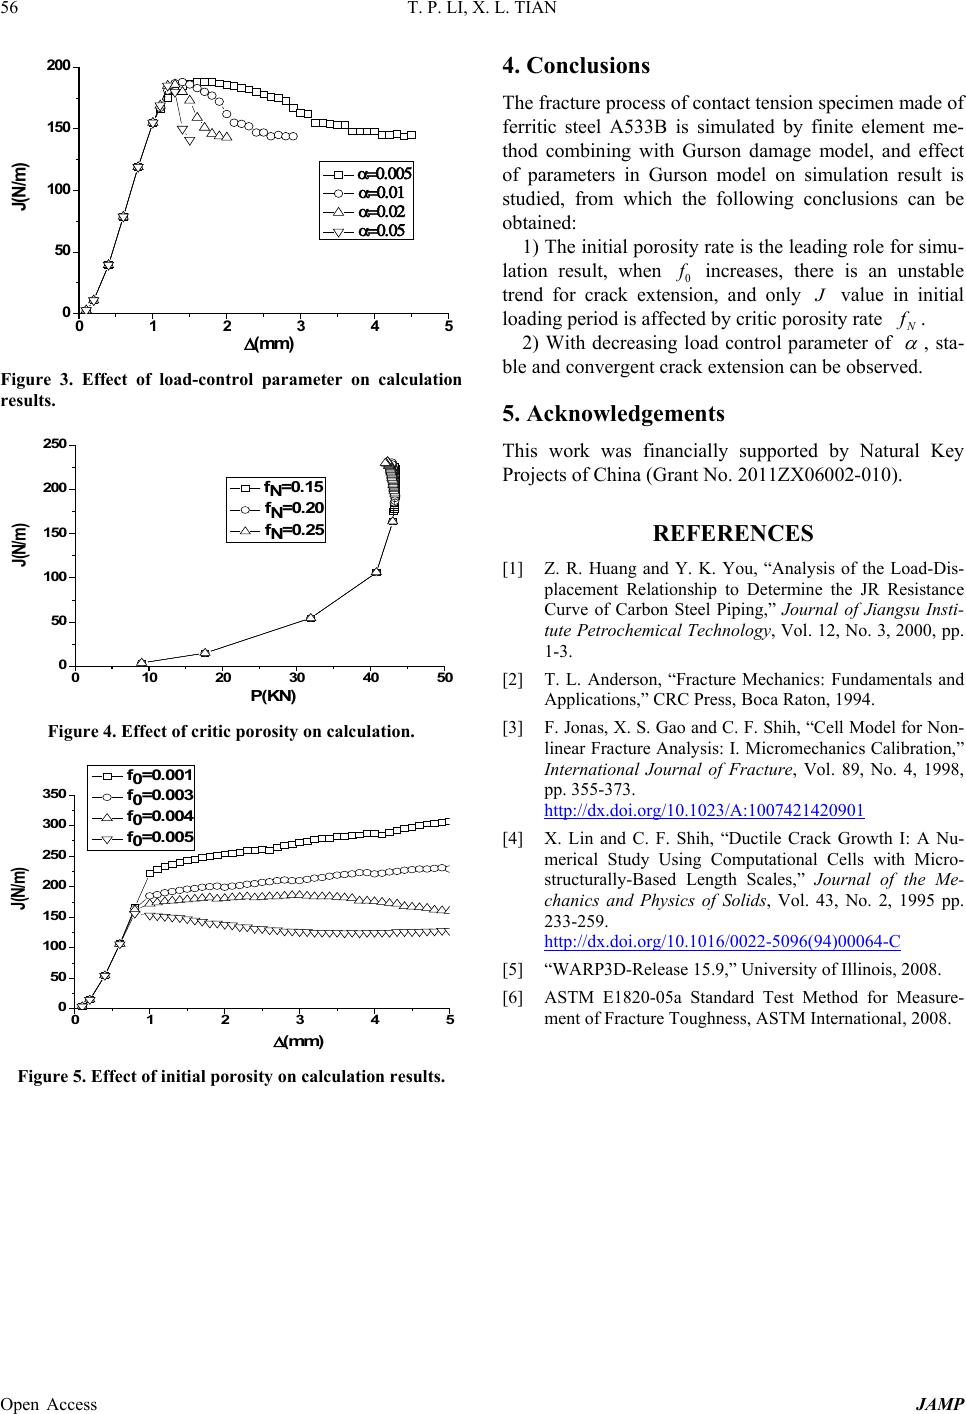 T. P. LI, X. L. TIAN Open Access JAMP 56 012345 0 50 100 150 200 α=0.005 α=0.01 α=0.02 α=0.05 J(N/m) ∆(mm) Figure 3. Effect of load-control parameter on calculation results. 010 20 30 40 50 0 50 100 150 200 250 J(N/m) fN=0. 15 f N=0. 20 f N=0. 25 P(KN) Figure 4. Effect of critic porosity on calculation. 012345 0 50 100 150 200 250 300 350 ∆(mm) J(N/m) f 0=0.001 f 0=0.003 f 0=0.004 f 0=0.005 Figure 5. Effect of initial porosity on calculation results. 4. Conclusions The fracture process of contact tension specimen made of ferritic steel A533B is simulated by finite element me- thod combining with Gurson damage model, and effect of parameters in Gurson model on simulation result is studied, from which the following conclusions can be obtained: 1) The initial porosity rate is the leading role for simu- lation result, when 0 f increases, there is an unstable trend for crack extension, and only J value in initial loading period is affected by critic porosity rate N f . 2) With decreasing load control parameter of α , sta- ble and convergent crack extension can be observed. 5. Acknowledgements This work was financially supported by Natural Key Projects of China (Grant No. 2011ZX06002-010). REFERENCES [1] Z. R. Huang and Y. K. You, “Analysis of the Load-Dis- placement Relationship to Determine the JR Resistance Curve of Carbon Steel Piping,” Journal of Jiangsu Insti- tute Petrochemical Technology, Vol. 12, No. 3, 2000, pp. 1-3. [2] T. L. Anderson, “Fracture Mechanics: Fundamentals and Applications,” CRC Press, Boca Raton, 1994. [3] F. Jonas, X. S. Gao and C. F. Shih, “Cell Model for Non- linear Fracture Analysis: I. Micromechanics Calibration,” International Journal of Fracture, Vol. 89, No. 4, 1998, pp. 355-373. http://dx.doi.org/10.1023/A:1007421420901 [4] X. Lin and C. F. Shih, “Ductile Crack Growth I: A Nu- merical Study Using Computational Cells with Micro- structurally-Based Length Scales,” Journal of the Me- chanics and Physics of Solids, Vol. 43, No. 2, 1995 pp. 233-259. http://dx.doi.org/10.1016/0022-5096(94)00064-C [5] “WARP3D-Release 15.9,” University of Illinois, 2008. [6] ASTM E1820-05a Standard Test Method for Measure- ment of Fracture Toughness, ASTM International, 2008. |