

Paper Menu >>
Journal Menu >>
 Low Carbon Economy, 2013, 4, 35-40 Published Online December 2013 (http://www.scirp.org/journal/lce) http://dx.doi.org/10.4236/lce.2013.44A004 Open Access LCE 35 Carbon Dioxide Emissions from Thermal Power Plants in Cameroon: A Case Study in Dibamba Power Development Company Jean Gaston Tamba1*, Francis Djanna Koffi1, Louis Monkam1, Simon Koumi Ngoh1, Serge Nyobe Biobiongono2 1Department of Thermal and Energy Engineering, University Institute of Technology, University of Douala, Douala, Cameroon; 2Dibamba Power Development Company, Douala, Cameroon. Email: *[email protected] Received September 28th, 2013; revised October 25th, 2013; accepted November 1st, 2013 Copyright © 2013 Jean Gaston Tamba et al. This is an open access article distributed under the Creative Commons Attribution Li- cense, which permits unrestricted use, distribution, and reproduction in any medium, provided the original work is properly cited. ABSTRACT This paper centres on the estimation of carbon dioxide emissions in a Cameroon thermal power plant called Dibamba Power Development Company, in such a way that they can be included as part of Cameroon energy sector inventory or used by the Dibamba Power Development Company to monitor its policy and technology improvements for mitigating climate change. We have estimated the emissions using national emission factors for the consumption of liquid fossil fuels and simulated a mitigation of these emissions till 2018 using alternative fossil fuels and carbon neutral model. The results show that energy demand and carbon dioxide emissions in 2012 are estimated to be 48.964 ktoe and 164.39 kt CO2 respectively. National emission factors for electricity generation are estimated to be 660.63 g/kWh. From 2012 to 2018, the thermal power plant will emit into the atmosphere 1298.42 kt CO2. These results also show that the use of alternative fuels will reduce 59.22 kt CO2 per year for the same period while the use of the carbon neutral model will reduce a total amount of 8.08 kt CO2. Finally, the total quantity of CO2 emission reduced for the period 2012 to 2018 will be 489.91 kt CO2. Keywords: Assessment; Carbon Dioxide Emissions; DPDC; Cameroon 1. Introduction The increase of greenhouse gases (GHG) emissions is an important and most concerned issue. Human activities are currently based on high consumption of fuels, and are actually the major cause of GHG emissions, which can undoubtedly be related with climatic changes [1]. There are six greenhouse gasses (GHGs) with their respective radiative forcing and global warming potential (GWP) [2]. However, carbon dioxide (CO2) emissions are the most important of the GHGs that are increasing in at- mospheric concentration because of human activities [3]. Transportation, industrial and electricity production (with fossil fuels combustion) are the main sectors iden- tified to contribute to the emission of CO2 in Cameroon. The electric power installed in Cameroon for the produc- tion of electricity is 1593 MW and 18 percent of this power is occupied by thermal power plants [4]. Currently, in Cameroon, the issue of CO2 emissions in thermal power plants is the focus of environmental policies of the country. Note that Cameroon has a fleet of electricity generation plants (thermal power) with a value of 285 MW which operates using fossil liquid fuels [4]. Among the thermal power plants that have this park, the Di- bamba Power Development Company (DPDC) is the largest with 88 MW of installed power. This paper estimates CO2 emissions in DPDC, com- prising national emission factors for fossil liquid fuels consumption [5,6]. CO2 emissions considered in this study are from the fossil liquid fuels consumption needed for electricity production. It is the emission from station- ary combustion (thermoelectric power station) and mo- bile combustion (vehicles) of the DPDC. The paper also calculates the national emission factors for electricity generation (kilogram CO2 per kilo watt hour) in 2012. In *Corresponding author. 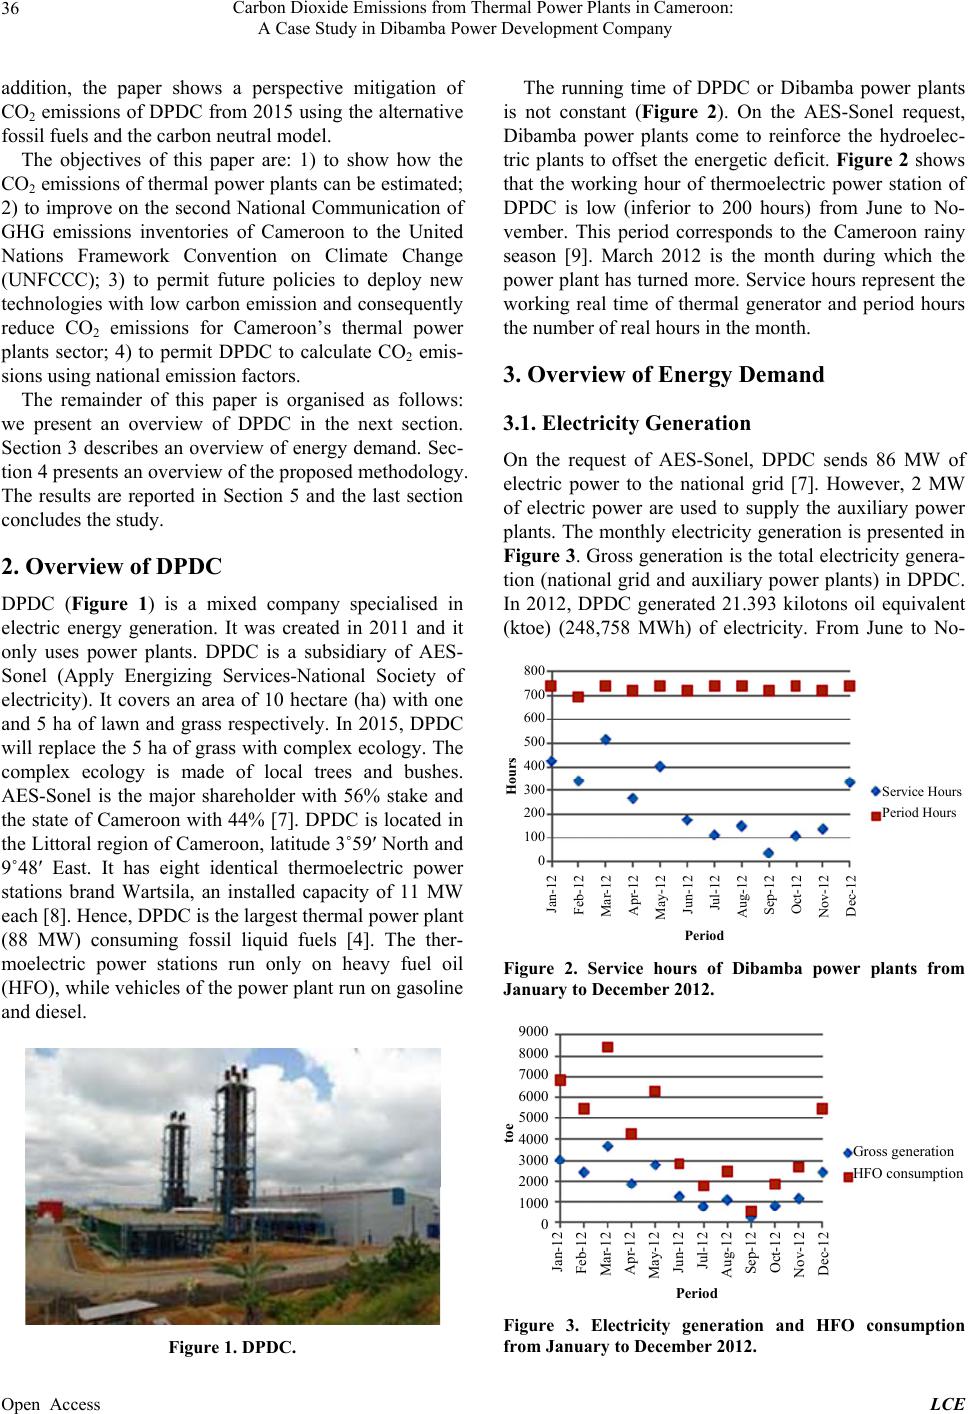 Carbon Dioxide Emissions from Thermal Power Plants in Cameroon: A Case Study in Dibamba Power Development Company 36 addition, the paper shows a perspective mitigation of CO2 emissions of DPDC from 2015 using the alternative fossil fuels and the carbon neutral model. The objectives of this paper are: 1) to show how the CO2 emissions of thermal power plants can be estimated; 2) to improve on the second National Communication of GHG emissions inventories of Cameroon to the United Nations Framework Convention on Climate Change (UNFCCC); 3) to permit future policies to deploy new technologies with low carbon emission and consequently reduce CO2 emissions for Cameroon’s thermal power plants sector; 4) to permit DPDC to calculate CO2 emis- sions using national emission factors. The remainder of this paper is organised as follows: we present an overview of DPDC in the next section. Section 3 describes an overview of energy demand. Sec- tion 4 presents an overview of the proposed methodology. The results are reported in Section 5 and the last section concludes the study. 2. Overview of DPDC DPDC (Figure 1) is a mixed company specialised in electric energy generation. It was created in 2011 and it only uses power plants. DPDC is a subsidiary of AES- Sonel (Apply Energizing Services-National Society of electricity). It covers an area of 10 hectare (ha) with one and 5 ha of lawn and grass respectively. In 2015, DPDC will replace the 5 ha of grass with complex ecology. The complex ecology is made of local trees and bushes. AES-Sonel is the major shareholder with 56% stake and the state of Cameroon with 44% [7]. DPDC is located in the Littoral region of Cameroon, latitude 3˚59′ North and 9˚48′ East. It has eight identical thermoelectric power stations brand Wartsila, an installed capacity of 11 MW each [8]. Hence, DPDC is the largest thermal power plant (88 MW) consuming fossil liquid fuels [4]. The ther- moelectric power stations run only on heavy fuel oil (HFO), while vehicles of the power plant run on gasoline and diesel. Figure 1. DPDC. The running time of DPDC or Dibamba power plants is not constant (Figure 2). On the AES-Sonel request, Dibamba power plants come to reinforce the hydroelec- tric plants to offset the energetic deficit. Figure 2 shows that the working hour of thermoelectric power station of DPDC is low (inferior to 200 hours) from June to No- vember. This period corresponds to the Cameroon rainy season [9]. March 2012 is the month during which the power plant has turned more. Service hours represent the working real time of thermal generator and period hours the number of real hours in the month. 3. Overview of Energy Demand 3.1. Electricity Generation On the request of AES-Sonel, DPDC sends 86 MW of electric power to the national grid [7]. However, 2 MW of electric power are used to supply the auxiliary power plants. The monthly electricity generation is presented in Figure 3. Gross generation is the total electricity genera- tion (national grid and auxiliary power plants) in DPDC. In 2012, DPDC generated 21.393 kilotons oil equivalent (ktoe) (248,758 MWh) of electricity. From June to No- Service Hours Period Hours 800 700 600 500 400 300 200 100 0 Jan-12 Feb-12 Mar-12 Apr-12 May-12 Jun-12 Jul-12 Aug-12 Sep-12 Oct-12 Nov-12 Dec-12 Period Hours Figure 2. Service hours of Dibamba power plants from January to December 2012. Gross generation HFO consumption 9000 8000 7000 6000 5000 4000 3000 2000 1000 0 Jan-12 Feb-12 Mar-12 Apr-12 May-12 Jun-12 Jul-12 Aug-12 Sep-12 Oct-12 Nov-12 Dec-12 Period toe Figure 3. Electricity generation and HFO consumption from January to December 2012. Open Access LCE 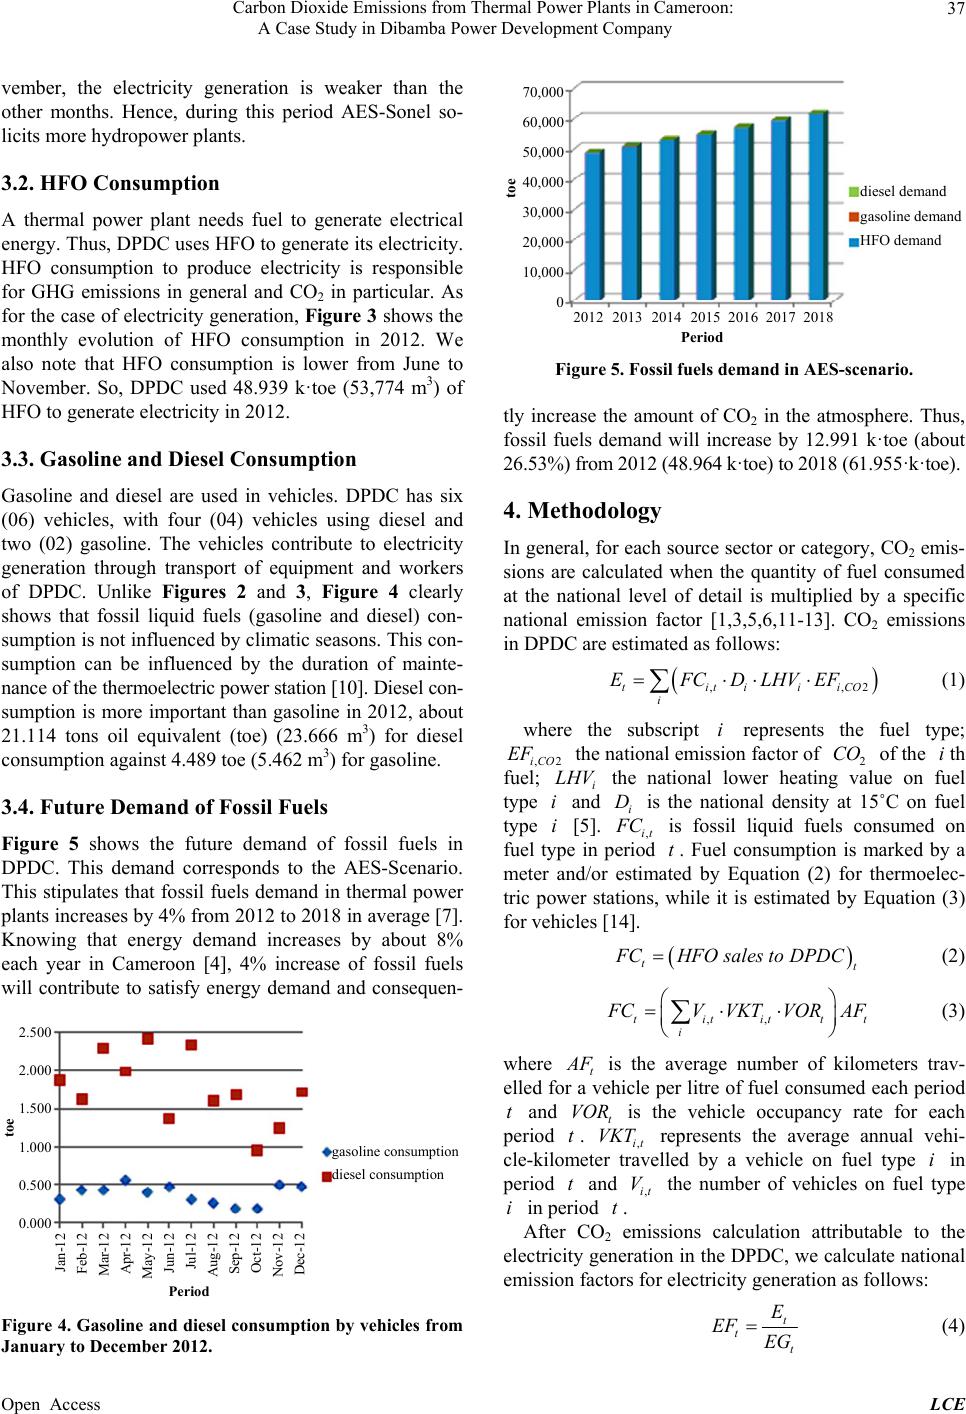 Carbon Dioxide Emissions from Thermal Power Plants in Cameroon: A Case Study in Dibamba Power Development Company 37 vember, the electricity generation is weaker than the other months. Hence, during this period AES-Sonel so- licits more hydropower plants. 3.2. HFO Consumption A thermal power plant needs fuel to generate electrical energy. Thus, DPDC uses HFO to generate its electricity. HFO consumption to produce electricity is responsible for GHG emissions in general and CO2 in particular. As for the case of electricity generation, Figure 3 shows the monthly evolution of HFO consumption in 2012. We also note that HFO consumption is lower from June to November. So, DPDC used 48.939 k·toe (53,774 m3) of HFO to generate electricity in 2012. 3.3. Gasoline and Diesel Consumption Gasoline and diesel are used in vehicles. DPDC has six (06) vehicles, with four (04) vehicles using diesel and two (02) gasoline. The vehicles contribute to electricity generation through transport of equipment and workers of DPDC. Unlike Figures 2 and 3, Figure 4 clearly shows that fossil liquid fuels (gasoline and diesel) con- sumption is not influenced by climatic seasons. This con- sumption can be influenced by the duration of mainte- nance of the thermoelectric power station [10]. Diesel con- sumption is more important than gasoline in 2012, about 21.114 tons oil equivalent (toe) (23.666 m3) for diesel consumption against 4.489 toe (5.462 m3) for gasoline. 3.4. Future Demand of Fossil Fuels Figure 5 shows the future demand of fossil fuels in DPDC. This demand corresponds to the AES-Scenario. This stipulates that fossil fuels demand in thermal power plants increases by 4% from 2012 to 2018 in average [7]. Knowing that energy demand increases by about 8% each year in Cameroon [4], 4% increase of fossil fuels will contribute to satisfy energy demand and consequen- gasoline consumption diesel consumption 2.500 2.000 1.500 1.000 0.500 0.000 Jan-12 Feb-12 Mar-12 Apr-12 May-12 Jun-12 Jul-12 Aug-12 Sep-12 Oct-12 Nov-12 Dec-12 Period toe Figure 4. Gasoline and diesel consumption by vehicles from January to December 2012. diesel demand gasoline demand HFO demand 70,000 60,000 50,000 40,000 30,000 20,000 10,000 0 Period toe 2012 2013 2014 2015 2016 2017 2018 Figure 5. Fossil fuels demand in AES-scenario. tly increase the amount of CO2 in the atmosphere. Thus, fossil fuels demand will increase by 12.991 k·toe (about 26.53%) from 2012 (48.964 k·toe) to 2018 (61.955·k·toe). 4. Methodology In general, for each source sector or category, CO2 emis- sions are calculated when the quantity of fuel consumed at the national level of detail is multiplied by a specific national emission factor [1,3,5,6,11-13]. CO2 emissions in DPDC are estimated as follows: ,,2titiiiCO i EFCDLHVEF (1) where the subscript i represents the fuel type; , the national emission factor of 2 of the th fuel; i the national lower heating value on fuel type and is the national density at 15˚C on fuel type [5]. ,it 2iC O EF LH i i CO i V i D F C is fossil liquid fuels consumed on fuel type in period . Fuel consumption is marked by a meter and/or estimated by Equation (2) for thermoelec- tric power stations, while it is estimated by Equation (3) for vehicles [14]. t tt F CHFOsales toDPDC (2) ,,titittt i F CVVKTVORAF (3) where t A F VOR t t is the average number of kilometers trav- elled for a vehicle per litre of fuel consumed each period and is the vehicle occupancy rate for each period . ,it represents the average annual vehi- cle-kilometer travelled by a vehicle on fuel type in period and ,it V the number of vehicles on fuel type in period t. t i t VKT i After CO2 emissions calculation attributable to the electricity generation in the DPDC, we calculate national emission factors for electricity generation as follows: t tt E EF EG (4) Open Access LCE 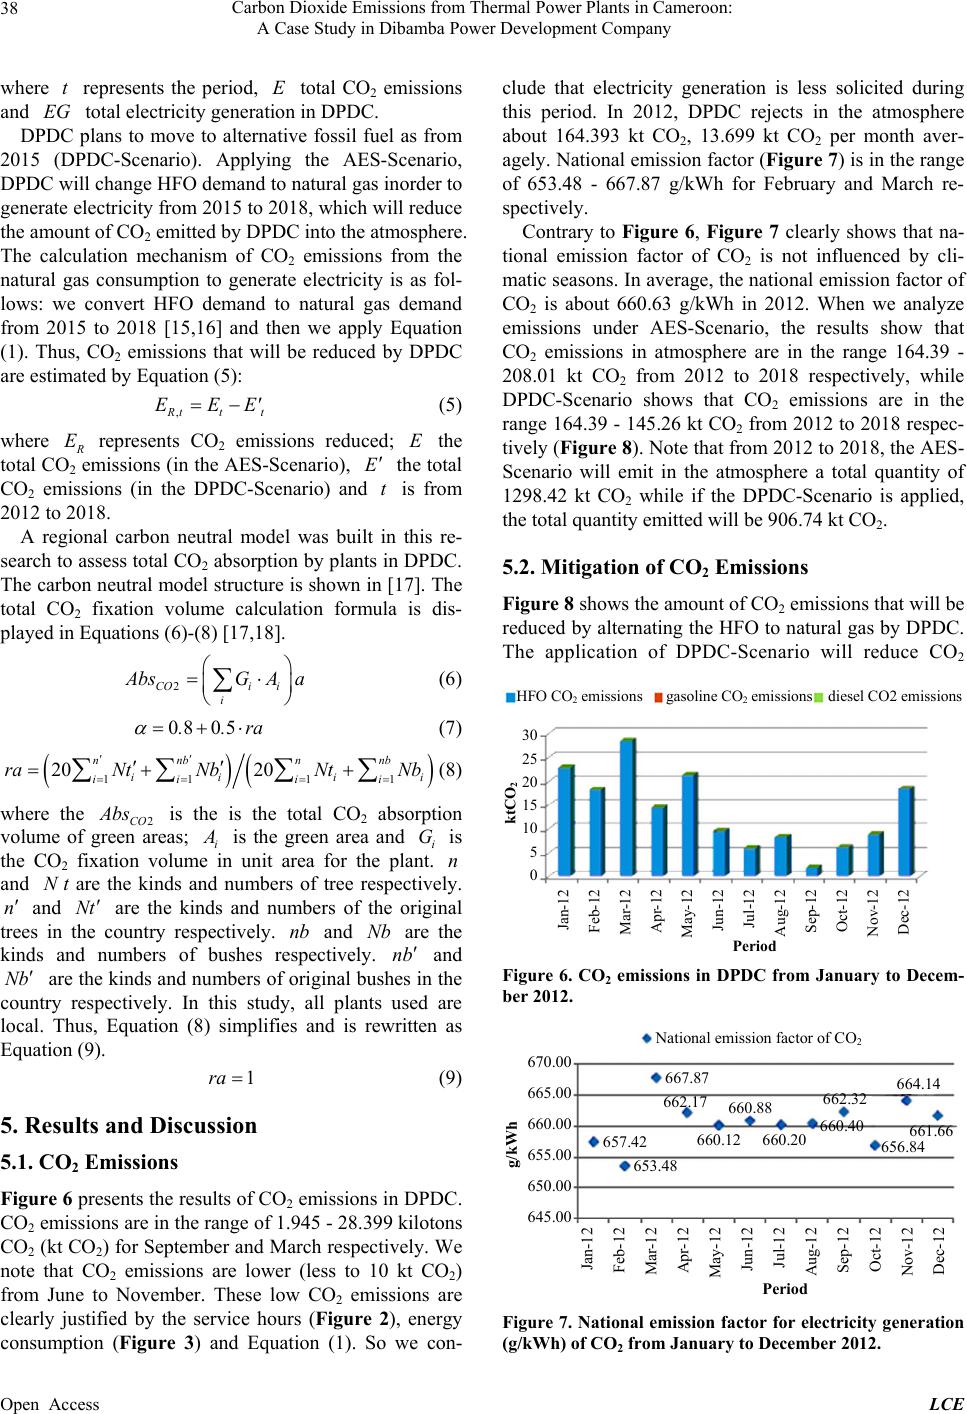 Carbon Dioxide Emissions from Thermal Power Plants in Cameroon: A Case Study in Dibamba Power Development Company 38 where represents the period, total CO2 emissions and total electricity generation in DPDC. t EG E DPDC plans to move to alternative fossil fuel as from 2015 (DPDC-Scenario). Applying the AES-Scenario, DPDC will change HFO demand to natural gas inorder to generate electricity from 2015 to 2018, which will reduce the amount of CO2 emitted by DPDC into the atmosphere. The calculation mechanism of CO2 emissions from the natural gas consumption to generate electricity is as fol- lows: we convert HFO demand to natural gas demand from 2015 to 2018 [15,16] and then we apply Equation (1). Thus, CO2 emissions that will be reduced by DPDC are estimated by Equation (5): , R tt EEE t ' (5) where R E represents CO2 emissions reduced; the total CO2 emissions (in the AES-Scenario), the total CO2 emissions (in the DPDC-Scenario) and is from 2012 to 2018. E E t A regional carbon neutral model was built in this re- search to assess total CO2 absorption by plants in DPDC. The carbon neutral model structure is shown in [17]. The total CO2 fixation volume calculation formula is dis- played in Equations (6)-(8) [17,18]. 2COi i i A bsG A a 08 05..ra (6) (7) 11 11 20 20 nnb nnb ii ii ii ii raNt NbNt Nb (8) where the 2CO A bs is the is the total CO2 absorption volume of green areas; i A is the green area and i is the CO2 fixation volume in unit area for the plant. and t are the kinds and numbers of tree respectively. and are the kinds and numbers of the original trees in the country respectively. and are the kinds and numbers of bushes respectively. G n N nNt nb Nbnb and are the kinds and numbers of original bushes in the country respectively. In this study, all plants used are local. Thus, Equation (8) simplifies and is rewritten as Equation (9). Nb 1ra (9) 5. Results and Discussion 5.1. CO2 Emissions Figure 6 presents the results of CO2 emissions in DPDC. CO2 emissions are in the range of 1.945 - 28.399 kilotons CO2 (kt CO2) for September and March respectively. We note that CO2 emissions are lower (less to 10 kt CO2) from June to November. These low CO2 emissions are clearly justified by the service hours (Figure 2), energy consumption (Figure 3) and Equation (1). So we con- clude that electricity generation is less solicited during this period. In 2012, DPDC rejects in the atmosphere about 164.393 kt CO2, 13.699 kt CO2 per month aver- agely. National emission factor (Figure 7) is in the range of 653.48 - 667.87 g/kWh for February and March re- spectively. Contrary to Figure 6, Figure 7 clearly shows that na- tional emission factor of CO2 is not influenced by cli- matic seasons. In average, the national emission factor of CO2 is about 660.63 g/kWh in 2012. When we analyze emissions under AES-Scenario, the results show that CO2 emissions in atmosphere are in the range 164.39 - 208.01 kt CO2 from 2012 to 2018 respectively, while DPDC-Scenario shows that CO2 emissions are in the range 164.39 - 145.26 kt CO2 from 2012 to 2018 respec- tively (Figure 8). Note that from 2012 to 2018, the AES- Scenario will emit in the atmosphere a total quantity of 1298.42 kt CO2 while if the DPDC-Scenario is applied, the total quantity emitted will be 906.74 kt CO2. 5.2. Mitigation of CO2 Emissions Figure 8 shows the amount of CO2 emissions that will be reduced by alternating the HFO to natural gas by DPDC. The application of DPDC-Scenario will reduce CO2 Jan-12 Feb- 12 Mar-12 Apr-12 May-12 Jun-12 Jul-12 Aug-12 Sep- 12 Oct-12 Nov-12 Dec-12 Period 30 25 20 15 10 5 0 ktCO 2 HFO CO 2 emissions gasoline CO 2 emissions diesel CO2 emissions Figure 6. CO2 emissions in DPDC from January to Decem- ber 2012. Jan-12 Feb-12 Mar-12 Apr-12 May-12 Jun-12 Jul-12 Aug-12 Sep-12 Oct-12 Nov-12 Dec-12 Period 670.00 665.00 660.00 655.00 650.00 645.00 g/kWh N ational emission factor of CO 2 667.87 664.14 661.66 656.84 662.32 660.40 660.20 660.88 660.12 662.17 657.42 653.48 Figure 7. National emission factor for electricity generation (g/kWh) of CO2 from January to December 2012. Open Access LCE 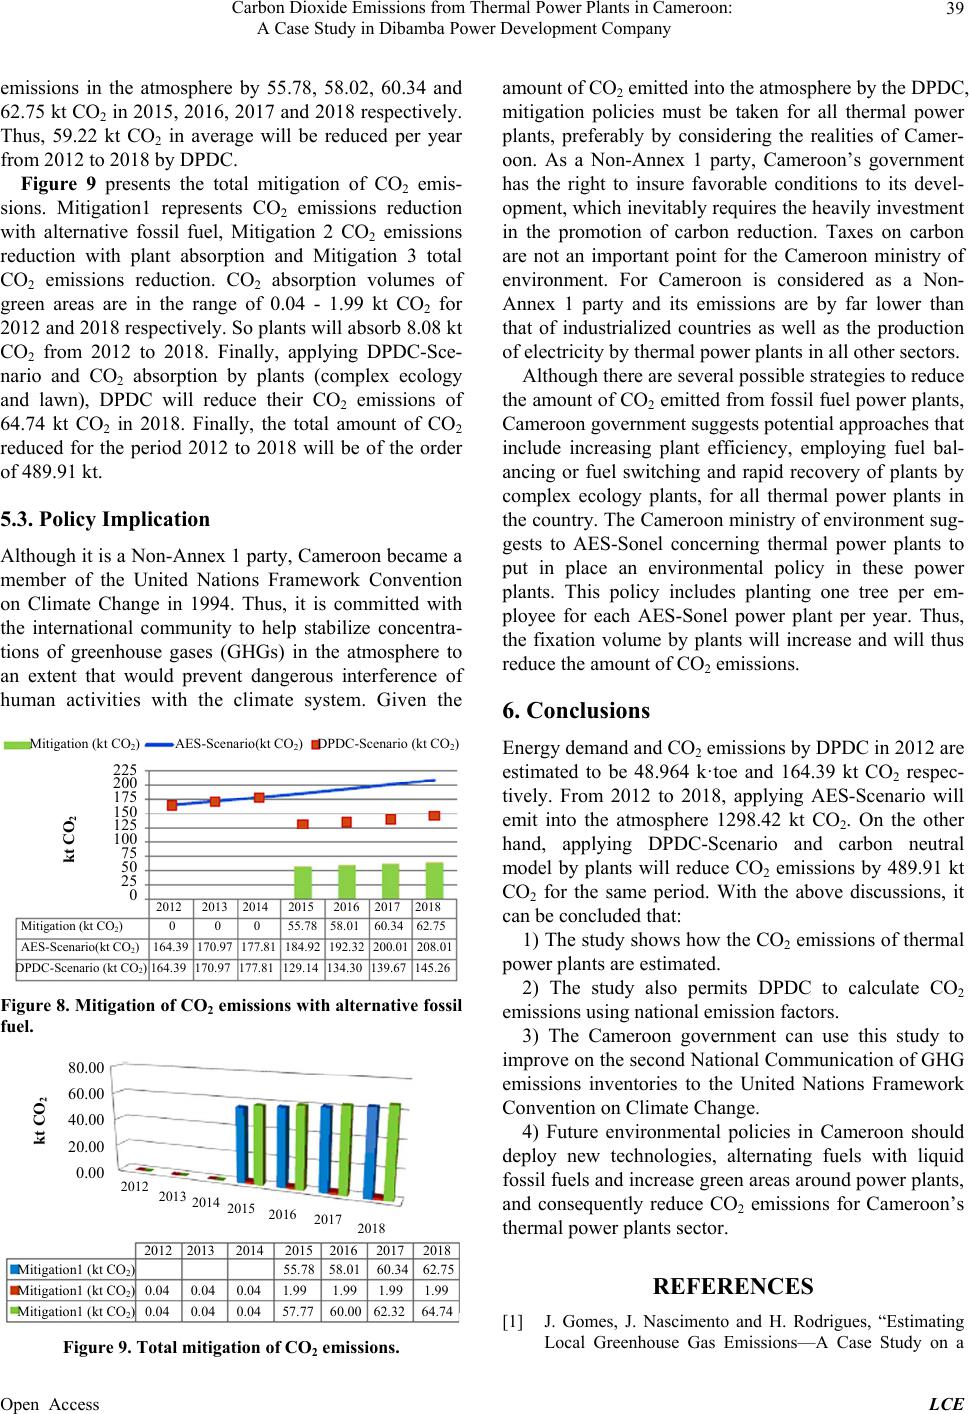 Carbon Dioxide Emissions from Thermal Power Plants in Cameroon: A Case Study in Dibamba Power Development Company 39 emissions in the atmosphere by 55.78, 58.02, 60.34 and 62.75 kt CO2 in 2015, 2016, 2017 and 2018 respectively. Thus, 59.22 kt CO2 in average will be reduced per year from 2012 to 2018 by DPDC. Figure 9 presents the total mitigation of CO2 emis- sions. Mitigation1 represents CO2 emissions reduction with alternative fossil fuel, Mitigation 2 CO2 emissions reduction with plant absorption and Mitigation 3 total CO2 emissions reduction. CO2 absorption volumes of green areas are in the range of 0.04 - 1.99 kt CO2 for 2012 and 2018 respectively. So plants will absorb 8.08 kt CO2 from 2012 to 2018. Finally, applying DPDC-Sce- nario and CO2 absorption by plants (complex ecology and lawn), DPDC will reduce their CO2 emissions of 64.74 kt CO2 in 2018. Finally, the total amount of CO2 reduced for the period 2012 to 2018 will be of the order of 489.91 kt. 5.3. Policy Implication Although it is a Non-Annex 1 party, Cameroon became a member of the United Nations Framework Convention on Climate Change in 1994. Thus, it is committed with the international community to help stabilize concentra- tions of greenhouse gases (GHGs) in the atmosphere to an extent that would prevent dangerous interference of human activities with the climate system. Given the Mitigation (kt CO 2 ) AES-Scenario(kt CO 2 ) DPDC-Scenario (kt CO 2 ) 225 200 175 150 125 100 75 50 25 0 kt CO 2 Mitigation (kt CO 2 ) 0 0 0 55.78 58.01 60.34 62.75 AES-Scenario(kt CO 2 ) 164.39 170.97 177.81 184.92 192.32 200.01 208.01 DPDC-Scenario (kt CO 2 ) 164.39 170.97 177.81 129.14 134.30 139.67 145.26 2012 2013 2014 2015 2016 2017 2018 Figure 8. Mitigation of CO2 emissions with alternative fossil fuel. 80.00 60.00 40.00 20.00 0.00 kt CO2 2012 2013 2014 2015 2016 2017 2018 Mitigation1 (kt CO2) 55.78 58.01 60.34 62.75 Mitigation1 (kt CO2) 0.04 0.04 0.04 1.99 1.99 1.99 1.99 Mitigation1 (kt CO2) 0.04 0.04 0.04 57.77 60.00 62.32 64.74 2012 2013 2014 2015 2016 2017 2018 Figure 9. Total mitigation of CO2 emissions. amount of CO2 emitted into the atmosphere by the DPDC, mitigation policies must be taken for all thermal power plants, preferably by considering the realities of Camer- oon. As a Non-Annex 1 party, Cameroon’s government has the right to insure favorable conditions to its devel- opment, which inevitably requires the heavily investment in the promotion of carbon reduction. Taxes on carbon are not an important point for the Cameroon ministry of environment. For Cameroon is considered as a Non- Annex 1 party and its emissions are by far lower than that of industrialized countries as well as the production of electricity by thermal power plants in all other sectors. Although there are several possible strategies to reduce the amount of CO2 emitted from fossil fuel power plants, Cameroon government suggests potential approaches that include increasing plant efficiency, employing fuel bal- ancing or fuel switching and rapid recovery of plants by complex ecology plants, for all thermal power plants in the country. The Cameroon ministry of environment sug- gests to AES-Sonel concerning thermal power plants to put in place an environmental policy in these power plants. This policy includes planting one tree per em- ployee for each AES-Sonel power plant per year. Thus, the fixation volume by plants will increase and will thus reduce the amount of CO2 emissions. 6. Conclusions Energy demand and CO2 emissions by DPDC in 2012 are estimated to be 48.964 k·toe and 164.39 kt CO2 respec- tively. From 2012 to 2018, applying AES-Scenario will emit into the atmosphere 1298.42 kt CO2. On the other hand, applying DPDC-Scenario and carbon neutral model by plants will reduce CO2 emissions by 489.91 kt CO2 for the same period. With the above discussions, it can be concluded that: 1) The study shows how the CO2 emissions of thermal power plants are estimated. 2) The study also permits DPDC to calculate CO2 emissions using national emission factors. 3) The Cameroon government can use this study to improve on the second National Communication of GHG emissions inventories to the United Nations Framework Convention on Climate Change. 4) Future environmental policies in Cameroon should deploy new technologies, alternating fuels with liquid fossil fuels and increase green areas around power plants, and consequently reduce CO2 emissions for Cameroon’s thermal power plants sector. REFERENCES [1] J. Gomes, J. Nascimento and H. Rodrigues, “Estimating Local Greenhouse Gas Emissions—A Case Study on a Open Access LCE 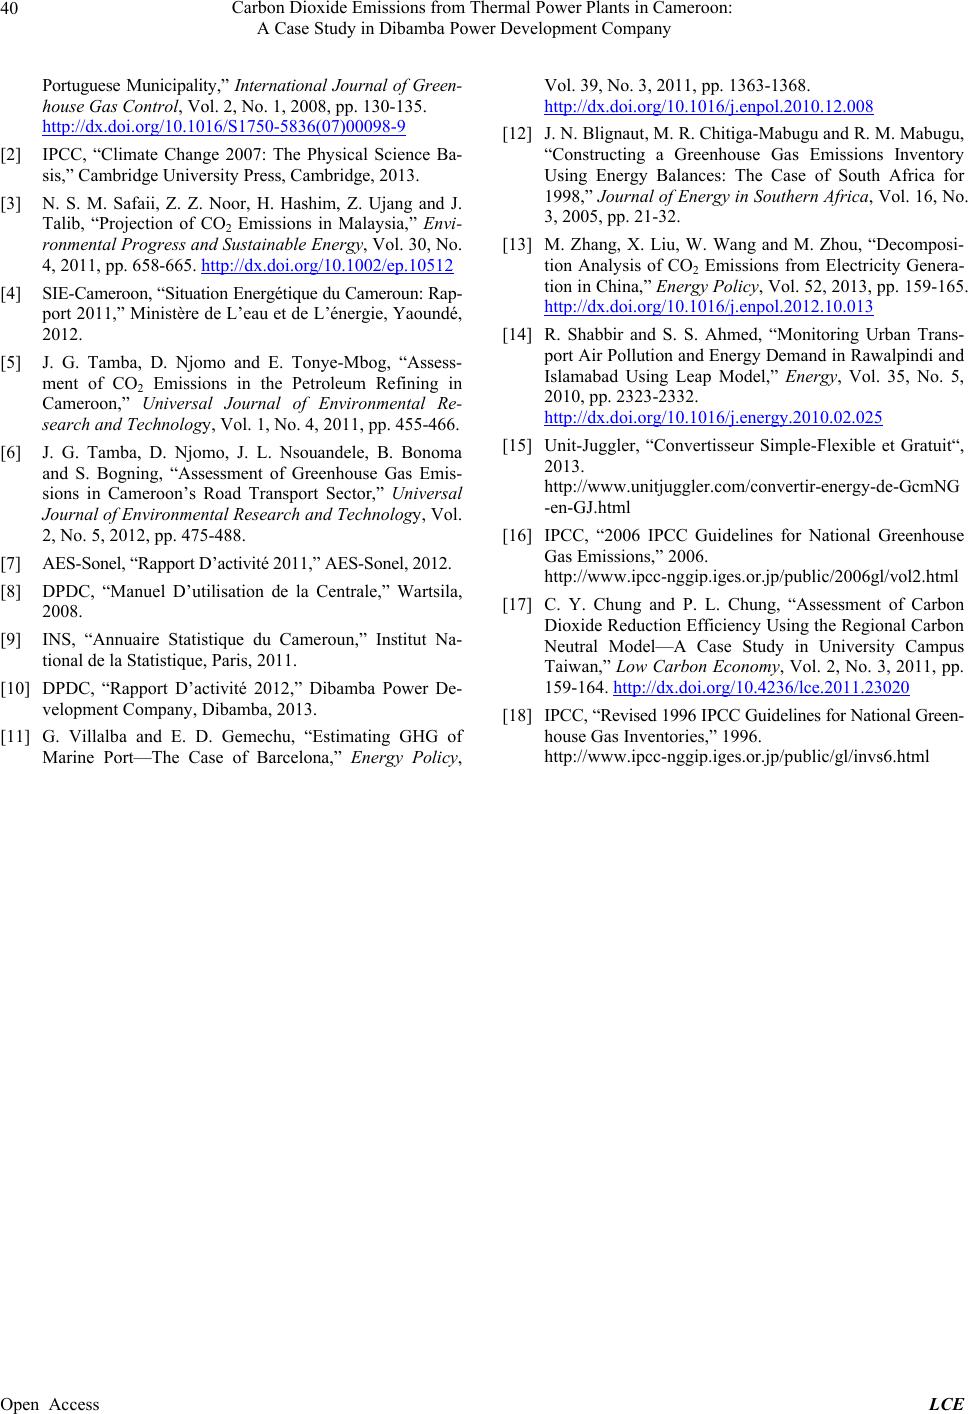 Carbon Dioxide Emissions from Thermal Power Plants in Cameroon: A Case Study in Dibamba Power Development Company Open Access LCE 40 Portuguese Municipality,” International Journal of Green- house Gas Control, Vol. 2, No. 1, 2008, pp. 130-135. http://dx.doi.org/10.1016/S1750-5836(07)00098-9 [2] IPCC, “Climate Change 2007: The Physical Science Ba- sis,” Cambridge University Press, Cambridge, 2013. [3] N. S. M. Safaii, Z. Z. Noor, H. Hashim, Z. Ujang and J. Talib, “Projection of CO2 Emissions in Malaysia,” Envi- ronmental Progress and Sustainable Energy, Vol. 30, No. 4, 2011, pp. 658-665. http://dx.doi.org/10.1002/ep.10512 [4] SIE-Cameroon, “Situation Energétique du Cameroun: Rap- port 2011,” Ministère de L’eau et de L’énergie, Yaoundé, 2012. [5] J. G. Tamba, D. Njomo and E. Tonye-Mbog, “Assess- ment of CO2 Emissions in the Petroleum Refining in Cameroon,” Universal Journal of Environmental Re- search and Technology, Vol. 1, No. 4, 2011, pp. 455-466. [6] J. G. Tamba, D. Njomo, J. L. Nsouandele, B. Bonoma and S. Bogning, “Assessment of Greenhouse Gas Emis- sions in Cameroon’s Road Transport Sector,” Universal Journal of Environmental Research and Technology, Vol. 2, No. 5, 2012, pp. 475-488. [7] AES-Sonel, “Rapport D’activité 2011,” AES-Sonel, 2012. [8] DPDC, “Manuel D’utilisation de la Centrale,” Wartsila, 2008. [9] INS, “Annuaire Statistique du Cameroun,” Institut Na- tional de la Statistique, Paris, 2011. [10] DPDC, “Rapport D’activité 2012,” Dibamba Power De- velopment Company, Dibamba, 2013. [11] G. Villalba and E. D. Gemechu, “Estimating GHG of Marine Port—The Case of Barcelona,” Energy Policy, Vol. 39, No. 3, 2011, pp. 1363-1368. http://dx.doi.org/10.1016/j.enpol.2010.12.008 [12] J. N. Blignaut, M. R. Chitiga-Mabugu and R. M. Mabugu, “Constructing a Greenhouse Gas Emissions Inventory Using Energy Balances: The Case of South Africa for 1998,” Journal of Energy in Southern Africa, Vol. 16, No. 3, 2005, pp. 21-32. [13] M. Zhang, X. Liu, W. Wang and M. Zhou, “Decomposi- tion Analysis of CO2 Emissions from Electricity Genera- tion in China,” Energy Policy, Vol. 52, 2013, pp. 159-165. http://dx.doi.org/10.1016/j.enpol.2012.10.013 [14] R. Shabbir and S. S. Ahmed, “Monitoring Urban Trans- port Air Pollution and Energy Demand in Rawalpindi and Islamabad Using Leap Model,” Energy, Vol. 35, No. 5, 2010, pp. 2323-2332. http://dx.doi.org/10.1016/j.energy.2010.02.025 [15] Unit-Juggler, “Convertisseur Simple-Flexible et Gratuit“, 2013. http://www.unitjuggler.com/convertir-energy-de-GcmNG -en-GJ.html [16] IPCC, “2006 IPCC Guidelines for National Greenhouse Gas Emissions,” 2006. http://www.ipcc-nggip.iges.or.jp/public/2006gl/vol2.html [17] C. Y. Chung and P. L. Chung, “Assessment of Carbon Dioxide Reduction Efficiency Using the Regional Carbon Neutral Model—A Case Study in University Campus Taiwan,” Low Carbon Economy, Vol. 2, No. 3, 2011, pp. 159-164. http://dx.doi.org/10.4236/lce.2011.23020 [18] IPCC, “Revised 1996 IPCC Guidelines for National Green- house Gas Inventories,” 1996. http://www.ipcc-nggip.iges.or.jp/public/gl/invs6.html |