

Paper Menu >>
Journal Menu >>
 Vol.1, No.1, 1-3 (2013) Occupational Diseases and Environmental Medicine http://dx.doi.org/10.4236/odem.2013.11001 The complexity of occupational stress electroencephalogram Honger Tian1, Lili Cao1, Jun Wang2*, Tian Xu1, Yongguo Zhan1, Ling Liu1 1Key Laboratory of Environment Medicine and Engineering, Ministry of Education, School of Public Health, Southeast University, Nanjing, China 2Image Processing and Image Communications Key Lab, College of Geo & Bio Information, Nanjing University of Posts & Tele- comm, Nanjing, China; *Corresponding Author: [email protected] Received 18 September 2013; revised 20 October 2013; accepted 4 November 2013 Copyright © 2013 Honger Tian et al. This is an open access article distributed under the Creative Commons Attribution License, which permits unrestricted use, distribution, and reproduction in any medium, provided the original work is properly cited. In accor- dance of the Creative Commons Attribution License all Copyrights © 2013 are reserved for SCIRP and the owner of the intellectual property Honger Tian et al. All Copyright © 2013 are guarded by law and by SCIRP as a guardian. ABSTRACT It is an important method for using electroen- cephalogram (EEG) to detect and diagnose oc- cupational Stress in clinical practice. In this pa- per, the complexity analysis method based on Jensen-Shannon Divergence was used to cal- culate the complexity of occupational stress electroencephalogram from students and nurses. The study found that the complexity of nurses’ EEG was higher than that of students’ EEG. The result can be used to assisted clinical diagnosis. Keywords: Occupational Stress; Electroencephalogram; Student s; Nurses; Jensen-Shannon Divergence 1. INTRODUCTION Since Jensen-Shannon Divergence (JSD) [1] (which was used to measure the difference between the prob- ability distribution of random variables) was proposed in 1991, it was widely applied to the symbol sequence analysis and characterization [2], such as pattern recog- nition [3], DNA sequence segmentation. JSD is the result of symmetrizing and smoothing the Kullback-Leibler Divergence (KLD). The non-negativity, symmetry, con- tinuity [4,5] and boundness features of JSD have been widely used in the analysis of time series. Electroen- cephalogram (EEG) can also be seen as a time series, so we consider using JSD complexity based analysis me- thod to achieve recognition and detection of EEG. In this paper, 12 graduate students from Southeast University and 12 nurses from a third-grade class-A hospital were chosen for comparative analysis. Nurses need to withstand pressure from work, patient and family. The occupational stress can cause changes in psychology, physiology and behavior, such as anxiety, irritability, depression, chronic fatigue syndrome, sleep disorders, immune system suppression, cardiovascular system disease, aggression, and bad habits [6-9]. Gradu- ate students in universities relatively have lower occupa- tional stress than the nurses. So their EEG should have a different dynamic complexity. The Jensen-Shannon Di- vergence was used to quantitatively analyze time series. As a statistic parameter in information statistics, Jensen- Shannon Divergence described the complexity between different signals and the entropy value increased with increased complexity. 2. JENSEN-SHANNON DIVERGENCE (JSD) Proposed that 1, 2 were two probability distribu- tion of discrete random variables X. KULLBACK de- fined direct difference I as: p p 1 12 1 2 ,log xX px Ipppx px (1) It can be seen from Equation (1) that differences I has non-negativity and incremental feature, but it does not have symmetry. In order to meet this point, the form of a symmetric difference—J difference was proposed: 12 12 21 1 12 2 , ,, log xX Jpp Ipp Ipp px px pxpx (2) Distance change in the of two probability distributions can meet the metric nature. The distance change was Copyright © 2013 SciRes. OPEN A CCESS  H. E. Tian et al. / Occupational Diseases and Environmental Medicine 1 (2013) 1-3 2 defined as follows: 121 2 , xX Vpppxp x (3) For the relationship between the direct differences I and distance changes V, it was found the minimum value of the differences I based on the V: 12112 212 ,max,, ,IppLVpp LVpp (4) where, 112 12 12 12 12 12 , 2,2, log, 0,2 2,2, LVpp Vpp VppVpp Vpp Vpp (5) 24 12 12 212 6 12 12 ,, ,236 ,,0, 2 288 Vpp Vpp LVpp Vpp Vpp (6) But there are not a general representation of the max- imum value for direct differences I and differences J based on V. So there exists some limitations when meas- uring the difference between the probability distribution. For generally descripting the maximum limit of the difference, papers [1,9] gave the amended definition of I and J: 1 12 1 12 11 2 ,log 11 22 11 ,22 xX px Kpppx px px Ip pp (7) The corresponding symmetrical form difference was as follows: 1212 21 ,,LppKppKp p , (8) It can be seen from Equation (8) that, the difference between K and L was not only meeting the non-negativ- ity but also having limitation and semi-bounded. That is: 1212 11 1212 11 ,,, , ,,, , K ppKpp Kpp LppLpp Lpp (9) 12 121 2 ,2 2 pp LppHHpHp (10) Now setting 1 and 2 were the weight of two probability distributions, and meeting 121 2 ,0, 1 , Jensen-Shannon Divergence (JSD) was defined as: 1211221122 , J SppH ppHpHp (11) where 1 ln N j j j H Ppp is Shannon Entropy. For more than two but a limited number of probability distributions , the corresponding weight were 12 ,,, n pp p ..., n12 , , respectively, JSD was defined as: 12 11 ,,, nn niii ii i J SpppHpHp (12) 3. DATA ANALYSIS The EEG data we used were taken from 12 students and 12 nurses. The sampling frequency was 200 Hz. We used JSD to analyze the complexity of the EEG data of 12 students and 12 nurses and the corresponding results were shown in Table 1. According to Table 1, we can plot the complexity measures of three ECG signals and twelve were shown in Figure 1. It can be seen from the Figure 1 that, the Jensen- Shannon Divergence value of students is less than that of nurses. The T test value of the two groups was equal to 4.414 which confidence probability is 0.001. It indicated that high level of occupational stress had a higher Jensen- Shannon Divergence value than low level, and EEG should be more complex. So students and nurses can be statistically distinguished. 4. CONCLUSION In this paper, the complexity analysis method based on Jensen-Shannon Divergence was used to calculate the complexity of occupational stress electroencephalogram Table 1. Complexity measures of twelve ECG signals (2000 points). Subjects Student Nurse 1 0.2163 0.2215 2 0.2175 0.2787 3 0.0599 0.2813 4 0.2092 0.2403 5 0.1929 0.2659 6 0.0694 0.2793 7 0.2171 0.2727 8 0.2358 0.2809 9 0.0692 0.2714 10 0.2145 0.2707 11 0.2055 0.2798 12 0.0621 0.2743 mean ± STD 0.1641 ± 0.0738 0.2681 ± 0.0184 Copyright © 2013 SciRes. OPEN A CCESS 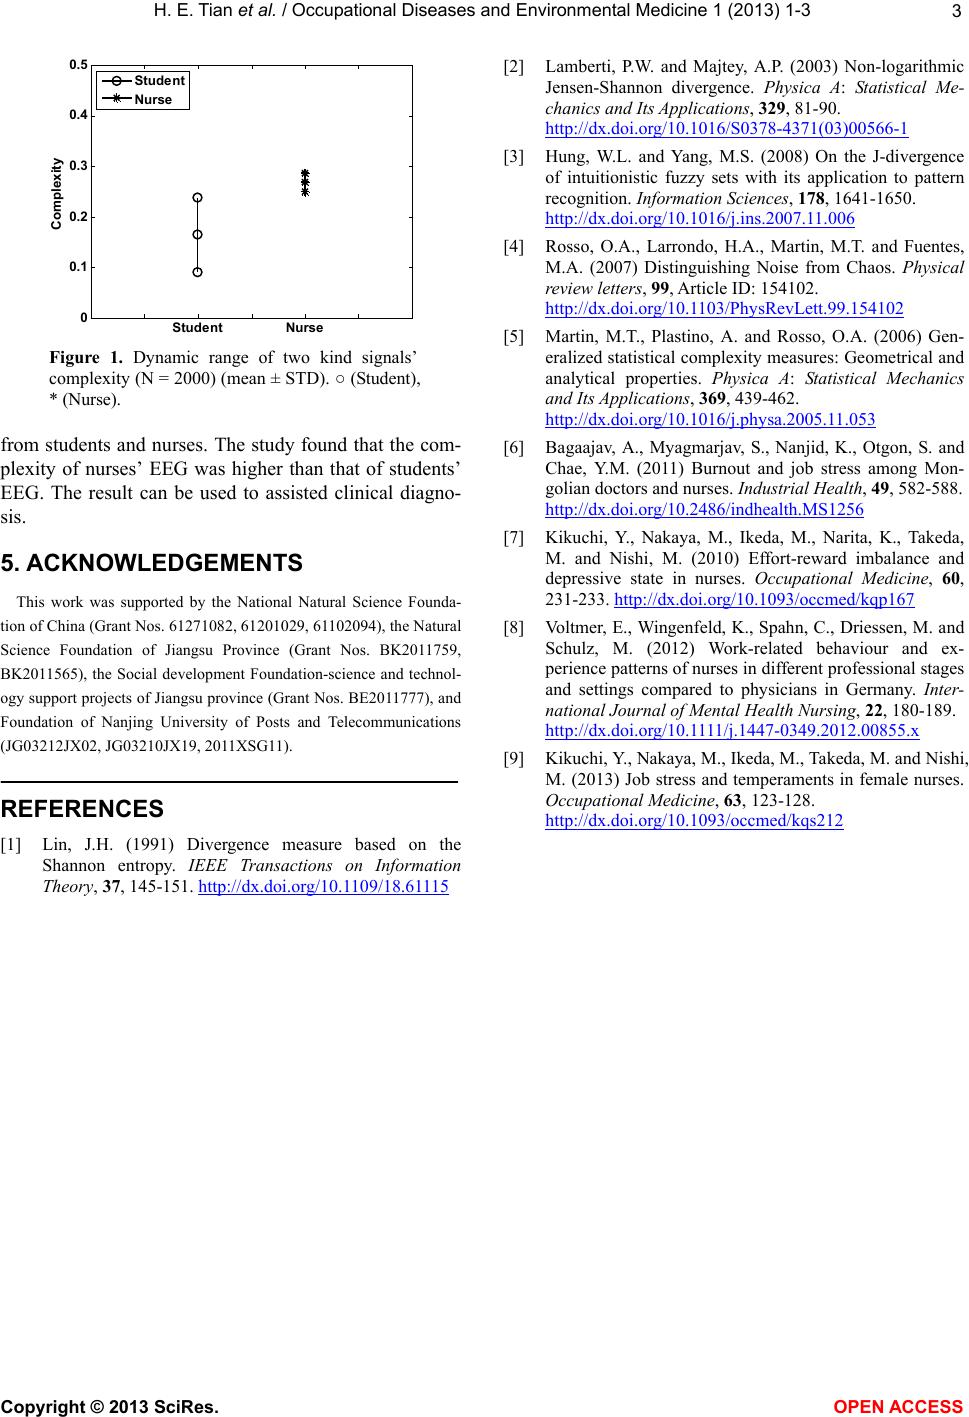 H. E. Tian et al. / Occupational Diseases and Environmental Medicine 1 (2013) 1-3 Copyright © 2013 SciRes. 3 [2] Lamberti, P .W. and Majtey, A.P. (2003) Non-logarithmic Jensen-Shannon divergence. Physica A: Statistical Me- chanics and Its Applications, 329, 81-90. http://dx.doi.org/10.1016/S0378-4371(03)00566-1 Student Nurse 0 0.1 0.2 0.3 0.4 0.5 Complexity Student Nurse [3] Hung, W.L. and Yang, M.S. (2008) On the J-divergence of intuitionistic fuzzy sets with its application to pattern recognition. Information Sciences, 178, 1641-1650. http://dx.doi.org/10.1016/j.ins.2007.11.006 [4] Rosso, O.A., Larrondo, H.A., Martin, M.T. and Fuentes, M.A. (2007) Distinguishing Noise from Chaos. Physical review letters, 99, Article ID: 154102. http://dx.doi.org/10.1103/PhysRevLett.99.154102 [5] Martin, M.T., Plastino, A. and Rosso, O.A. (2006) Gen- eralized statistical complexity measures: Geometrical and analytical properties. Physica A: Statistical Mechanics and Its Applications, 369, 439-462. http://dx.doi.org/10.1016/j.physa.2005.11.053 Figure 1. Dynamic range of two kind signals’ complexity (N = 2000) (mean ± STD). ○ (Student), * (Nurse). from students and nurses. The study found that the com- plexity of nurses’ EEG was higher than that of students’ EEG. The result can be used to assisted clinical diagno- sis. [6] Bagaajav, A., Myagmarjav, S., Nanjid, K., Otgon, S. and Chae, Y.M. (2011) Burnout and job stress among Mon- golian doctors and nurses. Industrial Health, 49, 582-588. http://dx.doi.org/10.2486/indhealth.MS1256 [7] Kikuchi, Y., Nakaya, M., Ikeda, M., Narita, K., Takeda, M. and Nishi, M. (2010) Effort-reward imbalance and depressive state in nurses. Occupational Medicine, 60, 231-233. http://dx.doi.org/10.1093/occmed/kqp167 5. ACKNOWLEDGEMENTS This work was supported by the National Natural Science Founda- tion of China (Grant Nos. 61271082, 61201029, 61102094), the Natural Science Foundation of Jiangsu Province (Grant Nos. BK2011759, BK2011565), the Social development Foundation-science and technol- ogy support projects of Jiangsu province (Grant Nos. BE2011777), and Foundation of Nanjing University of Posts and Telecommunications (JG03212JX02, JG03210JX19, 2011XSG11). [8] V oltmer, E., Wingenfeld, K., Spahn, C., Driessen, M. and Schulz, M. (2012) Work-related behaviour and ex- perience patterns of nurses in different professional stages and settings compared to physicians in Germany. Inter- national Journal of Mental Health Nursing, 22, 180-189. http://dx.doi.org/10.1111/j.1447-0349.2012.00855.x [9] Kikuchi, Y., Nakaya, M., Ikeda, M., Takeda, M. and Nishi, M. (2013) Job stress and temperaments in female nurses. Occupational Medicine, 63, 123-128. http://dx.doi.org/10.1093/occmed/kqs212 REFERENCES [1] Lin, J.H. (1991) Divergence measure based on the Shannon entropy. IEEE Transactions on Information Theory, 37, 145-151. http://dx.doi.org/10.1109/18.61115 OPEN ACC ESS |