

Paper Menu >>
Journal Menu >>
 Journal of Computer and Communications, 2013, 1, 46-49 Published Online December 2013 (http://www.scirp.org/journal/jcc) http://dx.doi.org/10.4236/jcc.2013.17011 Open Access JCC The Study of Relaxation Time in Test of 940 nm Semiconductor Laser* Jiachun Li, Jianjun Li, Tao Liu, Bifeng Cui, Jun Deng, Jun Han, Linjie He, Shengjie Lin Key Laboratory of Opto-Electronics Technology, Beijing University of Technology, Beijing, China. Email: [email protected] Received September 2013 ABSTRACT Conventional test of the peak wavelength of a laser used to be applied immediately after a device is injected current. However, the results can not be considered as an accurate description to temperature characteristic. This passage puts forward a concept of relaxation time in wavelength texts, mainly based on the experiment of 940 nm strain quantum well laser, confirming that under constant current, wavelength will get through a process of rising, and then, reach the limit. This process brings th e effect on sp ectral characteristics of a d evice which cannot be ignored and the accumulated heat in relaxation time will gradually impact the emission wavelength of the laser, even crest split to form bimodal phe- nomenon. Keywords: Semiconductor Laser; Test; Temperature Characteristics; Relaxation Time 1. Introduction With the development of fiber-optical technology, the fiber pump sources manufacture has been the critical te- chnology to improve the signal transmission efficiency. The strongest absorption peak of Yb-doped optical fiber is around 976 nm [1]. However, the absorption peak is sharp; as a result, the requirements of wavelength and bandwidth ar e very strict, which makes it suitable for the application of pulse signal. While the absorption peak near 940 nm has high absorption bandwidth, it will not appear concentration quenching phenomenon, which is beneficial to the application of continuous signal. As a consequence, the research of laser pump sources used by 940 nm semiconductor laser with reliable and stable high power output has a gr e a t signifi c a nc e . In fact, output power of laser is constantly improving, and the problem of heating effect becomes more serious. The quantity of heat produced by a working laser makes the temperature of active layers rise sharply, which re- sults in the wavelength red shift and the cavity surface or interior to burn down [2]. So it is an important issue to study the temperature character of the device. Nowadays, the study on testing the heat character of the device by controlling the heat or changing its current is major. But it is rare to study the effect on the device itself made by the heat which is accumulating with time and produced by the device when it works under constant current. This paper will study and analyze this effect, and makes it clear that the influence on the spectral characteristic of a device. Moreover, we put forward a concept of relaxation time that wavelength could test after it, which can esti- mate a device’s spectral character more accurately. 2. Put Forward the Inference In conventional test of semiconductor laser, the test is used to be applied immediately after a device is injected current. However, in practical applications, the device often works under constant current conditions, Understanding the effect on wavelength characteristics by the device’s heat accumulation over time will help to accurately as- sess the thermal properties. Wavelength change is due to heating of the device causing the band gap widens, thereby causing the de- crease of photon energy, and the increase of wavelength. Heating of a device operates primarily from the P-clad- ding layer, P-cladding layer is heavily doped, the resis- tance rate is high, the device generates a lot of heat while continue to work. In certain process conditions, the vo- lume resistivity will generate heat in a certain range, with certain cooling capacity of the package, we predicted that if a device work under a certain current conditions, after some time, heating degree will reach a state of equili- brium. As a response, the temperature and wavelength of the device will reach a state of dynamic equilibrium the * Supported by the advanced technology fund of Beijing University of Technology, No.002000514312003. 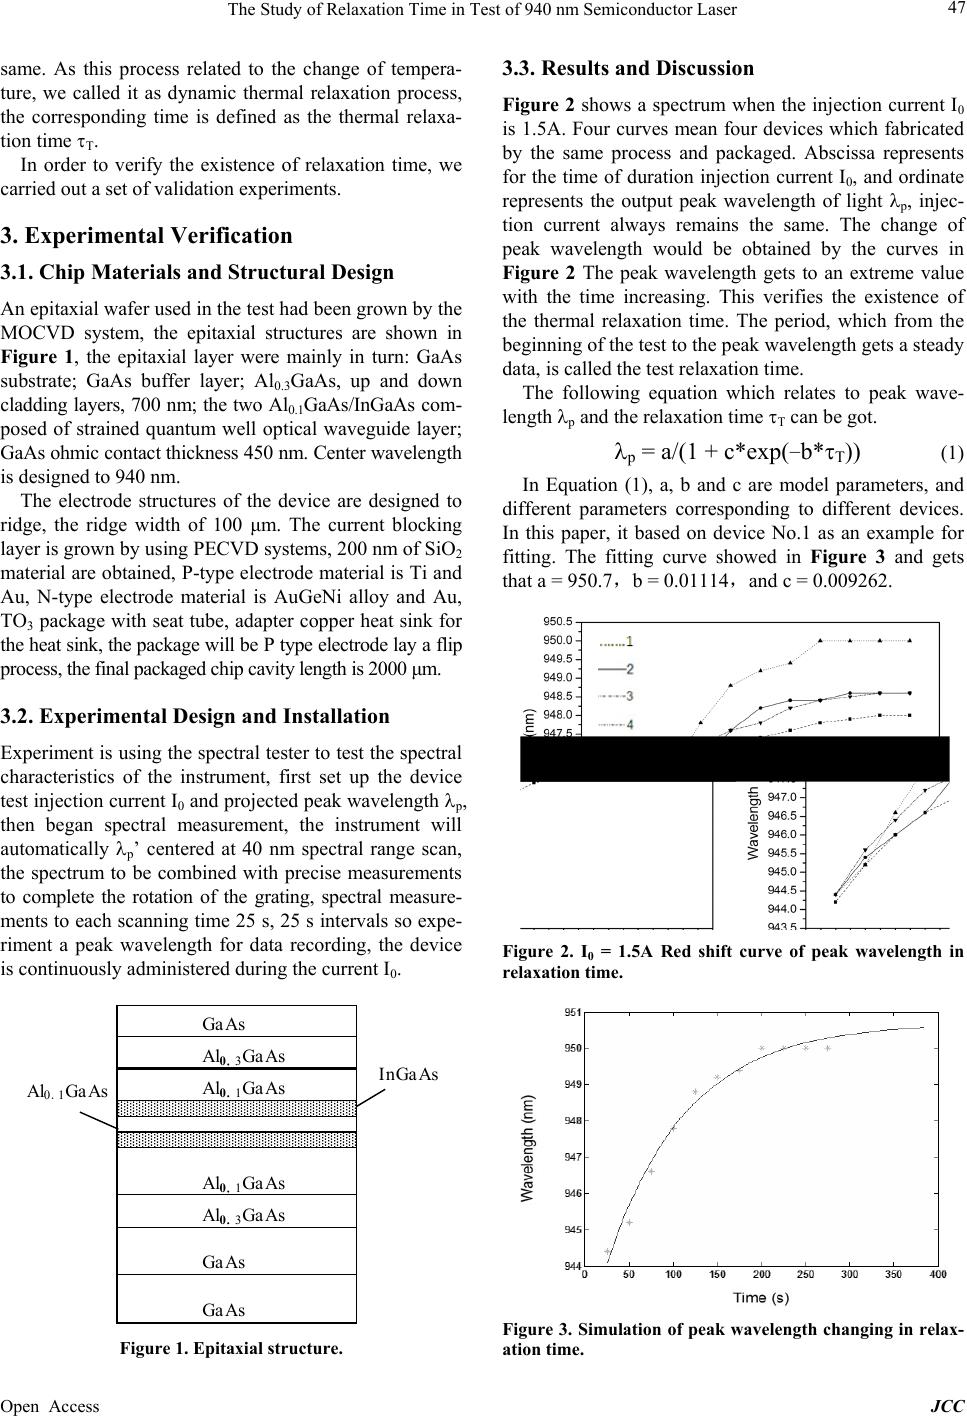 The Study of Relaxation Time in Test of 940 nm Semiconductor Laser Open Access JCC 47 same. As this process related to the change of tempera- ture, we called it as dynamic thermal relaxation process, the corresponding time is defined as the thermal relaxa- tion time τT. In order to verify the existence of relaxation time, we carried out a set of validation experiments. 3. Experimental Verification 3.1. Chip Materials and St ructural Design An epitaxial wafer used in the test had been grown b y the MOCVD system, the epitaxial structures are shown in Figure 1, the epitaxial layer were mainly in turn: GaAs substrate; GaAs buffer layer; Al0.3GaAs, up and down cladding layers, 700 nm; the two Al0.1GaAs/InGaAs com- posed of strained quantum well optical waveguide layer; GaAs ohmic contact thickness 450 nm. Center wavelength is designed to 940 nm. The electrode structures of the device are designed to ridge, the ridge width of 100 μm. The current blocking layer is grown by using PECVD systems, 200 nm of SiO2 material are obtained, P-type electrode material is Ti an d Au, N-type electrode material is AuGeNi alloy and Au, TO3 package with seat tube, adapter copper heat sink for the heat sink, the package will be P type electrode lay a flip process, the final packaged chip cavity length is 2000 μm. 3.2. Experimental Design and Installation Experiment is using the spectral tester to test the spectral characteristics of the instrument, first set up the device test injection current I0 and projected peak wavelength λp, then began spectral measurement, the instrument will automatically λp’ centered at 40 nm spectral range scan, the spectrum to be combined with precise measurements to complete the rotation of the grating, spectral measure- ments to each scanning time 25 s, 25 s intervals so expe- riment a peak wavelength for data recording, the device is continuously administered during the current I0. Figure 1. Epitaxial structure. 3.3. Results and Discussion Figure 2 shows a spectrum when the injection current I0 is 1.5A. Four curves mean four devices which fabricated by the same process and packaged. Abscissa represents for the time of duration injection current I0, and ordinate represents the output peak wavelength of light λp, injec- tion current always remains the same. The change of peak wavelength would be obtained by the curves in Figure 2 The peak wavelength gets to an extreme value with the time increasing. This verifies the existence of the thermal relaxation time. The period, which from the beginning of the test to the peak wavelength gets a steady data, is called the test relaxation time. The following equation which relates to peak wave- length λp and the relaxation time τT can be got. λp = a/(1 + c*exp(−b*τT)) (1) In Equation (1), a, b and c are model parameters, and different parameters corresponding to different devices. In this paper, it based on device No.1 as an example for fitting. The fitting curve showed in Figure 3 and gets that a = 950.7,b = 0.01114,and c = 0.009262. Figure 2. I0 = 1.5A Red shift curve of peak wavelength in relaxation time. Figure 3. Simulation of peak wavelength changing in relax- ation time. Al0.1GaAs Al0.1GaAs GaAs Al0.3GaAs GaAs Al0.1GaAs GaAs Al0.3GaAs InGaAs 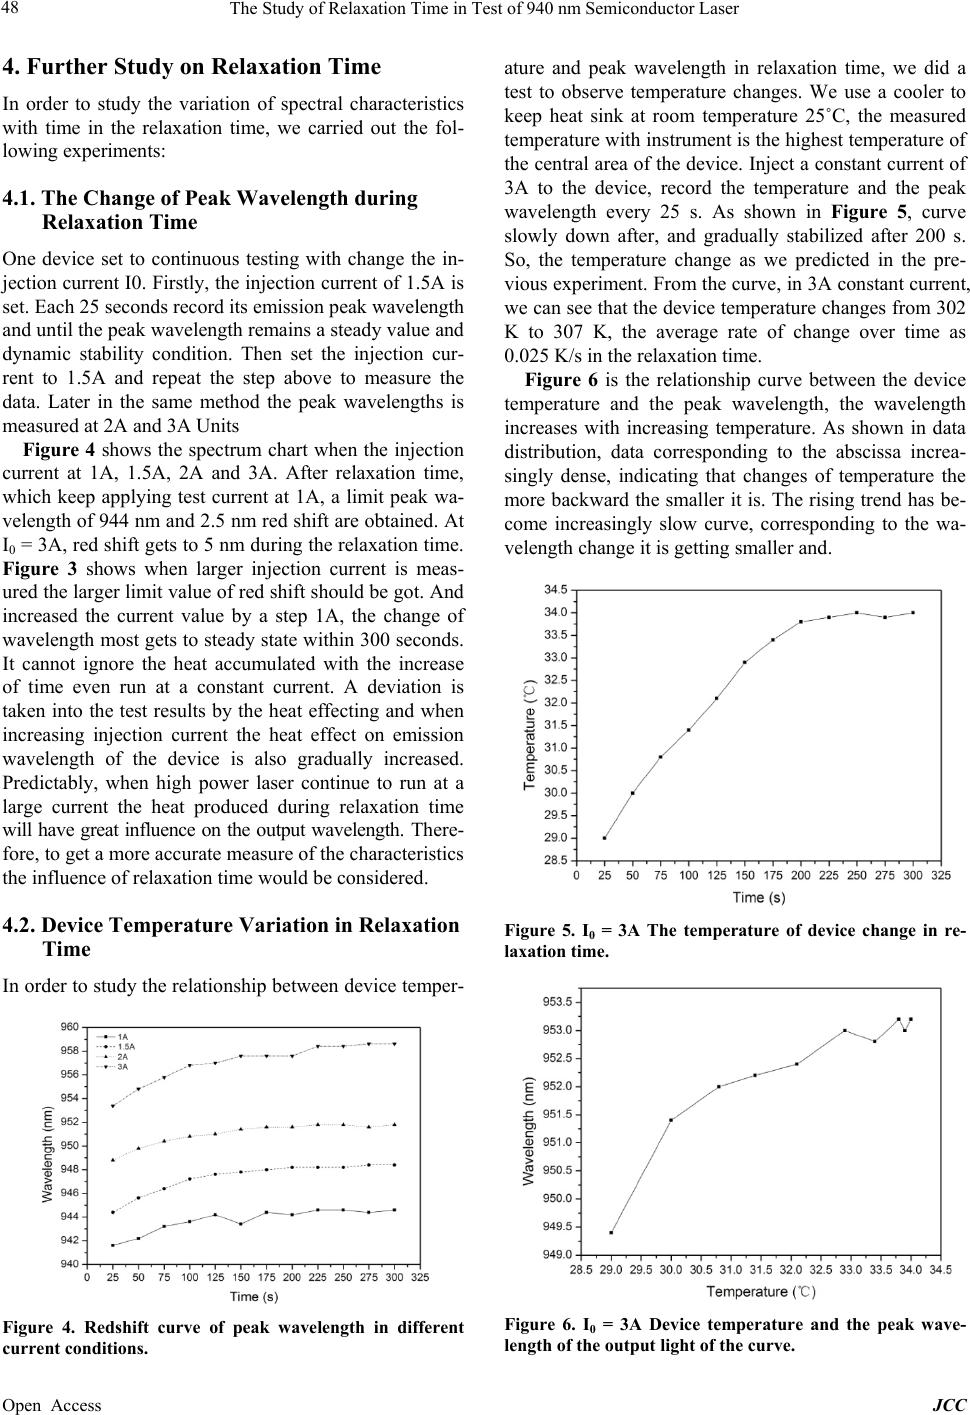 The Study of Relaxation Time in Test of 940 nm Semiconductor Laser Open Access JCC 48 4. Further Study on Relaxation Time In order to study the variation of spectral characteristics with time in the relaxation time, we carried out the fol- lowing experiments: 4.1. The Change of Peak Wavelength during Relaxation Time One device set to continuous testing with change the in- jection current I0. Firstly, the inj ection current of 1.5A is set. Each 25 seconds record its emission peak wavelength and until the peak wavelength remains a steady value and dynamic stability condition. Then set the injection cur- rent to 1.5A and repeat the step above to measure the data. Later in the same method the peak wavelengths is measured at 2A and 3A Units Figure 4 shows the spectrum chart when the injection current at 1A, 1.5A, 2A and 3A. After relaxation time, which keep applying test current at 1A, a limit peak wa- velength of 944 nm and 2.5 nm red shift are obtained. At I0 = 3A, red s hift gets to 5 nm during the relaxation time. Figure 3 shows when larger injection current is meas- ured the larger limit value of red shift should be got. And increased the current value by a step 1A, the change of wavelength most gets to steady state within 300 seconds. It cannot ignore the heat accumulated with the increase of time even run at a constant current. A deviation is taken into the test results by the heat effecting and when increasing injection current the heat effect on emission wavelength of the device is also gradually increased. Predictably, when high power laser continue to run at a large current the heat produced during relaxation time will have great influence on the output wavelength. There- fore, to get a more accurate measure of the characteristics the influence of relaxation time would be considered. 4.2. Device Temperature Varia tion in Relaxation Time In order to study the relationship between device temper- Figure 4. Redshift curve of peak wavelength in different current conditions. ature and peak wavelength in relaxation time, we did a test to observe temperature changes. We use a cooler to keep heat sink at room temperature 25˚C, the measured temperature with instrument is the highest temperature of the central area of the device. Inject a constant current of 3A to the device, record the temperature and the peak wavelength every 25 s. As shown in Figure 5, curve slowly down after, and gradually stabilized after 200 s. So, the temperature change as we predicted in the pre- vious experiment. From the curve, in 3A constant current, we can see that the device temperature changes from 302 K to 307 K, the average rate of change over time as 0.025 K/s in the relaxation time. Figure 6 is the relationship curve between the device temperature and the peak wavelength, the wavelength increases with increasing temperature. As shown in data distribution, data corresponding to the abscissa increa- singly dense, indicating that changes of temperature the more backward the smaller it is. The rising trend has be- come increasingly slow curve, corresponding to the wa- velength change it is getting smaller and. Figure 5. I0 = 3A The temperature of device change in re- laxation time. Figure 6. I0 = 3A Device temperature and the peak wave- length of the output light of the curve.  The Study of Relaxation Time in Test of 940 nm Semiconductor Laser Open Access JCC 49 5. Summary Through the test of the wavelength of 940 nm strain quantum well laser under the constant current, the rise of temperature and the temperature will reach the limit. With the constant current increased, the limit value will be greater. At room temperature, under 3A continuous current condition, the peak wavelength of the laser will reach steady state after 300 s. Compared with the imme- diately measured data, the wavelength has increased by 4 nm and the temperature increased by 5˚C. And as the current increases, the accumulated heat in relaxation time will gradually impact the emission wavelength of the laser, even crest split to form bimodal phenomenon. Un- der the constant current, in order to get a well output spectral characteristics, the accumulated heat in relaxa- tion time must be considered. Selecting suitable operat- ing current should be based on the device performance after the relaxation time. REFERENCES [1] R. Pathak, J. M ine lly , J. Haapamaa, J. Watson, D. Schleu- ning, H. Winhold, et al., “915 nm Laser Bar-Based High- Performance Sources for Fiber Laser Pumping,” 2009, Article ID: 719808 [2] X. Z. Ma, J. Huo, Y. Qu and S. L. Du, “8 Temperature Characteristics of 808 nm Semiconductor Lasers,” Infra- red and Laser Engineering, Vol. 12, 2010, pp. 1306- 1309. [3] G. R. He, W. J. Shen, Q. Wang, W. H. Zheng and L. H. Chen, “Temperature Characteristics of 980 nm High Pow- er Vertical Ca vity Surface Emi tting Lasers,” Infrared and Laser Engineering, Vol. 1, 2010, pp. 57-60. [4] H. W. Qu, X. Guo, L. M. Dong, J. Deng, X. L. Da, Z. T. Xu and G. D. Shen, “St udy on the Temperature Characte- ristics of Vertical Cavity Surface Emitting Laser,” Infra- red and Laser Engineering, Vol. 2, 2005, pp. 83-86. |