

Paper Menu >>
Journal Menu >>
 Journal of Geoscience and Environment Protection 2013. Vol.1, No.3, 7-11 Published Online December 2013 in SciRes (http://www.scirp.org/journal/gep) http://dx.doi.org/10.4236/gep.2013.13002 Open Access 7 Seismic Hazard Assessment for Tabuk City, NW Saudi Arabia Ziyad I. Al-Besher King Abdul-Aziz City for Science and Technology, Riyadh, Saudi Arabia Email: [email protected] Received August 2013 Tabuk city is located within the Red Sea and Gulf of Aqaba active tectonic environment where it has ex- perienced considerable earthquakes in the historical and instrumental period. Recently, Tabuk city is ex- pected to become one of the future economic communities in Saudi Arabia. Accordingly, assessment of seismic hazard of Tabuk city plays an important role to minimize earthquake damage and to anticipate the future safe development for the strategic projects. For this purposes, earthquake data were collected from local and regional data centers to construct earthquake catalogue. The earthquake source zones that affect Tabuk city, maximum magnitude and closest distance have been identified. The stochastic approach has been applied through this study for seismic hazard assessment in terms of peak ground acceleration and the response spectra. The results illustrated that, the maximum peak ground acceleration resulted from Tabuk source zone with moment magnitude (Mw) of 7.5. The calculated peak ground acceleration of 218 cm/sec2 at distance of 10 Km for Tabuk City at the bedrock. The response spectra of Pseudo-Spectral Acceleration (PSA) have been calculated at 5% of the critical damping with a value of 470 cm/sec2 at 10 Km distance. The results of the present study are highly recommended to improve Saudi Building Code (SBC) for earthquake resistant design in Tabuk city. Keywords: Tabuk Cit y; Seismicity; Seismic Hazard Assessment; Response Spectra Introduction Tabuk City lies in the northwestern part of Kingdom of Sau- di Arabia between latitudes of 27.50˚ - 28.50˚N, and longitudes of 36.00˚ - 37.00˚E (Figure 1). This city includes many resi- dential buildings in the rural villages and urban zones. In addi- tion the area is characterized by fast grow in the infrastructures and great developmental projects. The last major quake re- ported in the region was in 1995, which caused some damage in Tabuk region. A sequence of earthquakes struck Tabuk city in June 2004, approximately 60 km southeast of Tabuk City. The largest event (ML = 5.2) occurred on June 22. Although the region is sparsely populated, the event was widely felt in Tabuk city and its surroundings (Al-Damegh et al., 2009). The 2004 Tabuk earthquake sequence generated a lot of concern for the earthquake hazard in this area because the region has been gen- erally considered aseismic. Because there are no previously studies to assess the seismic hazard of Tabuk city, despite its location in an active tectonic environment, the assessment of seismic hazard represents an important and necessary issue. Tectonic Setting The Tabuk is an area located in the northwestern part of the Arabian Plate. This Plate is surrounded by three tectonic re- gimes; divergent, convergent, and transform. The divergent boundaries in the west and south represent the recent spreading along the Red Sea and the Gulf of Aden respectively. The ac- tive convergent margin lies to the northeast in the Turkish- Iranian Plateau, where continental collision has given rise to this Plateau. A major continental strike-slip fault zone bounds the plate in the northwest. This is the Dead Sea Transform fault which runs from the Gulf of Aqaba through the Dead Sea and Syria into southern Turkey. A second transform boundary exists to the southeast (offshore of Oman) in the intra-oceanic Owen Fracture Zone. This boundary with the Indian Plate is the oldest and least ac- tive tectonic margin of the Arabian Plate. The tectonic pattern of the region is inherited from the base- ment tectonics of ancient Nubian-Arabian shield, which re- ceived its main structural imprint during the late Precambrian orogenies. The most important among the tectonic features is the northwest-southeast striking faults (parallel to the Red Sea), the Gulf of Suez rift, the Najd faults system, the Aqaba fault line, and northeast-southwest and east-west trending pattern. The geology and tectonics of western Saudi Arabia is dominat- ed by the Arabian Shield, the Red Sea, and the Gulf of Aden in the west-southwest. Since the start of rifting, the Arabian plate moved northeast- ward from Egypt and Sudan, northward from Somalia, and rotated counterclockwise about a point in the vicinity of the Gulf of Suez. Such movement is accommodated by compres- sion and strike-slip faulting along the Bitlis and Zagros belts, where the Arabian plate is undergoing a subduction beneath the Eurasian plate, and by strike-slip displacement along the Dead Sea transform fault. At present, the northern part of the Arabian plate moves northwestward with respect to the Eurasian plate at a rate of 20 ± 3 mm/yr. Seismicity of t he Study Area According to Ambraseys et al. (1994), Tabuk was affected  Z. I. AL-BESHER Open Access 8 Figure 1. Location map of the study area. by some historical strong earthquakes (Figure 2) as follows; March 18 1068; January 4 1588; December 26 1906 and Feb- ruary 26 1909. The collected catalogue includes different mag- nitude scales but surface wave and body wave magnitudes are the common. For the homogeneity of the catalogue, all these scales were converted into Moment magnitude (the most relia- ble) based on Harvard CMT catalogue. The Spatial distribution of the instrumental seismicity (1906 till 2012) is plotted in Figure 3. Declustering attempts have been made to separate the time independent part of seismicity from time-dependent or clus- tered seismicity. Furthermore, the aftershocks and the fore- shocks have been removed from earthquake catalogue using Gardner and Knopoff (1974) approach. Depending on the integration between geological, geophysi- cal and seismological data the earthquake source zones have been identified. Seismicity within these sources is assumed to be uniform in terms of distribution and type of earthquakes. It is therefore, assumed that seismic activity from source can be characterized by a single earthquake generating process. It is also assumed that earthquakes have equal probability of occur- ring at any point within the seismic zone. Accordingly, the main affected zones for Tabuk city are shown in Figure 4 as follows; 1) Tabuk Zone; 2) Northern Red Sea Zone and 3) Gulf of Aqaba Zone. The maximum expected earthquake for each source zone has been calculated (Table 1). This earthquake used sometimes in place of maximum credible (Reiter, 1991). Another kind is the maximum historic earthquake, which often defines the lower bounds of the maximum credible events. Ground Motion Simulation For the assessment of sei smic hazard in terms of acceleration and response spectra, a stochastic technique proposed by Boore (2003) is used. The prediction of ground-motion or response amplitude as a function of earthquake magnitude and distance is of fundamental importance for the assessment of seismic hazard. The attenuation relations are usually developed empiri- cally by regression analysis of the observed ground-motion parameters, most likely the peak horizontal acceleration. Lack of acceleration database necessitated the development of pre- Figure 2. Spatial distribution of the historical earthquakes (827-1906). Figure 3. Spatial distribution of the earthquakes. Figure 4. Seismotectonic source zones affecting Tabuk area. diction equations using stochastic methods in conjunction with a theoretical source model. The purpose of this study is to simulate the peak ground ac- celeration (PGA) expected at Tabuk City and the response spectra at 1%, 3%, 5% and 10% damped pseudo-acceleration.  Z. I. AL-BESHER Open Access 9 Table 1. Seismicity parameters for all of the identified seismic sources. Zone Mmax (obs) Mmax Tabuk 7.0 7.0* Northern Red Sea 6.9 7.56 Gulf of Aqaba 7.3 7.8 where M(obs): Maximum observed magnitude; Mmax: Maximum expected Magni- tude; *M(obs) plus .5 magnitu de un i ts. A version 2.0 FORTRAN program from boore (2003) has been used for simulating earthquake ground-motion in the study area. The application of the stochastic simulation method requires the spectral shape as a function of the earthquake size. Boore (2003) breaks the total spectrum of the horizontal motion at a site (Y (Mo, R, f)) into contributions from earthquake source (E), path (P), site (G) and the instrument or type motion (I), so that: Y (Mo, R, f) = E (Mo, f) P(R, f) G (f) I (f) (1) By separating the spectrum of ground-motion into source, path and Site components, the models based on the stochastic method can be easily modified to account for specific situations or for improved information about particular aspects of the model. The Source (E (Mo, f)) The shape and amplitude of the source spectrum part in “Equation (1)” must be specified as a function of the earth- quake size. The most commonly used model for the earthquake source spectrum is the ω-square model. In this model, scaling of the spectra from one magnitude to another is determined by specifying the dependence of the corner frequency (ƒo) on seismic moment. Although, the ω-square model is widely used, in practice a variety of other models through stochastic method are also in use. Aki (1967) recognized that assuming a similari- ty in the earthquake source implies that: 00constant Mf = (2) where the constant can be related to the stress drop (∆σ). Fol- lowing Brune (1970; 1971), the corner frequency is given by the following equation: ( ) 1/3 6 00 4.9 10| s fM βσ =×∆ (3) where, ƒo is in Hz, β s (the shear-wave velocity in the vicinity of the source) in km/s, ∆σ in bars, and Mo in dyne . c m . The source spectra for all the models are given by the fol- lowing equation: 0 00 ((),)E MCM SMf= (4) where C is a constant given by: 3 θφss o C(R).V. F(4prbR)= (5) where Rθϕ is the radiation pattern, usually averaged over a suitable range of azimuths and take-off angles, V represents a reduction factor that accounts for the partitioning of energy into two horizontal components, F is the amplification due to free surface, ρs and βs are the density and shear-wave velocity in the vicinity of the source, and Ro is a reference distance, usually set equal to 1 km. In equation 4.4, the parameter Mo is the seismic moment. In general, the moment magnitude is used rather than seismic moment as a more familiar measure of the earthquake size. The S (Mo,f) in equation 5.4 is the displacement source spectrum. Using the “Equation (5)”, an average radiation pattern for S-wave is taken as Rθϕ = 0.55 (Boore & Boatwright, 1984) for all zones. These parameters are related to the source vicinity. Hussein et al. (1998) determined the stress drop (∆σ) in bar for the maximum earthquake occurred on November 11, 1995 in Aqaba zone. In other zones the standard values of (∆σ = 30 bar) are used. This value is taken because a significant stress drop for large earthquakes is about 30 bar. The Path (P(R, f), Duration) The effects of the path are represented by simple functions that account for geometrical spreading, attenuation (combining intrinsic and scattering attenuation) and the general increase of duration with distance due to the propagation and scattering. The path P(R, f) in “Equation (1)” is given by the following: ( ) expP(R,f /) () CQ ZRfRQ f π −= (6) where CQ is the seismic velocity used in the determination of Q(f), and the geometrical spreading Z(R) is given by a piece- wise continuous series of straight lines, as follow: ( )() ( ) 01 1 1 12 PI Pn n nn RRR R R ZRZRRR R R R ZRR R R ≤ = ≤≤ ≤ (7) where R is usually taken as the closest distance to the rupture surface rather than the hypocentral distance. The ground-motion duration (Tgm), according to Atkinson and Boore (1995), is determined as the sum of the source dura- tion (To), which is related to the inverse of a corner frequency, and a path dependent duration that accounts for dispersion bR. Atkinson (1993) computed duration for each record of 1500 events that matches the observed relationship between the peak ground velocity (PGV) and the Fourier spectrum of velocity using the random process theory equations. The computed slope (b) was found to be 0.16 for (10 ≤ R < 70 km), −0.03 for (70 ≤ R < 130 km), 0.04 for (130 < R < 1000 km) and 0.0 for < 10 km. A negative slope in the transition zone from direct wave to granite layer (Lg) phase (70 to 130 km) is due to the addi- tional energy that is injected in the time window of the signal as the “Moho bounce” rays arrive. For this study, the three segments geometrical spreading op- erator (Atkinson & Boore, 1995) is used. The R−1 geometrical spreading is assumed for a distance less than 70 km, R0.0 for a distance between 70 km and 130 km and R−0.5 for greater than 130 km distances. Due to the small hypocentral distance of Tabuk earthquake to the city, the effect of attenuation is very small. The Site (G(f ) ) The modifications of the ground-motion due to local site ge- ology are known as site effects. The site effects G(f) in “Equa-  Z. I. AL-BESHER Open Access 10 tion (1)” are classified into amplification A(f) and diminution D (f) as follow: ( )( )( ) FfAfDf= (8) The attenuation or diminution operator D (f) in “Equation (8)” accounts for the path independent loss of high frequency in the ground-motions, at which a very rapid decay of spectral ampli- tudes happen for f ≥ fmax. Simple multiplicative filter can ac- count for the attenuation of the high frequency motions. Two filters are in common use: the first is fmax or the high cut filter (Hanks, 1982; Boore, 1983) as given by: ( ) 1 82 max 1f Df f − =+ (9) The second is κo filter (Anderson & Hough, 1984), as given by: ( )() 0 expDf f π =− ĸ (10) where κo is the spectral decay parameter. Both these filters can be combined in any application as described by the following equation: ( )() 1 82 0 max exp1 f Dff f π − =−+ ĸ (11) Through this study, the local site effects haven’t been taken into account during the calculation of Peak Ground Accelera- tion (PGA), Peak Ground Velocity (PGV) and Peak Ground Dis- placement (PGD). Figure 5 represents a time simulated history for PGA, PGV and PGD at 10-km distance Tabuk City resulted from Tabuk zone at the bedrock. Figure 6 shows the distribution of PGA through Tabuk City. It is noticed that the simulated values of the three outputs increase eastward where the main earthquake is present. Response Spectra The response spectrum is the most important characterization of seismic ground-motion in earthquake engineering, which forms the basis for most designs. A Single Degree of Freedom (SDOF) system is a mechanical system with mass m, which provides inertia and stiffness K that provides a restoring force, whose deformation can be fully described by single coordinate (Bommer, 2000). The natural period (T) of vibration for such a SDOF system is given by the following equation: 2m TK π = (12) If a series of SDOF systems with a given level of structural damping are all subjected to an acceleration time history acting at their base, each mass will respond differently according to its natural period and as a relationship between the period and the frequency content of the ground-motion. The maximum abso- lute value of the response for each SDOF oscillator can be cal- culated and plotted against the corresponding value of period (T). The resulting plot, called a response spectrum, shows the maximum response that a SDOF system experience when sub- jected to the ground-motion represented by that particular ac- 020 40 60 80100 Time(sec) -300 -200 -100 0 100 200 Acceleration(cm/s 2 ) 020 40 6080 100 Time(sec) -40 -20 0 20 40 Velocity(cm/sec) 020 40 6080 100 Time(sec) -20 0 20 40 60 Displacement(cm) Figure 5. Time series of the si mulated PGA at dis tance 1 0-k m from Tabuk source zone. Figure 6. Distribution of PGA in Tabuk city. celerogram. The response spectrum reflects the characteristics of the earthquake that generate motion and nature of the recording site. For low levels of damping (less than 20% of critical), the vel- ocity spectra (SV) and the acceleration spectra (SA) could be estimated from the displacement spectra (SD): 2 PSVSD T π = ⋅ (13) 2 2 .2PSA SDPSVT T ππ = ⋅ = (14) 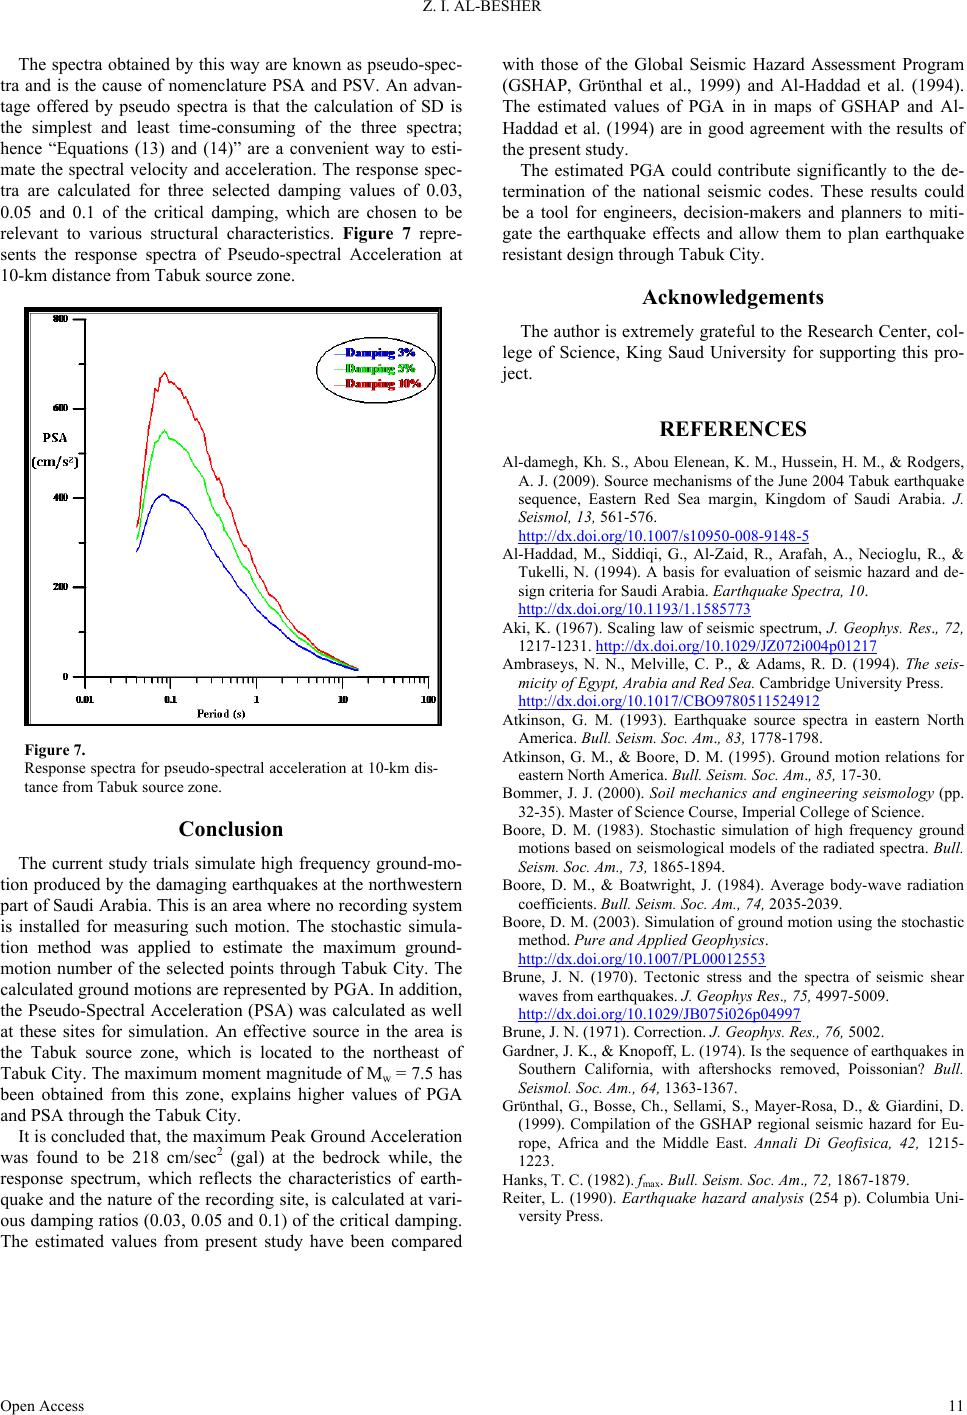 Z. I. AL-BESHER Open Access 11 The spectra obtained by this way are known as pseudo-spec- tra and is the cause of nomenclature PSA and PSV. An advan- tage offered by pseudo spectra is that the calculation of SD is the simplest and least time-consuming of the three spectra; hence “Equations (13) and (14)” are a convenient way to esti- mate the spectral velocity and acceleration. The response spec- tra are calculated for three selected damping values of 0.03, 0.05 and 0.1 of the critical damping, which are chosen to be relevant to various structural characteristics. Figure 7 repre- sents the response spectra of Pseudo-spectral Acceleration at 10-km distance from Tabuk source zone. Figure 7. Response spectra for pseudo-spectral acceler ation at 10-km di s- tance from Tabuk source zone. Conclusion The current study trials simulate high frequency ground-mo- tion produced by the damaging earthquakes at the northwestern part of Saudi Arabia. This is an area where no recording system is installed for measuring such motion. The stochastic simula- tion method was applied to estimate the maximum ground- motion number of the selected points through Tabuk City. The calculated ground motions are represented by PGA. In addition, the Pseudo-Spectral Acceleration (PSA) was calculated as well at these sites for simulation. An effective source in the area is the Tabuk source zone, which is located to the northeast of Tabuk City. The maximum moment magnitude of Mw = 7.5 ha s been obtained from this zone, explains higher values of PGA and PSA through the Tabuk City. It is concluded that, the maximum Peak Ground Acceleration was found to be 218 cm/sec2 (gal) at the bedrock while, the response spectrum, which reflects the characteristics of earth- quake and the nature of the recording site, is calculated at vari- ous damping ratios (0.03, 0.05 and 0.1) of the critical damping. The estimated values from present study have been compared with those of the Global Seismic Hazard Assessment Program (GSHAP, Grϋnthal et al., 1999) and Al-Haddad et al. (1994). The estimated values of PGA in in maps of GSHAP and Al- Haddad et al. (1994) are in good agreement with the results of the present study. The estimated PGA could contribute significantly to the de- termination of the national seismic codes. These results could be a tool for engineers, decision-makers and planners to miti- gate the earthquake effects and allow them to plan earthquake resistant design through Tabuk City. Acknowledgements The author is extremely grateful to the Research Center, col- lege of Science, King Saud University for supporting this pro- ject. REFERENCES Al-damegh, Kh. S., Abou Elenean, K. M., Hussein, H. M., & Rodgers, A. J. (2009). Source mechanisms of the June 2004 Tabuk earthquake sequence, Eastern Red Sea margin, Kingdom of Saudi Arabia. J. Seismol, 13, 561-576. http://dx.doi.org/10.1007/s10950-008-9148-5 Al-Haddad, M., Siddiqi, G., Al-Zaid, R., Arafah, A., Necioglu, R., & Tukelli, N. (1994). A basis for evaluation of seismic hazard and de- sign criteria for Saudi Arabia. Earthquake Spectra, 10. http://dx.doi.org/10.1193/1.1585773 Aki, K. (1967). Scaling law of seismic spectrum, J. Geophys. Res., 72, 1217-1231. http://dx.doi.org/10.1029/JZ072i004p01217 Ambraseys, N. N., Melville, C. P., & Adams, R. D. (1994). The seis- micity of Egypt, Arabia and Red Sea. Cambridge University Press. http://dx.doi.org/10.1017/CBO9780511524912 Atkinson, G. M. (1993). Earthquake source spectra in eastern North America. Bull. Seism. Soc. Am., 83, 1778-1798. Atkinson, G. M., & Boore, D. M. (1995). Ground motion relations for eastern North America. Bull. Seism. Soc. Am., 85, 17-30. Bommer, J. J. (2 000). Soil mechanics and engineering seismology (pp. 32-35). Master of Science Course, Imperial College of Science. Boore, D. M. (1983). Stochastic simulation of high frequency ground motions based on seis mological models of th e radiated spectra. Bull. Seism. Soc. Am., 73, 1865-1894. Boore, D. M., & Boatwright, J. (1984). Average body-wave radiation coefficients. Bull. Seism. Soc. Am., 74, 2035-2039. Boore, D. M. (2003). Simulation of ground motion using the sto chastic method. Pur e and Applied Geophys ics. http://dx.doi.org/10.1007/PL00012553 Brune, J. N. (1970). Tectonic stress and the spectra of seismic shear waves from earthquakes. J. Geophys Res., 75, 4997-5009. http://dx.doi.org/10.1029/JB075i026p04997 Brune, J. N. (1971). Correction. J. Geophys. Res., 76, 5002. Gardner, J. K., & Knopoff, L. (1974). Is the sequence of earthquakes in Southern California, with aftershocks removed, Poissonian? Bull. Seismol. Soc. Am., 64, 1363-1367. Grϋnthal, G., Bosse, Ch., Sellami, S., Mayer-Rosa, D., & Giardini, D. (1999). Compilation of the GSHAP regional seismic hazard for Eu- rope, Africa and the Middle East. Annali Di Geofisica, 42, 1215- 1223. Hanks, T. C. (1982). fmax. Bull. Seism. Soc. Am., 72, 1867-1879. Reiter, L. (1990). Earthquake hazard analysis (254 p). Columbia Uni- versity Press. |