

Paper Menu >>
Journal Menu >>
 American Journal of Analytical Chemistry, 2013, 4, 674-682 Published Online November 2013 (http://www.scirp.org/journal/ajac) http://dx.doi.org/10.4236/ajac.2013.411081 Open Access AJAC Content of Heavy Metals in Mulberry Fruits and Their Extracts-Correlation Analysis Ružica J. Micić1*, Danica S. Dimitrijević2, Danijela A. Kostić2, Gordana S. Stojanović2, Snežana S. Mitić2, Milan N. Mitić2, Aleksandra N. Pavlović2, Saša S. Ranđelović2 1Department of Chemistry, Faculty of Natural Sciences and Mathematics, University of Pristina, Kosovska Mitrovica, Serbia 2Department of Chemistry, Faculty of Natural Sciences and Mathematics, University of Niš, Niš, Serbia Email: *[email protected] Received September 29, 2013; revised November 1, 2013; accepted November 12, 2013 Copyright © 2013 Ružica J. Micić et al. This is an open access article distributed under the Creative Commons Attribution License, which permits unrestricted use, distribution, and reproduction in any medium, provided the original work is properly cited. ABSTRACT The aim of this research was the determination of heavy metals’ (iron, copper, zinc, manganese, cadmium, nickel and lead) contents of white, red and black mulberry fruit grown in southeast region of Serbia, and their extracts. The content of all metals was confirmed in the fruits. All of tree types of mulberry contained the highest content of iron in the fruit and the lowest content of Cd. The level of iron in all assayed fruits species was ranged between 23.06 - 57.38 mg· 1 0 0g −1. The concentration range of cadmium for the tested fruits was found to be from 1.77 to 2.46 µg·100g−1 in fruit of Morus nigra L. and Morus alba L., respectively. The content of metals in the fruit of white mulberry decreases in the following order: Fe > Mn > Zn > Cu > Ni > Pb > Cd. The content of metals in the fruit of red mulberry by de- creasing the value is: Fe > Zn > Mn > Cu > Ni > Pb > Cd and in the fruit of black mulberry decreases in the following order: Fe > Zn > Cu > Mn > Ni > Pb > Cd. In addition, an analysis of mulberries extracts showed a significant transfer of heavy metals during extraction procedure; therefore, the corresponding extraction coefficients reached values up to 73.09%. Those were especially high in the acetone-based extracts. The lowest extraction coefficients were in the methanol-water extract of red mulberry (0.54%). Moreover, it was established that such coefficients mostly depend on the solvent nature and also on the treated mulberry species. We found lead in none of the extracts. Pattern recognition technique, such as principal component analysis (PCA), has been applied to the obtained data with classification and interdependences among determined metals purposes. Keywords: Mulberry; Extracts; Heavy Metal; Extraction Coefficient 1. Introduction The mulberry belongs to the genus Morus of the family Moraceae. Although it is extensively grown as food for silkworms in many countries, mulberry fruit production is a main aim in Turkey, which is one of the most impor- tant mulberry fruit producers in the world [1,2]. Mul- berry is found from temperate to subtropical regions of the northern hemisphere to the tropics of the southern hemisphere and they can grow in a wide range of cli- matic, topographical and soil conditions. These are widely spread throughout all regions from the tropics to the sub- artic areas. Genus Morus is widespread in Asia, Europe, North and South America and Africa as well. Mulberry has a unique delicious fruit, sour and refreshing taste. It has been used as a folk remedy to treat oral and dental diseases, diabetes, hypertension, arthritis and anemia [3]. The bright black and purple mulberry fruits, which have a very pleasant taste when eaten fresh, are also used in jams, juices, liquors, natural dyes as well as in the cos- metics industry [4]. Morus species are deciduous and in a period of low temperatures during the winter are required to break dormancy. Mulberry fruits may be coloured white, red or black when they are ripe. Deep-coloured fruits are good sources of phenolics, including flavonoids, anthocyanins and carotenoids [5-8], and mulberries are rich in phenolics [9]. Mulberry has a unique delicious fruit, sour and refreshing taste. It has been used as a folk remedy to treat oral and dental diseases, diabetes, hyper- tension, arthritis and anemia [3]. Fruits and their extracts deserve special attention be- cause of the important influence they have on human health. For the majority of the world population, fruits *Corresponding author.  R. J. MICIĆ ET AL. 675 represent the primary source of the health care. Although the effectiveness of fruits is mainly associated with their constituents such as essential oils, vitamins, glycosides, etc., it was found that prolonged intake can cause health problems due to the possible presence of heavy metals [10]. Fruits can easily be contaminated by heavy metals in the course of cultivation or later during the processing stage and therefore determining the content of the heavy metals accumulated is of high importance. The human body requires both the metallic and the non-metallic elements within certain permissible limits for growth and good health. Therefore, the determination of elemental compositions in food and related products is essential for understanding their nutritive importance. Accordingly, the presence of some heavy metals in large quantities in the body may have a toxic effect [10-13]. The content of heavy metals is one of the criteria for the use of plant material in the production of traditional medicines and herbal infusions. Rapid and unorganized urbanization and industrializa- tion have elevated the levels of heavy metals in the envi- ronment of developing countries [12]. Industrial uses of metals and other domestic processes have introduced substantial amounts of potentially toxic heavy metals into the atmosphere and into aquatic and terrestrial environ- ments [14]. Heavy metals have a significant toxicity for human, animals, microorganisms and plants [15]. Thus, the contaminations of fruit with heavy metals pose a se- rious threat to its quality and jeopardize food safety [12]. Lead and cadmium are very harmful elements for human body especially in high concentration [16]. Therefore, FAO/WHO established the permissible maximum limit of Cd in fruiting vegetables as 0.05 mg·kg−1 and Pb in berries and other small fruits as 0.2 mg·kg−1 [17]. Re- cently, pollution in developing areas has been increasing. Various factors such as exhaust gas, industrial waste and waste water have increased the heavy metal contamina- tion in fruit and other edible parts of plants. The most important cause of pollution for the plants on roadsides is probably exhaustion of gases [18]. The aim of this investigation was to determine the con- centrations of heavy metals in the mulberries and their extracts and to determine the coefficient of extraction of metals in different solvents and their mixtures. 2. Experimental 2.1. Samples Fruits of mulberries were collected in the South East Serbia in early July 2011. Fruit maturity was estimated on the basis of the color that was very black. Samples were stored in plastic bags and kept frozen until extrac- tion. The study area is located in the surroundings of the city of Niš. Niš has about 300.000 inhabitants and it is the third-largest city in the country after Belgrade and Novi Sad; however, the industry in this area is poorly developed. 2.2. Reagents All the reagents used were of the analytical purity (Merck, Germany). The working solutions were prepared immediately before the analysis from the basic solution with 1000 mg·l−1 concentration for all metals. For the preparation of standard solutions high purity Milli-Q water was used. The glassware and polyethylene con- tainers used for analysis were washed with tap water, then soaked over the night in 6 M HNO3 solution and rinsed several times with ultra pure water to eliminate absorbance due to detergent. 2.3. Apparatus Atomic absorption measurements were made using a Varian SpectraAA 10 with background correction and hollow cathode lamps. Air-acetylene flame was used for determination of all the elements. 2.4. Procedure The standard procedure described by Association of Of- ficial Analytical Chemists (AOAC) was followed for the preparation of the samples for the analysis of heavy met- als [19]. Accurately weighed (2 g) sample was trans- ferred into a silica crucible and kept in a muffle furnace for ashing at 450˚C for 3 h and then 5 ml of 6 M hydro- chloric acid was added to the crucible. Care was taken to ensure that all the ash came into contact with acid. Fur- ther, the crucible containing acid solution was kept on a hot plate and digested to obtain a clean solution. The final residue was dissolved in 0.1 M nitric acid solution and made up to 50 ml. Working standard solutions were prepared by diluting the stock solution with 0.1 M nitric acid for checking the linearity. Black, red and white mulberry fresh fruits (10 g) was extracted with water, ethanol-water (50/50, v/v%), ethanol, acetone-water (50/50, v/v%), acetone, methanol-water (50/50, v/v%) and methanol. All solvents were acidified with 1 ml concentrated HCl. The extraction was per- formed with 100 ml of solvents using the ultrasonic bath for 30 minutes. The suspension was gravity filtered through a Buchner funnel and Whatman No. 1 filter pa- per. Extracts were stored in the fridge until their ana- lysis. 2.5. Extraction Coefficient Extraction coefficient, EC, is defined by the Equation Open Access AJAC 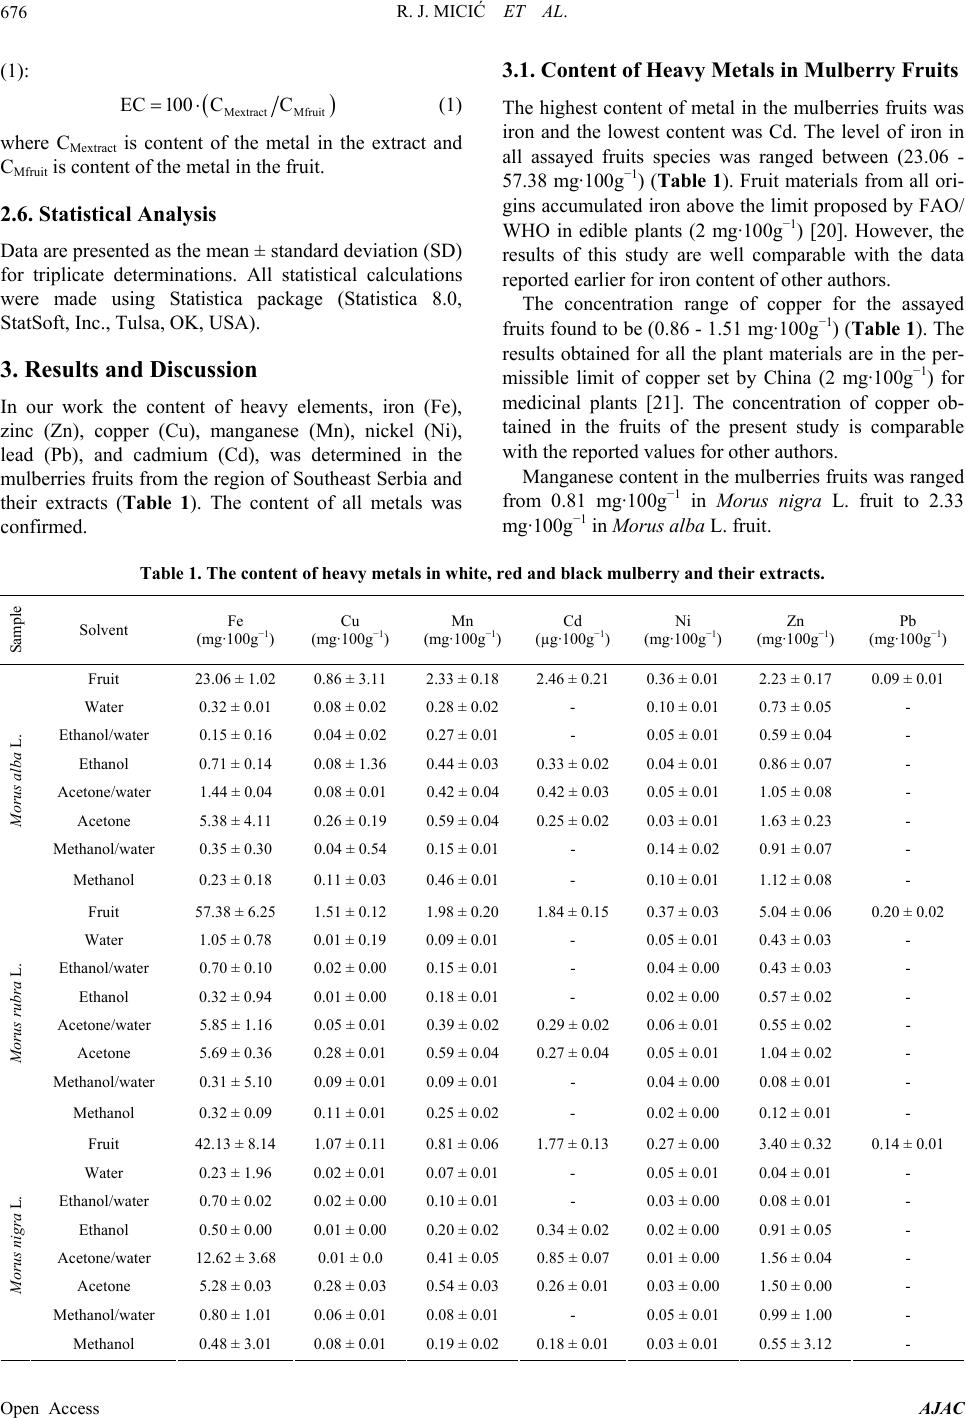 R. J. MICIĆ ET AL. Open Access AJAC 676 3.1. Content of Heavy Metals in Mulberry Fruits (1): Mextract Mfruit EC100 CC (1) The highest content of metal in the mulberries fruits was iron and the lowest content was Cd. The level of iron in all assayed fruits species was ranged between (23.06 - 57.38 mg·100g−1) (Table 1). Fruit materials from all ori- gins accumulated iron above the limit proposed by FAO/ WHO in edible plants (2 mg·100g−1) [20]. However, the results of this study are well comparable with the data reported earlier for iron content of other authors. where CMextract is content of the metal in the extract and CMfruit is content of the metal in the fruit. 2.6. Statistical Analysis Data are presented as the mean ± standard deviation (SD) for triplicate determinations. All statistical calculations were made using Statistica package (Statistica 8.0, StatSoft, Inc., Tulsa, OK, USA). The concentration range of copper for the assayed fruits found to be (0.86 - 1.51 mg·100g−1) (Table 1). The results obtained for all the plant materials are in the per- missible limit of copper set by China (2 mg·100g−1) for medicinal plants [21]. The concentration of copper ob- tained in the fruits of the present study is comparable with the reported values for other authors. 3. Results and Discussion In our work the content of heavy elements, iron (Fe), zinc (Zn), copper (Cu), manganese (Mn), nickel (Ni), lead (Pb), and cadmium (Cd), was determined in the mulberries fruits from the region of Southeast Serbia and their extracts (Table 1). The content of all metals was confirmed. Manganese content in the mulberries fruits was ranged from 0.81 mg·100g−1 in Morus nigra L. fruit to 2.33 mg· 1 0 0g −1 in Morus alba L. fruit. Table 1. The content of heavy metals in white, red and black mulberry and their extracts. Sample Solvent Fe (mg·100g−1) Cu (mg·100g−1) Mn (mg·100g−1) Cd (µg·100g−1) Ni (mg·100g−1) Zn (mg·100g−1) Pb (mg·100g−1) Fruit 23.06 ± 1.02 0.86 ± 3.11 2.33 ± 0.18 2.46 ± 0.21 0.36 ± 0.01 2.23 ± 0.17 0.09 ± 0.01 Water 0.32 ± 0.01 0.08 ± 0.02 0.28 ± 0.02 - 0.10 ± 0.01 0.73 ± 0.05 - Ethanol/water 0.15 ± 0.16 0.04 ± 0.02 0.27 ± 0.01 - 0.05 ± 0.01 0.59 ± 0.04 - Ethanol 0.71 ± 0.14 0.08 ± 1.36 0.44 ± 0.03 0.33 ± 0.02 0.04 ± 0.01 0.86 ± 0.07 - Acetone/water 1.44 ± 0.04 0.08 ± 0.01 0.42 ± 0.04 0.42 ± 0.03 0.05 ± 0.01 1.05 ± 0.08 - Acetone 5.38 ± 4.11 0.26 ± 0.19 0.59 ± 0.04 0.25 ± 0.02 0.03 ± 0.01 1.63 ± 0.23 - Methanol/water 0.35 ± 0.30 0.04 ± 0.54 0.15 ± 0.01 - 0.14 ± 0.02 0.91 ± 0.07 - Morus alba L. Methanol 0.23 ± 0.18 0.11 ± 0.03 0.46 ± 0.01 - 0.10 ± 0.01 1.12 ± 0.08 - Fruit 57.38 ± 6.25 1.51 ± 0.12 1.98 ± 0.20 1.84 ± 0.15 0.37 ± 0.03 5.04 ± 0.06 0.20 ± 0.02 Water 1.05 ± 0.78 0.01 ± 0.19 0.09 ± 0.01 - 0.05 ± 0.01 0.43 ± 0.03 - Ethanol/water 0.70 ± 0.10 0.02 ± 0.00 0.15 ± 0.01 - 0.04 ± 0.00 0.43 ± 0.03 - Ethanol 0.32 ± 0.94 0.01 ± 0.00 0.18 ± 0.01 - 0.02 ± 0.00 0.57 ± 0.02 - Acetone/water 5.85 ± 1.16 0.05 ± 0.01 0.39 ± 0.02 0.29 ± 0.02 0.06 ± 0.01 0.55 ± 0.02 - Acetone 5.69 ± 0.36 0.28 ± 0.01 0.59 ± 0.04 0.27 ± 0.04 0.05 ± 0.01 1.04 ± 0.02 - Methanol/water 0.31 ± 5.10 0.09 ± 0.01 0.09 ± 0.01 - 0.04 ± 0.00 0.08 ± 0.01 - Morus rubra L. Methanol 0.32 ± 0.09 0.11 ± 0.01 0.25 ± 0.02 - 0.02 ± 0.00 0.12 ± 0.01 - Fruit 42.13 ± 8.14 1.07 ± 0.11 0.81 ± 0.06 1.77 ± 0.13 0.27 ± 0.00 3.40 ± 0.32 0.14 ± 0.01 Water 0.23 ± 1.96 0.02 ± 0.01 0.07 ± 0.01 - 0.05 ± 0.01 0.04 ± 0.01 - Ethanol/water 0.70 ± 0.02 0.02 ± 0.00 0.10 ± 0.01 - 0.03 ± 0.00 0.08 ± 0.01 - Ethanol 0.50 ± 0.00 0.01 ± 0.00 0.20 ± 0.02 0.34 ± 0.02 0.02 ± 0.00 0.91 ± 0.05 - Acetone/water 12.62 ± 3.68 0.01 ± 0.0 0.41 ± 0.05 0.85 ± 0.07 0.01 ± 0.00 1.56 ± 0.04 - Acetone 5.28 ± 0.03 0.28 ± 0.03 0.54 ± 0.03 0.26 ± 0.01 0.03 ± 0.00 1.50 ± 0.00 - Methanol/water 0.80 ± 1.01 0.06 ± 0.01 0.08 ± 0.01 - 0.05 ± 0.01 0.99 ± 1.00 - Morus nigra L. Methanol 0.48 ± 3.01 0.08 ± 0.01 0.19 ± 0.02 0.18 ± 0.01 0.03 ± 0.01 0.55 ± 3.12 -  R. J. MICIĆ ET AL. 677 The concentration range of cadmium for the tested fruits was found to be from 1.77 to 2.46 µg·100g−1 in fruit of Morus nigra L. and Morus alba L., respectively. Cadmium accumulates in human body and damages mainly the kidneys and liver [21]. For medicinal plants the permissible limit set by WHO, China and Thailand was 0.03 mg·100g−1 cadmium in finished herbal products [13]. All the investigated plant materials accumulated above the permissible limit. The content of nickel was similar in all three types of fruits (0.36, 0.37 and 0.27 mg·100g−1 for white, red and black mulberry fruit, respectively). The highest content of zinc was in the fruit of Morus rubra L. (5.04 mg·100g−1) and the lowest in the fruit of Morus alba L. (2.23 mg·100g−1). Zinc content of the studied medicinal plants has been compared with the limit proposed by FAO/WHO in edible plants (2.74 mg· 1 0 0g −1) [20], it was found that only Morus alba L. within this limit while all other plants accumulated zinc above this limit. However, for medicinal plants the WHO limits have not yet been established for zinc [13]. Lead content in the mulberries fruits ranged from 0.09 mg· 1 0 0g −1 in Morus alba L. fruit to 0.2 mg·100g−1 in Morus rubra L. fruit (Table 1). The content of lead in the investigated medicinal plants is under the permissible limit for medicinal plants set by China, Malaysia, Thai- land and WHO (1 mg·100g−1) [13]. Lead content con- firmed only in the fruits of mulberries but not in their extracts. Trichopoulos [22] has reported the Pb has a toxic effect for human metabolism even in low amounts and may have carcinogenic effects. All of three types of mulberry had the highest content of Fe in the fruit and the lowest content of Cd. The con- tent of metals in the fruit of white mulberry decreases in the following order: Fe > Mn > Zn > Cu > Ni > Pb > Cd. The content of metals in the fruit of red mulberry by de- creasing the value is: Fe > Zn > Mn > Cu > Ni > Pb > Cd. The content of metals in the fruit of black mulberry de- creases in the following order: Fe > Zn > Cu > Mn > Ni > Pb > Cd (Table 1). 3.2. Content of Heavy Metals in Mulberry Extracts In the extracts, the highest concentration of iron was in acetone-water extract (50/50, v/v%) of Morus nigra L. (12.62 mg·100g−1) and the lowest concentration was in ethanol-water extracts (50/50, v/v%) of Morus alba L. (0.15 mg·100g−1). The content of copper in the extracts was ranged from 0.01 mg·100g−1 in water and ethanol- water (50/50, v/v%) of Morus rubra L. and in ethanol and acetone-water of Morus nigra L. to 0.28 mg·100g−1 in acetone extract of Morus rub ra L. and Morus nigra L. Manganese content was the highest in acetone extracts of Morus alba L. and Morus rubra L. (0.59 mg·100g−1) and the lowest concentration was in the methanol-water ex- tract of Morus nigra L. (0.08 mg·100g−1). The content of cadmium was ranged from 0.18 µg·100g−1 in the Morus nigra L. methanol extract to 0.85 µg·100g−1 in the ace- tone-water (50/50, v/v%) of Morus nigra L. All the water, ethanol-water and methanol-water extracts of fruits, and methanol extracts of white and red mulberry did not con- firm the content of Cd. Nickel content was low and ranged from 0.01 mg·100g−1 in acetone-water (50/50, v/v%) of Morus nigra L. to 0.14 mg·100g−1 in methanol- water extract of Morus alba L. The highest content of zinc was in acetone extract of Morus alba L. (1.63 mg· 1 0 0g −1) and the lowest content was in water extract of Morus nigra L. (0.04 mg·100g−1). The content of lead was not confirmed in the extracts (Table 1). The highest content of Fe, Cu, Mn and Zn of Morus alba L. fruit showed the acetone extract (5.38, 0.26, 0.59 and 1.63 mg·100g−1, respectively). The highest content of Cd in white mulberry extracts was in the acetone-water extract (0.42 µg·100g−1), while water, ethanol-water, methanol and methanol-water did not confirm the content of Cd. The methanol-water extract of Morus alba L. fruit showed the highest content of Ni (0.14 mg·100g−1). The ethanol-water extract of Morus alba L. fruit had the low- est content of Fe, Cu and Zn (0.15, 0.04 and 0.59 mg· 1 0 0g −1, respectively). The lowest content of Mn was in the methanol-water extract of white mulberry fruit (0.15 mg·100g−1). The acetone extract showed the lowest content of Ni (0.03 mg·100g−1). The highest contents of metals in Morus rubra L. ex- tracts showed the acetone and acetone-water extracts. The acetone-water extract had the highest content of Fe, Cd and Ni (5.85, 0.29 and 0.06 mg·100g−1, respectively). The highest content of Cu, Mn and Zn was in the acetone extract of Morus rubra L. fruit (0.28, 0.59 and 1.04 mg· 1 0 0g −1, respectively). The water, ethanol-water, etha- nol, methanol-water and methanol extracts of red mul- berry fruit did not confirm the content of Cd. The lowest content of Fe, Mn and Zn was in the methanol-water ex- tract of Morus rubra L. fruit (0.31, 0.09 and 0.08 mg· 1 0 0g −1, respectively). The water and ethanol extract of red mulberry fruit showed the lowest content of Cu (0.01 mg·100g−1). The ethanol extract had the lowest content of Ni (0.02 mg·100g−1). The manganese content was the lowest in water and methanol-water extract of red mulberry (0.09 mg·100g−1). The highest content of Fe in Morus nigra L. extracts was in acetone-water extract. Also, the acetone-water extract showed the highest content of Cd and Zn. The content of Cu and Mn was the highest in the acetone ex- tract. The water and methanol-water extracts of Morus nigra L. fruit showed the highest content of Ni. The wa- ter, ethanol-water and methanol-water extracts of black mulberry fruit did not confirm the content of Cd (Table Open Access AJAC  R. J. MICIĆ ET AL. 678 1). The water extract of black mulberry fruit had the lowest content of Fe, Mn and Zn (0.23, 0.07 and 0.04 mg· 1 0 0g −1, respectively). The lowest content of Cu and Ni was in the acetone-water extract (0.01 mg·100g−1). 3.3. Coefficient of Extraction Based on the results, the analyzed elements can be clas- sified into three groups: elements with the low extraction coefficient (less than 10%); elements with the medium extraction coefficient (10% - 30%), and elements with the high extraction coefficient (more than 30%). The extraction coefficients EC obtained in this study varied markedly, from 0% to 73.06% (Table 2, Figures 1-3). The extraction coefficient depends mostly on the ex- traction medium. The lowest transfer of heavy metals was in the methanol-water extract (50/50, v/v%) in Morus rubra L. (0.54%) for extraction of Fe, and the highest in the acetone extract of Morus alba L. (73.09%) for extraction of Zn. The extraction coefficient also de- pends on the plant species that is being extracted (Table 2). The water extracts all of three types of mulberry had Table 2. Extraction coefficient of heavy metals from the mulberries by different extractions. EC (%) Sample Solvent Fe CuMn Cd Ni Zn Water 1.38 9.30 12.02 - 27.7832.74 Ethanol/water 0.65 4.65 11.59 - 13.8926.46 Ethanol 3.08 9.30 18.88 13.41 11.1138.57 Acetone/water 6.24 9.30 18.03 17.07 13.8947.09 Acetone 23.33 30.23 25.32 10.16 8.3373.09 Methanol/water 1.52 4.65 6.44 - 38.8940.81 Morus alba L. Methanol 1.00 12.80 19.74 - 27.7850.22 Water 1.83 0.66 4.55 - 13.518.53 Ethanol/water 1.22 1.32 7.58 - 10.818.53 Ethanol 0.56 0.66 9.09 - 5.4111.31 Acetone/water 10.20 3.31 19.70 15.76 16.2210.91 Acetone 9.92 18.54 29.80 14.67 13.51 20.63 Methanol/water 0.54 5.96 4.55 - 10.811.59 Morus rubra L. Methanol 0.56 7.28 12.63 - 5.412.38 Water 0.55 1.87 8.64 - 18.521.18 Ethanol/water 1.66 1.87 12.35 - 11.112.35 Ethanol 1.19 0.93 24.69 19.21 7.41 26.76 Acetone/water 30.00 0.93 50.62 48.02 3.70 45.88 Acetone 12.53 26.17 66.67 14.69 11.11 44.12 Methanol/water 1.90 5.61 9.88 - 18.5229.12 Morus nigra L. Methanol 1.14 7.48 23.46 10.17 11.1116.18 Figure 1. Extraction coefficient in extracts of Morus alba L. Figure 2. Extraction coefficient in extracts of Morus rubra L. Figure 3. Extraction coefficient in extracts of Morus nigra L. relatively low coefficients of extraction except for ex- traction of Zn in Morus alba L. (32.74%). The ethanol- water and ethanol extracts showed the lowest coefficients Open Access AJAC  R. J. MICIĆ ET AL. 679 of extraction. The ethanol-water extract showed the high- est coefficient of extraction for extraction of Zn in Morus alba L. (26.46%). The lowest coefficient of extraction was for extraction of Fe (0.65%). The coefficient of ex- traction was the highest in the acetone and acetone-water extracts all of three types of mulberry. The acetone-water extracts had a high coefficient of extraction in Morus alba L. for extraction of Zn and in Morus nigra L. for extraction of Fe, Mn, Cd and Zn. In the other cases it was lower than 30%. The acetone extract of Morus alba L. fruit showed the highest coefficient of extraction for ex- traction of Zn (73.09%). A high coefficient of extraction (more then 30%) was for extraction of Cu in white mul- berry (30.23%), Mn and Zn in black mulberry (66.67% and 44.12%, respectively). The methanol-water extracts of white, red and black mulberry had a coefficient of extraction less than 30% except for extraction Ni and Zn in Morus alba L. fruit extract (38.89% and 40.81%, re- spectively). Also, the methanol-water extract showed the lowest coefficient of extraction, in relate of all extracts, for extraction of Fe in Morus rubra L. fruit extract. The methanol extract showed a high and the highest coeffi- cient of extraction in Morus alba L. fruit extract for ex- traction of Zn (50.22%) (Table 2). From the obtained results of elemental concentrations in investigated plant samples after using different extrac- tion solvents, it can be concluded that there is a sifnifi- cant difference (p < 0.05) in elemental profiles among plant samples. 3.4. PCA Analysis I order to highlight the relation between the elements the principal component analysis (PCA) was used. With PCA, the data reduction is performed by transforming the data into orthogonal components that are a linear combi- nation of the origin variables. One of the main objectives of PCA is to identify factors that are substantially mean- ingful. The principal components which have eigenval- ues higher than 1 were extracted (Kaiser criterion) [23,24] (Figure 4). This led to the formation of two principal components. The first component accounted for 55.64% and the sec- ond for 21.96% of the total variation of data. The first two components account for 77.60% of variances for all of the data. The first component represents the maximum variation of the data set. Factor loading and communality for each element is presented in Table 3. Factor loadings of elements data from Table 3 indicate the similarities and correlations between elements. The elements with small factor loadings have only little in- fluence on data structure, whereas the elements with high loadings represent those elements with the greatest in- fluence on the grouping and separation of plant samples. Figure 4. Eigenvalues of the correlation matrix. Table 3. The loadings and the scores of all extracted factors. Factor 1 (PC1) Factor 2 (PC2)Factor 3 Factor 4 Factor 5Factor 6 Fe −0.8437*−0.30550.1789 0.3599 0.1681−0.0712 Cu −0.8088*−0.4549−0.5201 0.1033 0.08350.1406 Mn −0.8826*0.3244 −0.1152 −0.0094 −0.2837 −0.1478 Cd −0.4338 0.6389*0.2694 −0.0497 −0.18070.1768 Ni 0.25610.7558*0.5811 0.1448 −0.0448 0.0508 Zn −0.8523*0.22450.2479 −0.3327 0.2233 −0.0335 Eigenvalue3.34 1.32 0.79 0.27 0.20 0.08 Variance (%) 55.6421.9613.12 4.57 3.34 1.36 Cumulative (%) 55.6477.60 90.73 95.30 98.64100 *Loadings >0.5 and <−0.5. The first factor with 55.64% of variance comprises Fe, Mn, Cu and Zn with high loadings and Ni with low load- ings. All elements, except Ni have negative loadings in this factor. A negative correlation supports the fact that there is a strong influence between matrix elements and traces. No significant loading value, except for Cd and Ni, was obtained for any variable of the second factor, which is responsible for 21.96% of total variance. This factor, dominatly loaded by Ni, refers to potential anthropogenic contaminant [25]. Correlation analysis of total metal contents (Table 4) in different plant extracts is also showed strong correla- tions in two groups of elements. In general, interpretation of correlation analysis were done using correlation coef- ficient values higher than 0.5 [26]. The correlation coefficients can range from −1 to +1 and is independent of the units of measurement. Inter- pretation of correlation analysis enabled two groupings to be obtained. A close relation was observed between the concentrations of Fe, Mn, Cu and Zn while there is not a Open Access AJAC  R. J. MICIĆ ET AL. 680 Table 4. Correlation matrix for the element concentrations in plant samples. Fe Cu Mn Cd Ni Zn Fe 1.0000 0.8087* 0.5844*0.3182 −0.3021 0.6150* Cu 1.000 0.7487*0.1320 −0.0389 0.5118* Mn 1.00000.4608 −0.0439 0.7413* Cd 1.0000 −0.3845 0.4243 Ni 1.0000 0.0356 Zn 1.0000 *Marked correlations are significant at p < 0.05. significant correlation of these metals with Cd and Ni. 3.5. Heavy Metals in the Mulberry Fruits from Different Regions The comparison of our results regarding the heavy metals content in the mulberries from the region of Southeast Serbia with the results of other authors is shown in Table 5. Several papers were previously published on the com- position of micro-, macro- and toxic elements in various mulberry species [2,27,28]. Those studies were mainly focused on the investigation of the mineral fruit con- stituents of a range of the mulberry species, and showed that mulberry fruit contains an essential macro-elements as potassium (K), calcium (Ca), magnesium (Mg) and sodium (Na) and micro-elements as iron (Fe), zinc (Zn) and nickel (Ni) as indicated in Table 3. Investigation of constituents in various mulberry species performed in different countries, gave the results of Ca content from 132 to 574 mg·100g−1 in fresh fruit, Mg from 91 to 240 mg· 1 0 0g −1 and Na from 45 to 280 mg·100g−1. Trace ele- ments in these tested extracts of mulberry fruit were in the range from 3 to 77.6 mg·100g−1, with Fe and Zn be- ing the most dominant elements and Cu the least domi- nant element in relation to all detected elements. Suffi- cient quantities of essential macro- (K, Ca, Mg, and Na) and micro- (Fe, Zn, and Ni) elements were found in all the fruits. Potassium was the predominant element with concentration ranging from 834 to 1731 mg·100g−1. The decreasing order of micro-minerals was Fe > Zn > Ni. Nitrogen (N), phosphorus (P), copper (Cu) and manga- nese (Mn) were not determined [27] (Table 5). Fruit of Morus alba L. from Turkey [28] has a lower content of heavy metals than our results (Table 5). Preliminary study of heavy metals in mulberry fruits from Southeast region of Serbia and their extracts show that the iron content was the highest (13.8 - 42.3 mg· 1 0 0g −1) while the contents of Cu, Zn and Mn were remarkably lower, and ranged from 0.9 to 6.2 mg·100g−1 which is less than content of heavy metals in mulberries from Southeast Serbia [29]. Table 5. Contents of mineral element from mulberry fruit from different countries. Morus nigra L. Morus rubra L. Morus nigra L. Morus rubra L. Morus alba L. Morus nigra L. Morus alba L. (mg·100g−1) Turkey Turkey Turkey Turkey Turkey PakistanPakistan N 80069092 82 75 n.d.* n.d.* P 289242232226 247 n.d.*n.d.* K 1005929922834 1668 12701731 Ca 137143132132 152 470 574 Mg 10891 106115 106 240 240 Na 58 45 59 61 60 272 280 Fe 5 5 4.2 4.5 4.2 77.6 73 Cu n.d.*n.d.*0.4 0.4 0.5 n.d.*n.d.* Mn 7 5 4.2 4.0 3.8 n.d.*n.d.* Ni n.d.*n.d.*n.d.* n.d.* n.d.* 1.6 2.2 Zn 3 3 3.2 3.2 2.8 59.2 50.2 References[27][27][2] [2] [2] [28] [28] *not determined. In different environments, many factors are known to affect the concentration of heavy metals in both soil and plants, including industrialization, traffic density and unknown atmospheric deposits. In the mulberries from the region of Southeast Serbia, the highest content is that of Fe, while the content of Cd is significantly lower. This can be attributed, among other factors, to the fact that these were mulberries growing in a non-polluted region of Southeast Serbia. 4. Conclusions The analysis of white, red and black mulberry fruit and their extracts from the region of Southeast Serbia showed the presence of Fe, Cu, Mn, Cd, Ni, Zn and Pb. The iron concentration in the fruits was rather high while the cad- mium content was significantly lower. The extracts of fruits did not confirm the lead content. By analyzing the extracts of mulberries, the transfer of heavy metals from the plants to the extracts was found. The extraction coefficients varied in the interval from 0.54% to 73.09%. The extraction coefficient depends mainly on the extraction medium. The lowest transfer of heavy metals was found in methanol-water extract, and the highest in acetone extract. Since the white, red and black mulberries and their extracts are used in traditional medicine, there is a possible danger of heavy metal poi- soning, if they come from the polluted areas. Therefore, the fruits should be collected in non-polluted regions and they should be tested for the presence of heavy metals. These investigations are obligatory and they are recom- mended by the European standards in order to prevent poisoning by heavy metals. Open Access AJAC  R. J. MICIĆ ET AL. 681 5. Acknowledgements Financial support of this work by the Serbian Ministry of Education and Science, Project No. ON 172047. REFERENCES [1] S. Ercisli, “A Short Review of the Fruit Germplasm Re- sources of Turkey,” Geneteic Resources and Crop Evolu- tion, Vol. 51, No. 4, 2004, pp. 419-435. http://dx.doi.org/10.1023/B:GRES.0000023458.60138.79 [2] E. Ercisli and E. Orhan, “Chemical Composition of White (Morus alba L.), Red (Morus rubra L.) and Black (Morus nigra L.) Mulberry Fruits,” Food Chemistry, Vol. 103, No. 4, 2007, pp. 1380-1384. http://dx.doi.org/10.1016/j.foodchem.2006.10.054 [3] M. Ozgen, S. Serce and K. Kaya, “Phytochemical and Antioxidant Properties of Anthocyanin-Rich Morus nigra and Morus rubra Fruits,” Scientia Horticulturae, Vol. 119, No. 3, 2009, pp. 275-279. http://dx.doi.org/10.1016/j.scienta.2008.08.007 [4] S. Ercisli and E. Orhan, “Some Physico-Chemical Cha- racteristics of Black Mulberry (Morus nigra L.) Geno- types from Northeast Anatolia Region of Turkey,” Scien- tia Horticulturae, Vol. 116, No. 1, 2008, pp. 41-46. http://dx.doi.org/10.1016/j.scienta.2007.10.021 [5] D. Gerasopoulos and G. Stavroulakis, “Quality Charac- teristics of Four Mulberry (Morus Species) Cultivars in the Area of Chania, Greece,” Journal of the Science of Food and Agriculturae, Vol. 73, No. 2, 1997, pp. 261- 264. http://dx.doi.org/10.1002/(SICI)1097-0010(199702)73:2< 261::AID-JSFA724>3.0.CO;2-S [6] A. Sass-Kiss, J. Kiss, P. Milotay, M. M. Kerek, M. Toth- Markus, “Diferences in Anthocyanin and Carotenoid Con- tent of Fruits and Vegetables,” Food Research Inter- national, Vol. 38, No. 8-9, 2005, pp. 1023-1029. http://dx.doi.org/10.1016/j.foodres.2005.03.014 [7] J. Y. Quian, D. Liu and A. G. Huang, “The Efficiency of Flavonoids in Polar Extracts of Lycium chinense Mill Fruits as Free Radical Scavenger,” Food Chemistry, Vol. 87, No. 2, 2004, pp. 283-288. http://dx.doi.org/10.1016/j.foodchem.2003.11.008 [8] A. Trappey, H. A. Bawadi, R. R. Bansode and J. N. Losso, “Anthocyanin Profile of Mayhaw (Cretaegus opaca),” Food Chemistry, Vol. 91, No. 4, 2005, pp. 665-671. http://dx.doi.org/10.1016/j.foodchem.2004.06.037 [9] J. Y. Lin and C. Y. Tang, “Determination of Total Phenolic and Flavonoid Contents in Selected Fruits and Vegetables as Well as Their Stimulatory Effects on Mouse Splenocyte Proliferation,” Food Chemistry, Vol. 101, 2007, pp. 140- 147. http://dx.doi.org/10.1016/j.foodchem.2006.01.014 [10] S. Jabeen, M. T. Shah, S. Khan and M. Q. Hayat, “De- termination of Major and Trace Elements in Ten Impor- tant Folk Therapeutic Plants of Haripur Basin, Pakistan,” Pakistan Journal of Medicinal Plants Research, Vol. 4, No. 7, 2010, pp. 559-566. [11] S. A. Khan, “Profile of Heavy Metals in Selected Me- dicinal Plants,” Pakistan Journal of Weed Science Re- search, Vol. 14, No. 1-2, 2008, pp. 101-110. [12] K. R. Sharma, M. Agrawal and M. F. Marshall, “Heavy Metals in Vegetables Collected from Production and Market Sites of a Tropical Urban Area of India,” Food and Chemical Toxicology, Vol. 47, No. 3, 2009, pp. 583- 591. http://dx.doi.org/10.1016/j.fct.2008.12.016 [13] WHO, “Quality Control Methods for Medicinal Plant Materials,” Revised, Geneva, 2005. [14] D. W. O’Connell, C. Birkinshaw and T. F. O’Dwyer, “Heavy Metal Adsorbents Prepared from the Modifica- tion of Cellulose: A Review,” Bioresource Technology, Vol. 99, No. 13, 2008, pp. 6709-6724. http://dx.doi.org/10.1016/j.biortech.2008.01.036 [15] G. Fotakis and J. A. Timbrell, “Role of Trace Elements in Cadmium Chloride Uptake in Hepatoma Cell Lines,” Toxicology Letters, Vol. 164, No. 2, 2006, pp. 97-103. http://dx.doi.org/10.1016/j.toxlet.2005.11.016 [16] M. Hamurcu, “Mineral and Heavy Metal Levels of Some Fruits Grown at the Roadsides,” Food and Chemical Toxicology, Vol. 48, No. 6, 2010, pp. 1767-1770. http://dx.doi.org/10.1016/j.fct.2010.03.031 [17] Codex Stand, “Codex General Standard for Contaminants and Toxins in Food and Feed,” 1995, pp. 31-32. [18] C. L. Ma, X. Y. Ao, J. Li, N. Zhao, N. Y. Li and Y. Chen, “Determination of 15 Elements in Ottelia acuminata by Microwave Digestion and ICP-OES,” Journal of Food Agriculture and Environment, Vol. 11, No. 2, 2013, pp. 899-902. [19] “Use of Statistics to Develop and Evaluate Analytical Method, Official Methods of Analysis,” Association of Official Analytical Chemists International, 2000, p. 2000. [20] FAO/WHO, “Contaminants,” In: Codex Alimentarius, Vol. XVII, FAO/WHO, Codex Alimentarius Commision, Rome, 1984. [21] World Health Organization, “Quality Control Methods for Medicinal Fruit Materials,” Geneva, 1998. [22] D. Trichopoulos, “Epidemiology of Cancer,” In: V. T. De Vita, Ed., Cancer: Principles and Practice of Oncology, Lippincott Company, Philadelphia, 1997, pp. 235-239. [23] H. F. Kaiser, “The Application of Electronic Computers to Factor Analysis,” Educational and Psycholo gical Meas - urement, Vol. 20, No. 1, 1960, pp. 141-151. http://dx.doi.org/10.1177/001316446002000116 [24] R. B. Cattell, “The Scree Test for the Number of Factors,” Multivariate Behavioral Research, Vol. 1, No. 2, 1996, pp. 245-276. http://dx.doi.org/10.1207/s15327906mbr0102_10 [25] S. Ražić, A. Onjia, S. Đogo, L. Slavković and A. Popović, “Determination of Metal Content in Some Herbal Drugs- Empirical and Chemometric Approach,” Talanta, Vol. 67, 2005, pp. 233-239. http://dx.doi.org/10.1016/j.talanta.2005.03.023 [26] J. N. Miller and J. C. Miller, “Statistics and Chemometrics for Analytical Chemistry,” Pearson Education Limited, London, 2005. [27] S. Ercisli, M. Tosun, B. Duralija, S. Voća, M. Sengul and M. Turad, “Phytochemical Content of Some Black (Morus Open Access AJAC  R. J. MICIĆ ET AL. Open Access AJAC 682 nigra L.) and Purple (Morus rubra L.) Mulberry Geno- types,” Food Tecnology and Biotechnology, Vol. 48, No. 1, 2010, pp. 102-106. [28] M. Imran, H. Khan, M. Shah, R. Khan and F. Khan, “Chemical Composition and Antioxidant Activity of Certain Morus Species,” Journal of Zheijang University- Science B, Vol. 11, No. 12, 2011, pp. 973-980. [29] D. Kostic, S. Mitic, A. Zarubica, M. Mitic, J. Velickovic and S. Randjelovic, “Content of Trace Metals in Medici- nal Plants and Their Extracts,” Hemijska Industrija, Vol. 65, No. 2, 2011, pp. 165-170. http://dx.doi.org/10.2298/HEMIND101005075K |