

Paper Menu >>
Journal Menu >>
 American Journal of Analytical Chemistry, 2013, 4, 653-660 Published Online November 2013 (http://www.scirp.org/journal/ajac) http://dx.doi.org/10.4236/ajac.2013.411078 Open Access AJAC Spectrophotometric Determination of Water-Soluble Hexavalent Chromium and Determination of Total Hexavalent Chromium Content of Portland Cement in the Presence of Iron (III) and Titanium (IV) Using Derivative Ratio Spectrophotometry K. A. Idriss*, H. Sedaira, S. Dardeery Chemistry Department, Faculty of Science, Assiut University, Assiut, Egypt Email: *[email protected] Received September 7, 2013; revised October 8, 2013; accepted October 25, 2013 Copyright © 2013 K. A. Idriss et al. This is an open access article distributed under the Creative Commons Attribution License, which permits unrestricted use, distribution, and reproduction in any medium, provided the original work is properly cited. ABSTRACT A rapid, reliable and accurate method for the determination of hexavalent chromium in Portland cement is developed. The proposed method includes direct spectrophotometric determination of Cr (VI) in Portland cement with 1, 2, 5, 8 Tetrahydroxyanthraquinone, (Quinalizarin, QINZ) at pH 1.5. The European Directive (2003/53/EC) limits the use of cements so that it contains no more than 2 mg·Kg−1 of water-soluble Cr (VI). The absorbance at 565 nm due to Cr (VI)-QINZ complex is recommended for the determination of water-soluble Cr (VI) in Portland cement. The quantifica- tion of Cr (VI) released from cement when mixed with water is performed according to TRGS 613 (Technical Rules of Hazardous Substances). The validity of the method is thoroughly examined and the proposed method gives satisfactory results. A derivative spectrophotometric method has been developed for the determination of total Cr (VI) in Portland cement in the presence of Fe (III) and Ti (IV). The hexavalent chromium complex formed at pH 1.5 allows precise and accurate determination of chromium (VI) over the concentration range 0.05 to 3.0 mg·L−1 of chromium (VI). The valid- ity of the method was examined by analyzing several Standard Reference Material (SRM) Portland cement samples. The MDL (at 95% confidence level) was found to be 25 ng/mL for chromium (VI) in National Institute of Standards and Technology (NIST) cement samples using the proposed method. Keywords: Chromium (VI) Determination; Quinalizarin; Portland Cement Analysis; Derivative Spectrophotometry 1. Introduction In cement industry, raw materials are mixed in controlled proportions and ground to form a fine and homogeneous mixture called raw meal. The raw meal is burnt in kilns to the point of partial melting (~1400˚C) where reactions forming clinker phases take place. Clinker is interground- ed with gypsum to form the construction product-cement. Description of cement composition is normally carried out by chemical analysis to give the contents of major and minor components expressed as oxides. In a cement plant, on-line control of the composition of cement is necessary to maintain the composition of the cement within strict requirements [1]. The improvement of the quality is tantamount to the improvement of the chemical composition. One of the problems affecting cement companies is the need to determine and control the content of the hexava- lent chromium, due to its toxic effects. The hexavalent chromium is considered an undesirable component of cement because of its potential health consequences. Cr (VI) content of Portland cement contributes to the debili- tating medical condition known as dermatitis [2-7]. Due to increasing health-related concerns, the amount of Cr (VI) found in Portland cement is coming under increas- ing scrutiny [7,8]. European countries have limited the amount of Cr (VI) allowed in Portland cement; it must be no more than 2 ppm water-soluble chromate relative to the dry cement mass [9]. The major sources of chromium content of *Corresponding author.  K. A. IDRISS ET AL. 654 Portland cement are the kiln feed raw materials, refrac- tory brick, wear metal from grinding media and additives [7]. The chemical, environmental and medical literatures describe research and analytical method development for the determination of Cr (VI) in a broad variety of sample types, including Portland cement, cement constituents and concrete/mortar [10]. The US EPA, ASTM, OSHA and NIOSH and other agencies have established many of these analytical procedures as required test methods. These methods include a range of instrumental tech- niques including UV-Visible spectrophotometry, atomic absorption spectrophotometry (AAS), ion chromatogram- phy (IC), capillary electrophoresis (CE), XRF and induc- tively coupled plasma (ICP) by either emission or mass spectrometry. The colorimetric method has been widely used for quantitative analysis of Cr (VI) in cement and its extraction fluids [11-13]. Derivative spectrophotometry opens up possibilities, not only for increasing selectivity [14-16], but also for increasing sensitivity [17,18]. Salinas et al. [19] devel- oped a spectrophotometric method for resolving ternary mixtures; the method is based on the simultaneous use of the first derivative of the ratio spectra and measurements at zero-crossing wavelengths. Although several methods have been applied to determine Cr (VI), direct visible spectrophotometric methods using anthraquinone de- rivative have not yet been investigated for its determina- tion in Portland cement. The common availability and the relatively low cost instrumentation, the stability of the procedures and the accuracy of the techniques make the absorption spectrophotometry advantageous for cement analysis [20-24]. In this work, fundamental study of the complexation reaction of hexavalent chromium with QINZ is described, a rapid and sensitive first derivative ratio spectrum zero-crossing method is undertaken to determine Cr (VI) in the presence of Fe (III) and Ti (IV) in mixtures using Quinalizarin as a complexing agent. Solution spectra of the extracted Cr (VI), as indicated by the TRGS 613 [25], are also investigated under our opti- mum conditions. The validity of the method is thor- oughly examined and its analytical characteristics are determined and approved to be suitable for the intended purpose. 2. Experimental 2.1. Chemicals and Solutions All chemicals used were of analytical reagent grade and doubly distilled water, were used for the preparation of aqueous solutions. A 1.0 × 10⁻³ mol·L−1 stock standard solution of Qui- nalizarin was prepared by dissolving an accurately weighed amount of Sigma (St. Louis, MO, USA) pure grade reagent in absolute ethanol. A 10−4 mo l · L −1 stock standard solution of potassium di chromate (or potassium chromate) and 10−3 mol·L −1 stock standard solution of ferric chloride were prepared using the AnalaR grade product. Titanium stock standard solution was prepared as given elsewhere [20]. The metal content of the solu- tion was determined by conventional methods [26]. Solu- tions of perchloric acid, sodium perchlorate and standard sodium hydroxide solution were all prepared from ana- lytical-reagent grade reagents. Solutions of diverse ions used for interference studies were prepared from AnalaR chloride salts of the metal ions and potassium or sodium salts of the anions to be tested. The solution spectra were recorded in water-ethanol containing 50% v/v ethanol. The acid-base properties of the QINZ were studied under our experimental conditions and the pKa values of the reagent were determined. 2.2. Cement Samples National Institute of Standards and Technology (NIST) Standard Reference Materials (SRMs) 1880b and 1885a were used as the Portland cement matrix in this study. Precautions for handling and use were taken in accor- dance with the instructions on the NIST data sheet. A complete composition of SRMs samples according to NIST certificates of analysis [27] is given in Table 1. Samples of ordinary Portland cement (OPC) were sup- plied by Assiut Cement (Cemex, Egypt). Table 1. Complete composition of SRM(s) samples accord- ing to the NIST certificate of analysis [27]. Constituent1880b (wt %) 1885a (wt %) SiO2 20.42 ± 0.36 20.909 ± 0.047 Al2O3 5.183 ± 0.073 4.026 ± 0.032 Fe2O3 3.681 ± 0.023 1.929 ± 0.061 CaO 64.16 ± 0.40 62.390 ± 0.410 MgO 1.176 ± 0.020 4.033 ± 0.033 SO3 (*)2.710 ± 0.099 2.830 ± 0.021 Na2O 0.0914 ± 0.0052 1.068 ± 0.061 K2O 0.646 ± 0.014 0.206 ± 0.011 TiO2 0.236 ± 0.012 0.195 ± 0.014 P2O5 0.2443 ± 0.0027 0.1220 ± 0.0015 Mn2O3 0.1981 ± 0.002 0.0478 ± 0.0015 F 0.0539 ± 0.0012 0.13 Cl 0.0183 ± 0.00057 0.0040 ± 0.0005 ZnO 0.01054 ± 0.00034 0.0029 ± 0.0003 Cr2O3 (*)0.01927 ± 0.00042 0.0195 ± 0.0006 SrO 0.0272±0.0016 0.638±0.026 LOI 1.666±0.011 1.68 Total 100.49 100.18 (*)The uncertainty estimates for SO3 and Cr2O3 include an additional com- ponent of uncertainty of 2% (relative) to account for greater than expected heterogeneity observed during testing of the material after packaging. Open Access AJAC 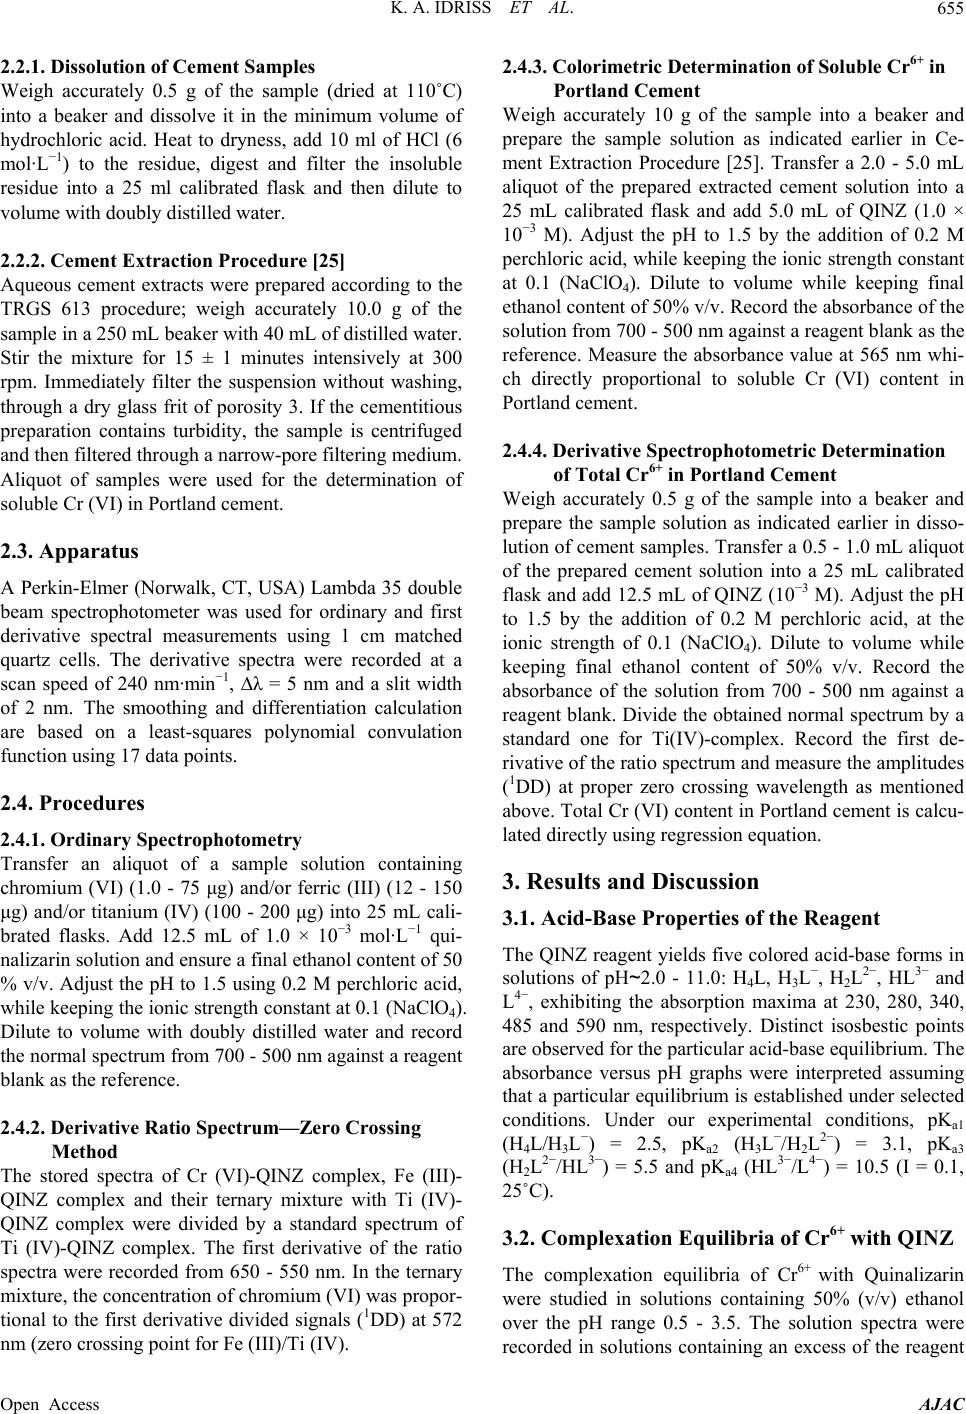 K. A. IDRISS ET AL. 655 2.2.1. Dissolution of Cement Samples Weigh accurately 0.5 g of the sample (dried at 110˚C) into a beaker and dissolve it in the minimum volume of hydrochloric acid. Heat to dryness, add 10 ml of HCl (6 mol·L−1) to the residue, digest and filter the insoluble residue into a 25 ml calibrated flask and then dilute to volume with doubly distilled water. 2.2.2. Cement Extraction Procedure [25] Aqueous cement extracts were prepared according to the TRGS 613 procedure; weigh accurately 10.0 g of the sample in a 250 mL beaker with 40 mL of distilled water. Stir the mixture for 15 ± 1 minutes intensively at 300 rpm. Immediately filter the suspension without washing, through a dry glass frit of porosity 3. If the cementitious preparation contains turbidity, the sample is centrifuged and then filtered through a narrow-pore filtering medium. Aliquot of samples were used for the determination of soluble Cr (VI) in Portland cement. 2.3. Apparatus A Perkin-Elmer (Norwalk, CT, USA) Lambda 35 double beam spectrophotometer was used for ordinary and first derivative spectral measurements using 1 cm matched quartz cells. The derivative spectra were recorded at a scan speed of 240 nm·min−1, ∆λ = 5 nm and a slit width of 2 nm. The smoothing and differentiation calculation are based on a least-squares polynomial convulation function using 17 data points. 2.4. Procedures 2.4.1. Ordinary Spectrophotometry Transfer an aliquot of a sample solution containing chromium (VI) (1.0 - 75 μg) and/or ferric (III) (12 - 150 μg) and/or titanium (IV) (100 - 200 μg) into 25 mL cali- brated flasks. Add 12.5 mL of 1.0 × 10⁻³ mol·L−1 qui- nalizarin solution and ensure a final ethanol content of 50 % v/v. Adjust the pH to 1.5 using 0.2 M perchloric acid, while keeping the ionic strength constant at 0.1 (NaClO4). Dilute to volume with doubly distilled water and record the normal spectrum from 700 - 500 nm against a reagent blank as the reference. 2.4.2. Derivative Ratio Spectrum—Zero Crossing Method The stored spectra of Cr (VI)-QINZ complex, Fe (III)- QINZ complex and their ternary mixture with Ti (IV)- QINZ complex were divided by a standard spectrum of Ti (IV)-QINZ complex. The first derivative of the ratio spectra were recorded from 650 - 550 nm. In the ternary mixture, the concentration of chromium (VI) was propor- tional to the first derivative divided signals (1DD) at 572 nm (zero crossing point for Fe (III)/Ti (IV). 2.4.3. Colorimetric Determination of Soluble Cr6+ in Portland Cement Weigh accurately 10 g of the sample into a beaker and prepare the sample solution as indicated earlier in Ce- ment Extraction Procedure [25]. Transfer a 2.0 - 5.0 mL aliquot of the prepared extracted cement solution into a 25 mL calibrated flask and add 5.0 mL of QINZ (1.0 × 10⁻³ M). Adjust the pH to 1.5 by the addition of 0.2 M perchloric acid, while keeping the ionic strength constant at 0.1 (NaClO4). Dilute to volume while keeping final ethanol content of 50% v/v. Record the absorbance of the solution from 700 - 500 nm against a reagent blank as the reference. Measure the absorbance value at 565 nm whi- ch directly proportional to soluble Cr (VI) content in Portland cement. 2.4.4. Derivative Spectrophotometric Determination of Total Cr6+ in Portland Cement Weigh accurately 0.5 g of the sample into a beaker and prepare the sample solution as indicated earlier in disso- lution of cement samples. Transfer a 0.5 - 1.0 mL aliquot of the prepared cement solution into a 25 mL calibrated flask and add 12.5 mL of QINZ (10−3 M). Adjust the pH to 1.5 by the addition of 0.2 M perchloric acid, at the ionic strength of 0.1 (NaClO4). Dilute to volume while keeping final ethanol content of 50% v/v. Record the absorbance of the solution from 700 - 500 nm against a reagent blank. Divide the obtained normal spectrum by a standard one for Ti(IV)-complex. Record the first de- rivative of the ratio spectrum and measure the amplitudes (1DD) at proper zero crossing wavelength as mentioned above. Total Cr (VI) content in Portland cement is calcu- lated directly using regression equation. 3. Results and Discussion 3.1. Acid-Base Properties of the Reagent The QINZ reagent yields five colored acid-base forms in solutions of pH~2.0 - 11.0: H4L, H3L−, H2L2−, HL3− and L4−, exhibiting the absorption maxima at 230, 280, 340, 485 and 590 nm, respectively. Distinct isosbestic points are observed for the particular acid-base equilibrium. The absorbance versus pH graphs were interpreted assuming that a particular equilibrium is established under selected conditions. Under our experimental conditions, pKa1 (H4L/H3L−) = 2.5, pKa2 (H3L−/H2L2−) = 3.1, pKa3 (H2L2−/HL3−) = 5.5 and pKa4 (HL3−/L4−) = 10.5 (I = 0.1, 25˚C). 3.2. Complexation Equilibria of Cr6+ with QINZ The complexation equilibria of Cr6+ with Quinalizarin were studied in solutions containing 50% (v/v) ethanol over the pH range 0.5 - 3.5. The solution spectra were recorded in solutions containing an excess of the reagent Open Access AJAC 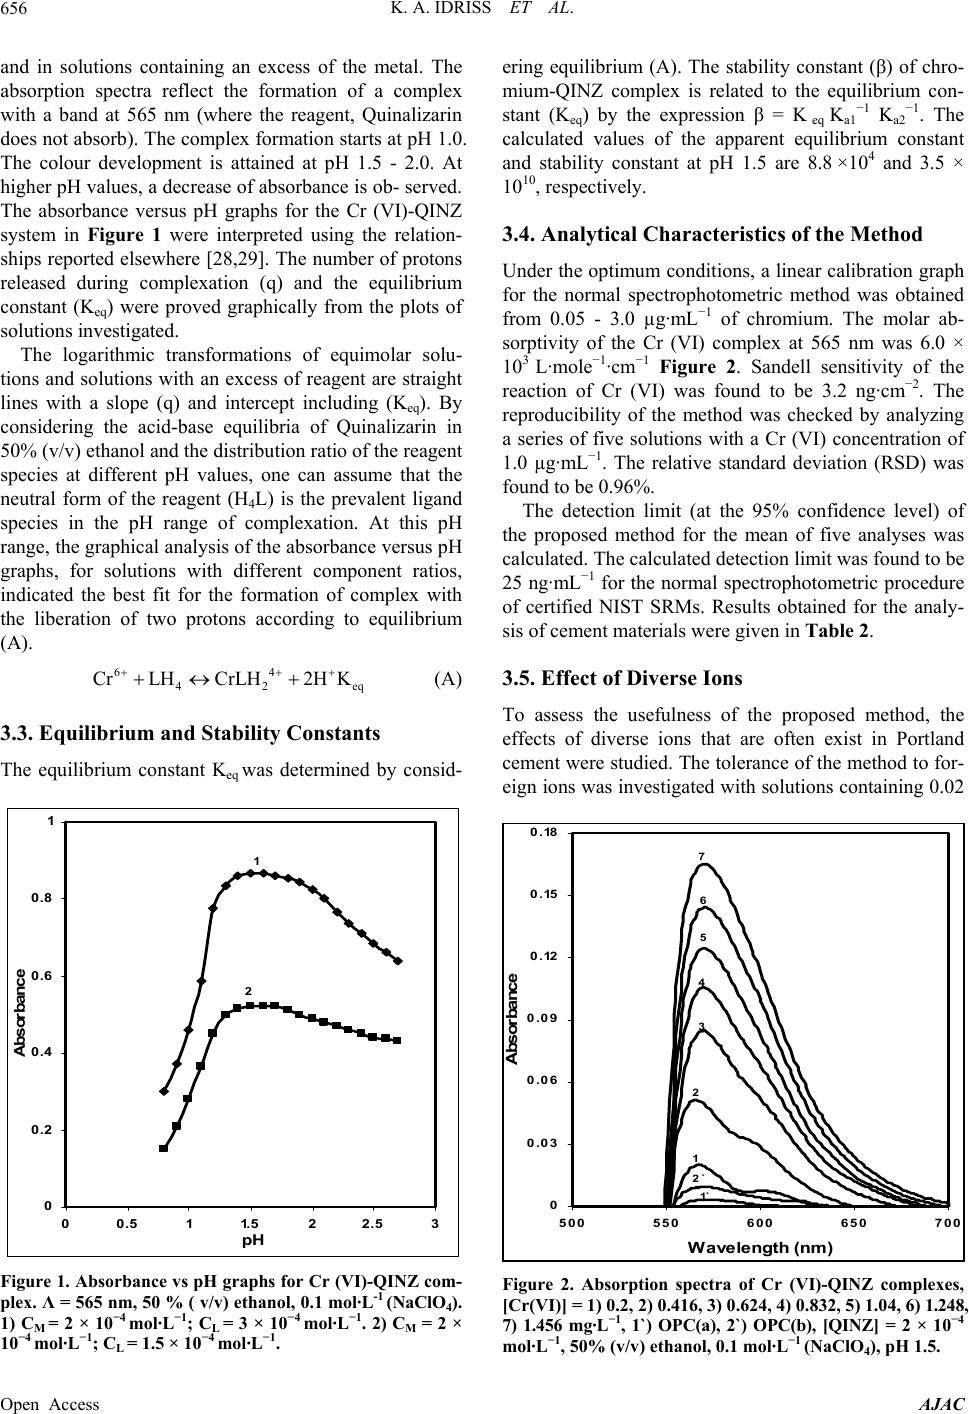 K. A. IDRISS ET AL. 656 and in solutions containing an excess of the metal. The absorption spectra reflect the formation of a complex with a band at 565 nm (where the reagent, Quinalizarin does not absorb). The complex formation starts at pH 1.0. The colour development is attained at pH 1.5 - 2.0. At higher pH values, a decrease of absorbance is ob- served. The absorbance versus pH graphs for the Cr (VI)-QINZ system in Figure 1 were interpreted using the relation- ships reported elsewhere [28,29]. The number of protons released during complexation (q) and the equilibrium constant (Keq) were proved graphically from the plots of solutions investigated. The logarithmic transformations of equimolar solu- tions and solutions with an excess of reagent are straight lines with a slope (q) and intercept including (Keq). By considering the acid-base equilibria of Quinalizarin in 50% (v/v) ethanol and the distribution ratio of the reagent species at different pH values, one can assume that the neutral form of the reagent (H4L) is the prevalent ligand species in the pH range of complexation. At this pH range, the graphical analysis of the absorbance versus pH graphs, for solutions with different component ratios, indicated the best fit for the formation of complex with the liberation of two protons according to equilibrium (A). 64 42 CrLHCrLH2H K eq (A) 3.3. Equilibrium and Stability Constants The equilibrium constant Keq was determined by consid- 0 0.2 0.4 0.6 0.8 1 00.5 11.522.5 3 pH Absorbance 1 2 Figure 1. Absorbance vs pH graphs for Cr (VΙ)-QINZ com- plex. Λ = 565 nm, 50 % ( v/v) ethanol, 0.1 mol·L-1 (NaClO4). 1) CM = 2 × 10⁻⁴ mol·L−1; CL = 3 × 10⁻⁴ mol·L−1. 2) CM = 2 × 10⁻⁴ mol·L−1; CL = 1.5 × 10⁻⁴ mol·L−1. ering equilibrium (A). The stability constant (β) of chro- mium-QINZ complex is related to the equilibrium con- stant (Keq) by the expression β = K eq Ka1 −1 K a2 −1. The calculated values of the apparent equilibrium constant and stability constant at pH 1.5 are 8.8 ×10⁴ and 3.5 × 10¹⁰, respectively. 3.4. Analytical Characteristics of the Method Under the optimum conditions, a linear calibration graph for the normal spectrophotometric method was obtained from 0.05 - 3.0 µg·mL−1 of chromium. The molar ab- sorptivity of the Cr (VI) complex at 565 nm was 6.0 × 10³ L·mole−1·cm−1 Figure 2. Sandell sensitivity of the reaction of Cr (VI) was found to be 3.2 ng·cm−2. The reproducibility of the method was checked by analyzing a series of five solutions with a Cr (VI) concentration of 1.0 µg·mL−1. The relative standard deviation (RSD) was found to be 0.96%. The detection limit (at the 95% confidence level) of the proposed method for the mean of five analyses was calculated. The calculated detection limit was found to be 25 ng·mL−1 for the normal spectrophotometric procedure of certified NIST SRMs. Results obtained for the analy- sis of cement materials were given in Table 2. 3.5. Effect of Diverse Ions To assess the usefulness of the proposed method, the effects of diverse ions that are often exist in Portland cement were studied. The tolerance of the method to for- eign ions was investigated with solutions containing 0.02 0 0.03 0.06 0.09 0.12 0.15 0.18 500 550 600 650 700 Wav elength (n m) Absorbance 1 2 3 4 5 6 7 1` 2` Figure 2. Absorption spectra of Cr (VI)-QINZ complexes, [Cr(VI)] = 1) 0.2, 2) 0.416, 3) 0.624, 4) 0.832, 5) 1.04, 6) 1.248, 7) 1.456 mg·L−1, 1`) OPC(a), 2`) OPC(b), [QINZ] = 2 × 10⁻⁴ mol·L−1, 50% (v/v) ethanol, 0.1 mol·L−1 (NaClO4), pH 1.5. Open Access AJAC 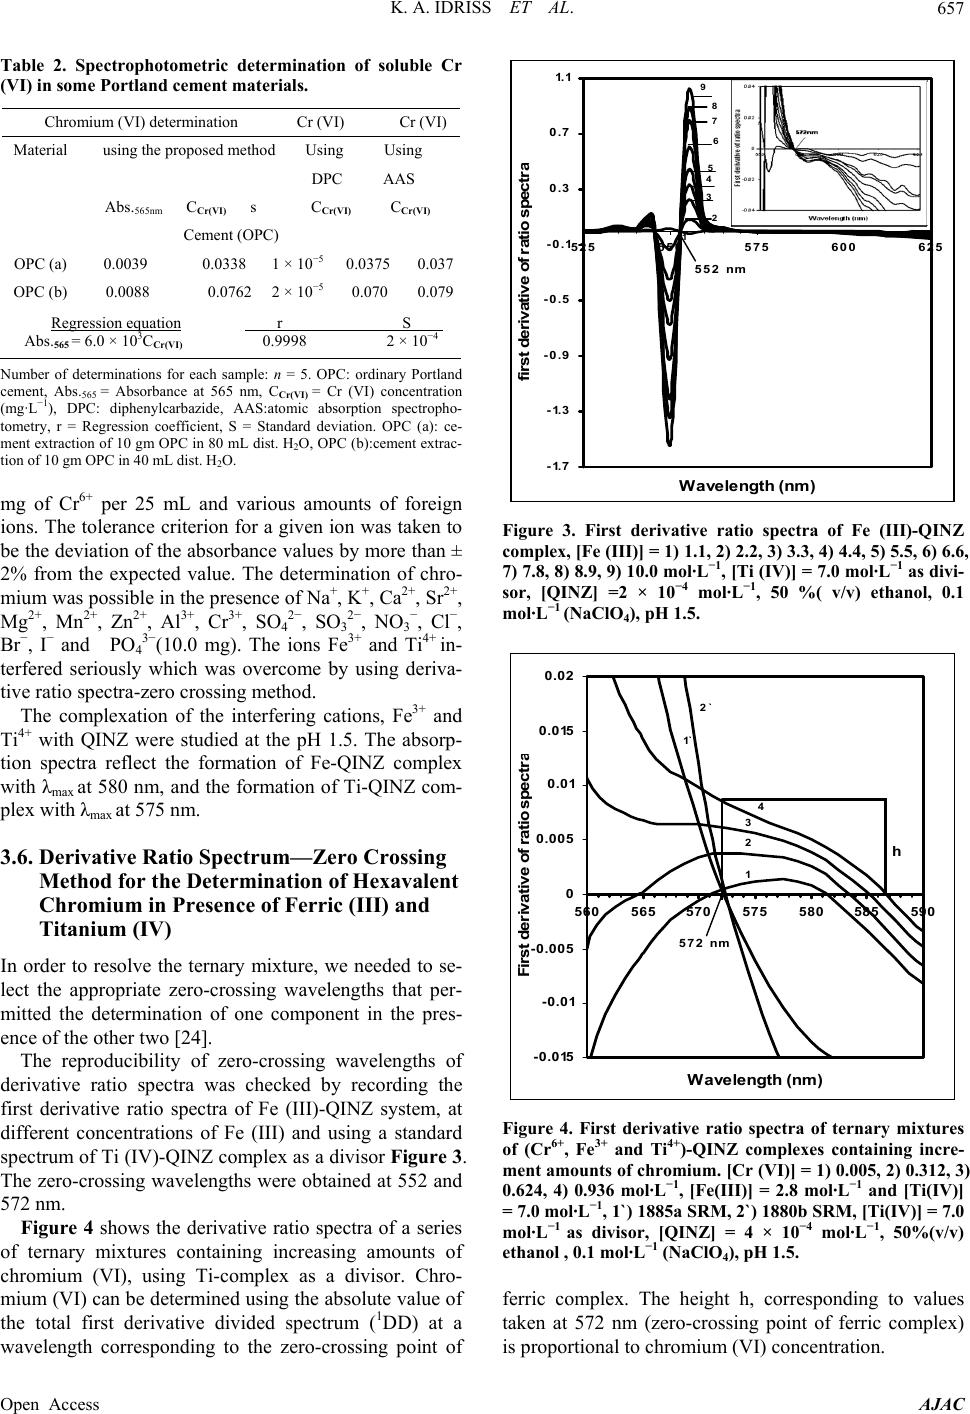 K. A. IDRISS ET AL. 657 Table 2. Spectrophotometric determination of soluble Cr (VI) in some Portland cement materials. Chromium (VI) determination Cr (VI) Cr (VI) Material using the proposed method Using Using DPC AAS Abs.565nm C Cr(VI) s C Cr(VI) C Cr(VI) Cement (OPC) OPC (a) 0.0039 0.0338 1 × 10⁻⁵ 0.0375 0.037 OPC (b) 0.0088 0.07622 × 10⁻⁵ 0.070 0.079 Regression equation r S Abs.565 = 6.0 × 10³CCr(VI) 0.9998 2 × 10⁻⁴ Number of determinations for each sample: n = 5. OPC: ordinary Portland cement, Abs.565 = Absorbance at 565 nm, CCr(VI) = Cr (VI) concentration (mg·L−1), DPC: diphenylcarbazide, AAS:atomic absorption spectropho- tometry, r = Regression coefficient, S = Standard deviation. OPC (a): ce- ment extraction of 10 gm OPC in 80 mL dist. H2O, OPC (b):cement extrac- tion of 10 gm OPC in 40 mL dist. H2O. mg of Cr6+ per 25 mL and various amounts of foreign ions. The tolerance criterion for a given ion was taken to be the deviation of the absorbance values by more than ± 2% from the expected value. The determination of chro- mium was possible in the presence of Na+, K+, Ca2+, Sr2+, Mg2+, Mn2+, Zn2+, Al3+, Cr3+, SO4 2−, SO3 2−, NO3 −, Cl−, Br−, I− and PO4 3−(10.0 mg). The ions Fe3+ and Ti4+ in- terfered seriously which was overcome by using deriva- tive ratio spectra-zero crossing method. The complexation of the interfering cations, Fe3+ and Ti4+ with QINZ were studied at the pH 1.5. The absorp- tion spectra reflect the formation of Fe-QINZ complex with λmax at 580 nm, and the formation of Ti-QINZ com- plex with λmax at 575 nm. 3.6. Derivative Ratio Spectrum—Zero Crossing Method for the Determination of Hexavalent Chromium in Presence of Ferric (III) and Titanium (IV) In order to resolve the ternary mixture, we needed to se- lect the appropriate zero-crossing wavelengths that per- mitted the determination of one component in the pres- ence of the other two [24]. The reproducibility of zero-crossing wavelengths of derivative ratio spectra was checked by recording the first derivative ratio spectra of Fe (III)-QINZ system, at different concentrations of Fe (III) and using a standard spectrum of Ti (IV)-QINZ complex as a divisor Figure 3. The zero-crossing wavelengths were obtained at 552 and 572 nm. Figure 4 shows the derivative ratio spectra of a series of ternary mixtures containing increasing amounts of chromium (VI), using Ti-complex as a divisor. Chro- mium (VI) can be determined using the absolute value of the total first derivative divided spectrum (1DD) at a wavelength corresponding to the zero-crossing point of -1.7 -1.3 -0.9 -0.5 -0.1 0.3 0.7 1.1 525 550 575 600 625 Wavelength (nm) first d erivati ve o f ratio sp ectr a 552 nm 1 2 3 4 5 6 7 8 9 Figure 3. First derivative ratio spectra of Fe (III)-QINZ complex, [Fe (III)] = 1) 1.1, 2) 2.2, 3) 3.3, 4) 4.4, 5) 5.5, 6) 6.6, 7) 7.8, 8) 8.9, 9) 10.0 mol·L−1, [Ti (IV)] = 7.0 mol·L−1 as divi- sor, [QINZ] =2 × 10⁻⁴ mol·L−1, 50 %( v/v) ethanol, 0.1 mol·L−1 (NaClO4), pH 1.5. -0.015 -0.01 -0.005 0 0.005 0.01 0.015 0.02 560 565570 575 580585 590 Wav eleng th (nm) F irst d erivative o f ratio sp ectr a 1 2 3 4 1` 2` h 572 nm Figure 4. First derivative ratio spectra of ternary mixtures of (Cr6+, Fe3+ and Ti4+)-QINZ complexes containing incre- ment amounts of chromium. [Cr (VI)] = 1) 0.005, 2) 0.312, 3) 0.624, 4) 0.936 mol·L−1, [Fe(III)] = 2.8 mol·L−1 and [Ti(IV)] = 7.0 mol·L−1, 1`) 1885a SRM, 2`) 1880b SRM, [Ti(IV)] = 7.0 mol·L−1 as divisor, [QINZ] = 4 × 10⁻⁴ mol·L−1, 50%(v/v) ethanol , 0.1 mol·L−1 (NaClO4), pH 1.5. ferric complex. The height h, corresponding to values taken at 572 nm (zero-crossing point of ferric complex) is proportional to chromium (VI) concentration. Open Access AJAC 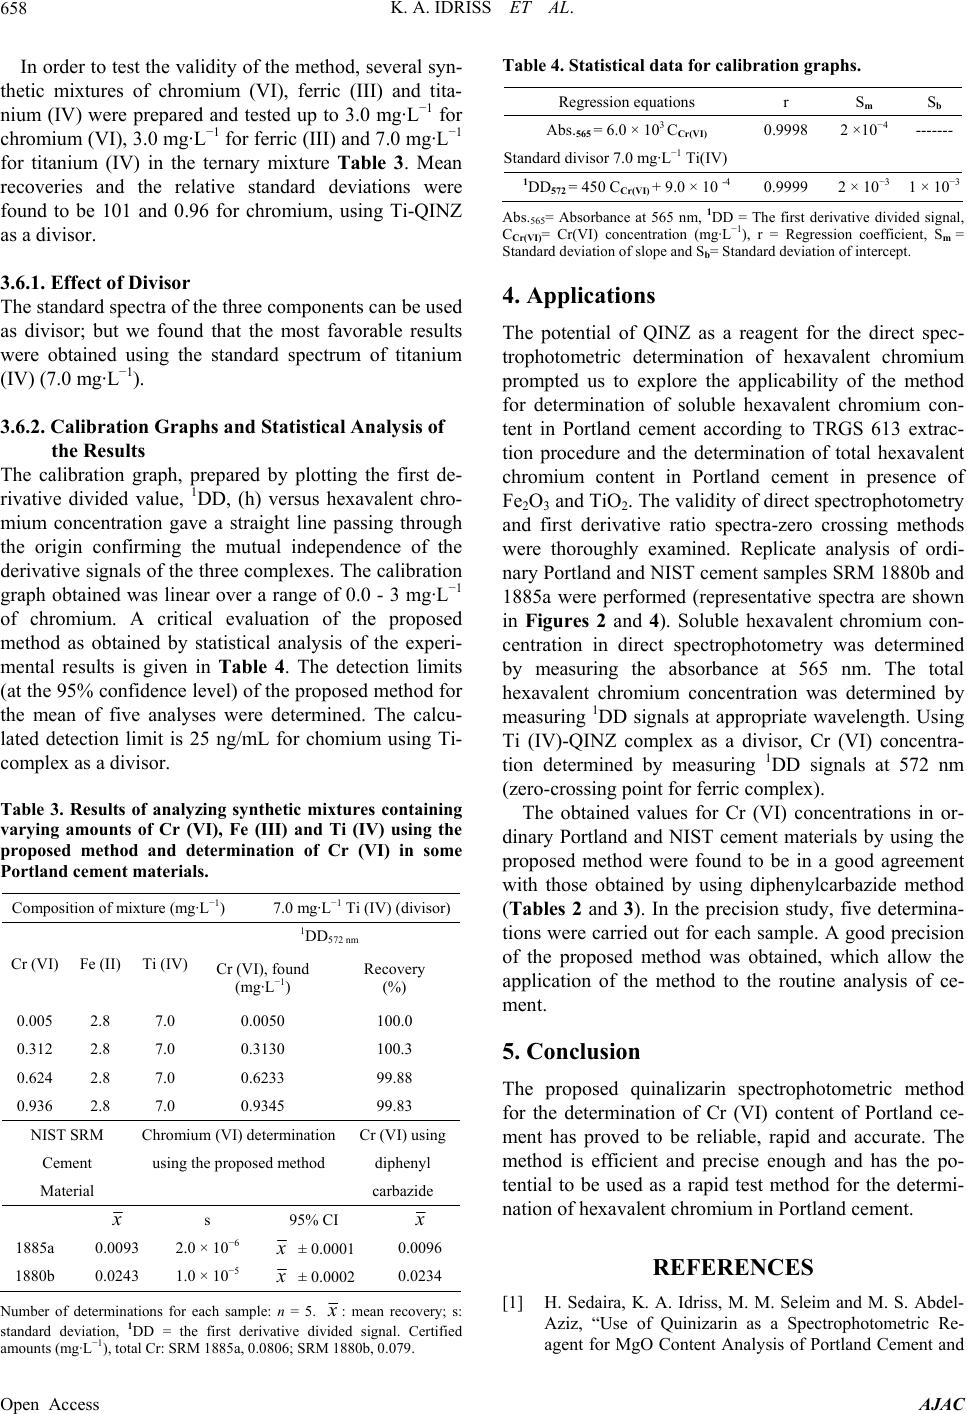 K. A. IDRISS ET AL. 658 In order to test the validity of the method, several syn- th 3.6.1. Effect of Divisor e three components can be used 3.6.2. Calibration Graphs and Statistical Analysis of The cph, prepared by plotting the first de- able 3. Results of analyzing synthetic mixtures containing ) 7.0 mg·L−1 Ti (IV) (divisor) etic mixtures of chromium (VI), ferric (III) and tita- nium (IV) were prepared and tested up to 3.0 mg·L−1 for chromium (VI), 3.0 mg·L−1 for ferric (III) and 7.0 mg·L−1 for titanium (IV) in the ternary mixture Table 3. Mean recoveries and the relative standard deviations were found to be 101 and 0.96 for chromium, using Ti-QINZ as a divisor. The standard spectra of th as divisor; but we found that the most favorable results were obtained using the standard spectrum of titanium (IV) (7.0 mg·L−1). the Results alibration gra rivative divided value, 1DD, (h) versus hexavalent chro- mium concentration gave a straight line passing through the origin confirming the mutual independence of the derivative signals of the three complexes. The calibration graph obtained was linear over a range of 0.0 - 3 mg·L−1 of chromium. A critical evaluation of the proposed method as obtained by statistical analysis of the experi- mental results is given in Table 4. The detection limits (at the 95% confidence level) of the proposed method for the mean of five analyses were determined. The calcu- lated detection limit is 25 ng/mL for chomium using Ti- complex as a divisor. T varying amounts of Cr (VI), Fe (III) and Ti (IV) using the proposed method and determination of Cr (VI) in some Portland cement materials. Composition of mixture (mg·L−1 1DD572 nm Cr (VI) Fe (II) Ti (IV) Cr (VI), founy 0.005 2.8 7.0 0 SRCium (VIation sing d Recover (mg·L−1) (%) 0.005 100.0 0.312 2.8 7.0 0.3130 100.3 0.624 2.8 7.0 0.6233 99.88 0.936 2.8 7.0 0.9345 99.83 NISTM hrom) determinCr (VI) u Cement using the proposed method diphenyl Material carbazide x s 95% CI x 1885a 0.0093 2.0 × 10⁻⁶x ± 0.0001 0.0096 1880b 0.0243 1.0 × 10⁻⁵x ± 0.0002 0.0234 Nf detns fmple: n umber oerminatioor each sa= 5. x: mean rs: id 1 S b ecovery; standard deviation, 1DD = the first derivative dived signal. Certified amounts (mg·L−1), total Cr: SRM 1885a, 0.0806; SRM880b, 0.079. Table 4. Statistical data for calibration graphs. Regression equations r Sm A) 0.9998 2 4 -bs.565 = 6.0 × 10³ CCr(VI ×10−------ Stand 0.9999 2 × 10⁻³ 1 × 10⁻³ ard divisor 7.0 mg·L−1 Ti(IV) 1DD572 = 450 CCr(VI) + 9.0 × 10 -4 Ab = Terid C), r ssion ffici= Z as a reagent for the direct spec- nclusion nalizarin spectrophotometric method REFERENCES [1] H. Sedaira, K. and M. S. Abdel- s.565= Absorbance at 565 nm, 1DD = Cr(VI) concentration (m−1 he first d = Regre vative divi coe ed signal, ent, S Cr(VI) g·L m Standard deviation of slope and Sb= Standard deviation of intercept. 4. Applications The potential of QIN trophotometric determination of hexavalent chromium prompted us to explore the applicability of the method for determination of soluble hexavalent chromium con- tent in Portland cement according to TRGS 613 extrac- tion procedure and the determination of total hexavalent chromium content in Portland cement in presence of Fe2O3 and TiO2. The validity of direct spectrophotometry and first derivative ratio spectra-zero crossing methods were thoroughly examined. Replicate analysis of ordi- nary Portland and NIST cement samples SRM 1880b and 1885a were performed (representative spectra are shown in Figures 2 and 4). Soluble hexavalent chromium con- centration in direct spectrophotometry was determined by measuring the absorbance at 565 nm. The total hexavalent chromium concentration was determined by measuring 1DD signals at appropriate wavelength. Using Ti (IV)-QINZ complex as a divisor, Cr (VI) concentra- tion determined by measuring 1DD signals at 572 nm (zero-crossing point for ferric complex). The obtained values for Cr (VI) concentrations in or- dinary Portland and NIST cement materials by using the proposed method were found to be in a good agreement with those obtained by using diphenylcarbazide method (Tables 2 and 3). In the precision study, five determina- tions were carried out for each sample. A good precision of the proposed method was obtained, which allow the application of the method to the routine analysis of ce- ment. 5. Co The proposed qui for the determination of Cr (VI) content of Portland ce- ment has proved to be reliable, rapid and accurate. The method is efficient and precise enough and has the po- tential to be used as a rapid test method for the determi- nation of hexavalent chromium in Portland cement. A. Idriss, M. M. Seleim Aziz, “Use of Quinizarin as a Spectrophotometric Re- agent for MgO Content Analysis of Portland Cement and Open Access AJAC 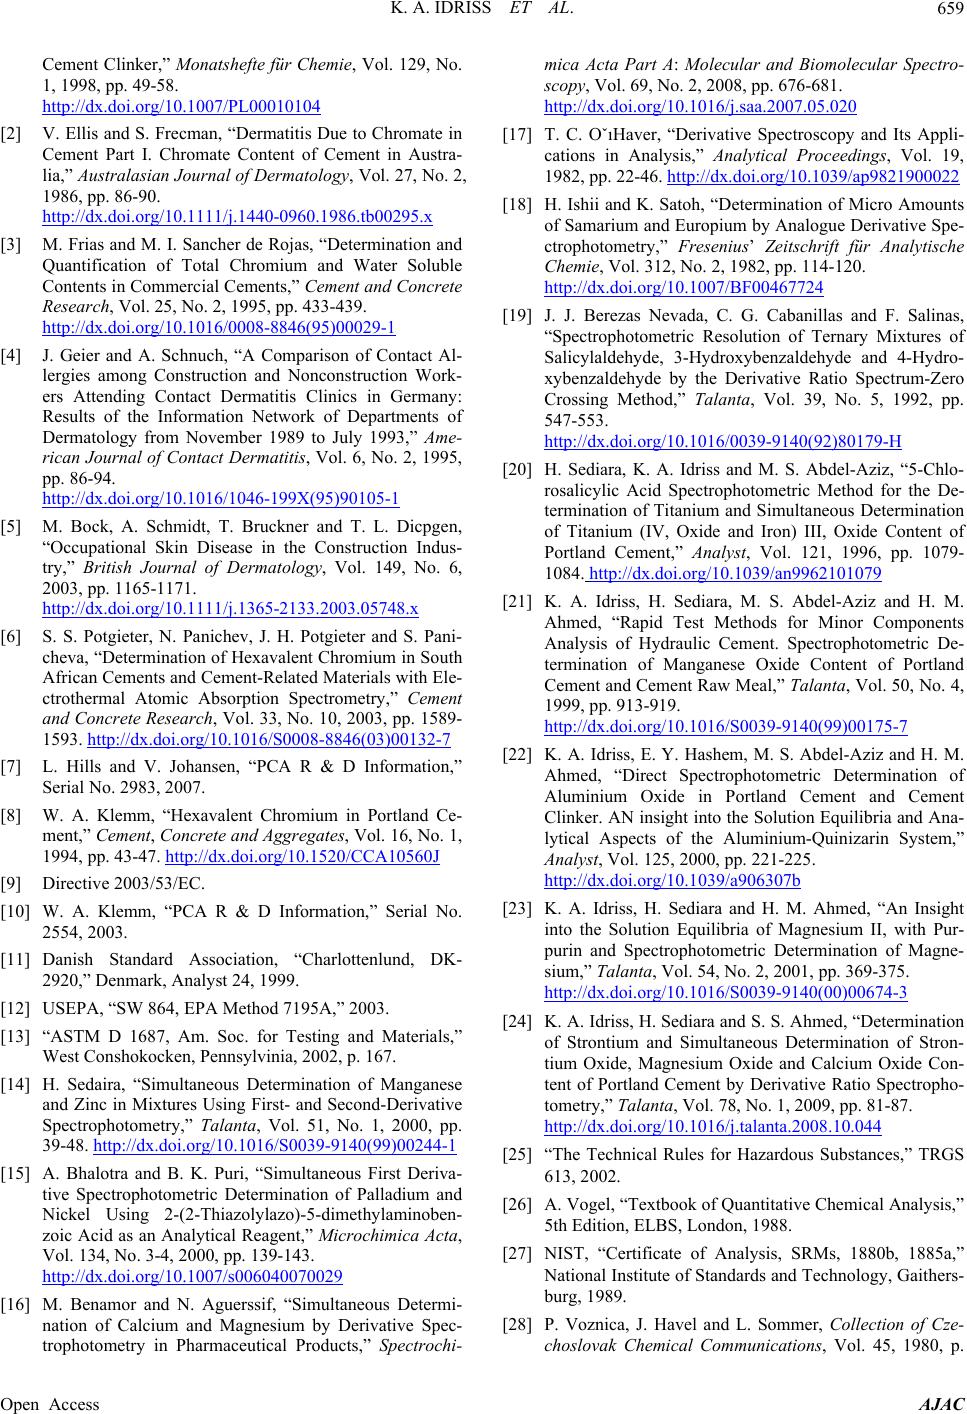 K. A. IDRISS ET AL. 659 Cement Clinker,” Monatshefte für Chemie, Vol. 129, No. 1, 1998, pp. 49-58. http://dx.doi.org/10.1007/PL00010104 [2] V. Ellis and S. Frecman, “Dermatitis Due Cement Part I. Chromate Content of C to Chromate in ement in Austra- lia,” Australasian Journal of Dermatology, Vol. 27, No. 2, 1986, pp. 86-90. http://dx.doi.org/10.1111/j.1440-0960.1986.tb00295.x [3] M. Frias and M. I. Sancher de Rojas, “Determination and Quantification of Total Chromium and Water Solub le Contents in Commercial Cements,” Cement and Concrete Research, Vol. 25, No. 2, 1995, pp. 433-439. http://dx.doi.org/10.1016/0008-8846(95)00029-1 [4] J. Geier and A. Schnuch, “A Comparison of Contact Al- lergies among Construction and Nonconstruction Work- ers Attending Contact Dermatitis Clinics in Germany: Results of the Information Network of Departments of Dermatology from November 1989 to July 1993,” Ame- rican Journal of Contact Dermatitis, Vol. 6, No. 2, 1995, pp. 86-94. http://dx.doi.org/10.1016/1046-199X(95)90105-1 [5] M. Bock, A. Schmidt, T. Bruckner and T. L. Dicpgen, “Occupational Skin Disease in the Construction Indus- try,” British Journal of Dermatology, Vol. 149, No. 6, 2003, pp. 1165-1171. http://dx.doi.org/10.1111/j.1365-2133.2003.05748.x [6] S. S. Potgieter, N. Panichev, J. H. Potgieter and S. P cheva, “Determination of Hexavalent Chromium in S ani- outh African Cements and Cement-Related Materials with Ele- ctrothermal Atomic Absorption Spectrometry,” Cement and Concrete Research, Vol. 33, No. 10, 2003, pp. 1589- 1593. http://dx.doi.org/10.1016/S0008-8846(03)00132-7 [7] L. Hills and V. Johansen, “PCA R & D Information,” Serial No. 2983, 2007. [8] W. A. Klemm, “Hexavalent Chromium in Portland Ce- ment,” Cement, Concrete and Aggregates, Vol. 16, No. 1, 1994, pp. 43-47. http://dx.doi.org/10.1520/CCA10560J [9] Directive 2003/53/EC. tion,” Serial No. [10] W. A. Klemm, “PCA R & D Informa 2554, 2003. [11] Danish Standard Association, “Charlottenlund, DK- 2920,” Denmark, Analyst 24, 1999. terials,” rivative [12] USEPA, “SW 864, EPA Method 7195A,” 2003. [13] “ASTM D 1687, Am. Soc. for Testing and Ma West Conshokocken, Pennsylvinia, 2002, p. 167. [14] H. Sedaira, “Simultaneous Determination of Manganese and Zinc in Mixtures Using First- and Second-De Spectrophotometry,” Talanta, Vol. 51, No. 1, 2000, pp. 39-48. http://dx.doi.org/10.1016/S0039-9140(99)00244-1 [15] A. Bhalotra and B. K. Puri, “Simultaneous First Deriva- tive Spectrophotometric Determination of Palladium and Nickel Using 2-(2-Thiazolylazo)-5-dimethylaminoben- zoic Acid as an Analytical Reagent,” Microchimica Acta, Vol. 134, No. 3-4, 2000, pp. 139-143. http://dx.doi.org/10.1007/s006040070029 [16] M. Benamor and N. Aguerssif, “Simulta nation of Calcium and Magnesium by D neous De erivative Spec- termi- trophotometry in Pharmaceutical Products,” Spectrochi- mica Acta Part A: Molecular and Biomolecular Spectro- scopy, Vol. 69, No. 2, 2008, pp. 676-681. http://dx.doi.org/10.1016/j.saa.2007.05.020 [17] T. C. OˇıHaver, “Derivative Spectroscopy and I cations in Analysis,” Analytical Proceedints Appli- gs, Vol. 19, 1982, pp. 22-46. http://dx.doi.org/10.1039/ap9821900022 [18] H. Ishii and K. Satoh, “Determination of Micro Amounts of Samarium and Europium by Analogue Derivative Spe- ctrophotometry,” Fresenius’ Zeitschrift für Analytische Chemie, Vol. 312, No. 2, 1982, pp. 114-120. http://dx.doi.org/10.1007/BF00467724 [19] J. J. Berezas Nevada, C. G. Cabanillas and “Spectrophotometric Resolution of Ter F. Salinas, nary Mixtures of Salicylaldehyde, 3-Hydroxybenzaldehyde and 4-Hydro- xybenzaldehyde by the Derivative Ratio Spectrum-Zero Crossing Method,” Talanta, Vol. 39, No. 5, 1992, pp. 547-553. http://dx.doi.org/10.1016/0039-9140(92)80179-H [20] H. Sediara, K. A. Idriss and M. S. Abdel-Aziz, “5-Chlo- rosalicylic Acid Spectrophotometric Method for the De- termination of Titanium and Simultaneous Determination of Titanium (IV, Oxide and Iron) III, Oxide Content of Portland Cement,” Analyst, Vol. 121, 1996, pp. 1079- 1084. http://dx.doi.org/10.1039/an9962101079 [21] K. A. Idriss, H. Sediara, M. S. Abdel-Aziz and H. M. Ahmed, “Rapid Test Methods for Minor Components Analysis of Hydraulic Cement. Spectrophotometric De- termination of Manganese Oxide Content of Portland Cement and Cement Raw Meal,” Talanta, Vol. 50, No. 4, 1999, pp. 913-919. http://dx.doi.org/10.1016/S0039-9140(99)00175-7 [22] K. A. Idriss, E. Y. Hashem, M. S. Abdel-Aziz and H. M. Ahmed, “Direct Spectrophotometric Determination of Aluminium Oxide in Portland Cement and Cement Clinker. AN insight into the Solution Equilibria and Ana- lytical Aspects of the Aluminium-Quinizarin System,” Analyst, Vol. 125, 2000, pp. 221-225. http://dx.doi.org/10.1039/a906307b [23] K. A. Idriss, H. Sediara and H. M. Ah into the Solution Equilibria of Mag med, “An Insight nesium II, with Pur- purin and Spectrophotometric Determination of Magne- sium,” Talanta, Vol. 54, No. 2, 2001, pp. 369-375. http://dx.doi.org/10.1016/S0039-9140(00)00674-3 [24] K. A. Idriss, H. Sediara and S. S. Ahmed, “Determin of Strontium and Simultaneous Determination of Stron- ation tium Oxide, Magnesium Oxide and Calcium Oxide Con- tent of Portland Cement by Derivative Ratio Spectropho- tometry,” Talanta, Vol. 78, No. 1, 2009, pp. 81-87. http://dx.doi.org/10.1016/j.talanta.2008.10.044 [25] “The Technical Rules for Hazardous Substances,” T 613, 2002. RGS ELBS, London, 1988. Technology, Gaithers- hemical Communications, Vol. 45, 1980, p. [26] A. Vogel, “Textbook of Quantitative Chemical Analysis,” 5th Edition, [27] NIST, “Certificate of Analysis, SRMs, 1880b, 1885a,” National Institute of Standards and burg, 1989. [28] P. Voznica, J. Havel and L. Sommer, Collection of Cze- choslovak C Open Access AJAC  K. A. IDRISS ET AL. Open Access AJAC 660 ctrophotometric Study of the Complexation Equilib-643 54. [29] K. A. Idriss, M. Saleh, M. Abu-Bakr and H. Sedaira, “Spe ria of Zirconium IV, with 1-Amino-4-hydroxyanthraqui- none and the Determination of Zirconium,” Analyst, Vol. 113, No. 11, 1988, pp. 1643-1647. http://dx.doi.org/10.1039/an9881301 |