

Paper Menu >>
Journal Menu >>
 Vol.5, No.11B, 35-42 (2013) Health http://dx.doi.org/10.4236/health.2013.511A2006 Availability and accessibility of diabetes clinics on Trinidad: An analysis using proximity tools in a GIS environment Patricia Boda Department of Geosciences, Middle Tennessee State University, Murfreesboro, USA; [email protected] Received 16 August 2013; revised 25 September 2013; accepted 8 October 2013 Copyright © 2013 Patricia Boda. This is an open access article distributed under the Creative Commons Attribution License, which permits unrestricted use, distribution, and reproduction in any medium, provided the original work is properly cited. ABSTRACT Non-communicable diseases (NCDs), account for a growing number of deaths worldwide. The English-speaking Caribbean has the highest per capita burden of NCDs in the region of the Americas [1]. This p aper presents an overview of availability and accessibility based on clinic hours and physician fulltime equivalents (FTE) on the island of Trinidad devoted to diabetes and wound care. The project integrates a Geo- graphic Information System (GIS) with epidemi- ologic and bio-statistical data to provide a nec- essary spatial analysis not otherwise possible. It examines the island’s ability to effectively de- liver treatment to re siden ts with diabetes by pro- viding a geographic perspective to data pub- lished on the internet by the Trinidad-Tobago Ministry of Health and the Central Statistical Of- fice. Results indicate a significant regional vari- ability in both numbers of physicians and office hours devoted to diabe tes treatment. Keyw ords: Access; Health Care; Caribbean; Trinidad; Diabetes 1. INTRODUCTION Non-communicable diseases (NCDs) are now the leading causes of deaths worldwide. In fact, heart dis- ease, cancer, chronic respiratory diseases and diabetes account for 63% of all deaths [2]. Although the percep- tion is that NCDs primarily affect wealthy nations, nearly 80% of NCD deaths occur in low- and middle-income countries [1,2]. The English-speaking Caribbean has the highest per capita burden of chronic non-communicable diseases (CNCDs) in the region of the Americas [1]. Cardiovascular disease, cancer, diabetes, and chronic res- piratory disease account for 71% of all deaths in Latin America and the Caribbean in 2008 and that rate is ex- pected to rise to 81% by 2030 [2]. For the most part, these countries have passed through the demographic and epidemiological transition which has resulted in rapidly aging populations who are more prone to chronic illness. Research concerning health in the Caribbean is some- what limited as it is often linked with Latin America [3-5]. A portion of the work that has been produced on NCDs in the Caribbean has called for increased aware- ness and prioritization of combatting the epidemic rise of NCDs in the region [6,7] and strategies to be incorporated into public policy [8 ]. A fair vo lume of research has been based on surveys of self-reported prevalence of non- communicable or chronic diseases [9-12]. These studies examined indicators affecting negative health status such as rural residence, age, gender and level of education, and have been conducted in various countries. A key factor affecting health status is the ability for a patient to visit a health care facility. The more often a patient re- ceives an examinatio n, the better health is believe d to be. However, in many Caribbean countries, it has been do- cumented that patients are often dissatisfied with treat- ment and are less likely to see a provider to manage their chronic illness [13]. In these studies, patients reported excessive wait times and too little time with providers. The particular interest to this study is work regarding diabetes in the Caribbean, specifically research con- ducted on diabetes in Trinidad. Although much research is focused on epidemiological, diagnostic or treatment procedures [14-17], there are four primary areas of addi- tional relevant research: 1) prevalence, 2) socioeconomic factors, 3) economic impacts, and 4) efficacy of treat- ments, in particular, treatment of foot wounds. Attempts to define the prevalence of diabetes on Trinidad and To- bago have produced interesting results. Early research of diabetes in Trinidad included a study by Ariyanayagam- Baksh in 1995, which reported that during a six-month Copyright © 2013 SciRes. OPEN A CCESS  P. Boda / Health 5 (2013) 35-42 36 period at Port of Spain General Hospital, 1447 patients with diabetes accounted for 1722 admissions. This ac- counted for 13.6% of hospital admissions and 23% of hospital bed occupancy in 1995, demonstrating the large burden of illness carries in Trinidad and Tobago [18]. In 1997, Guilliford found similar nu mbers of admission due to diabetes during another six-month period [19]. How- ever, neither of these studies included data on the number of new cases nor repeated patients since the Ministry of Health did not report that information. More recent attempts to determine prevalence rates of diabetes on Trinidad produced varied results. Chadee et al. determined self-reported prevalence of diabetes in 2008-2009 to be 19.5% [12] while Nicholls stated the rate was closer to 11% in 2010 [20] and WHO reported the figure to be approximately 14% in 2011 [1]. Regard- less of the exact number, diabetes is now the second leading cause of death and the leading cause of blindness in Trinidad and Tobago [20]. Recently released epide- miological information on diabetes in Trinidad and To- bago reveals that 1 in 4 hospital admissions is attributed to diabetes. There were 1000 new cases diagnosed in persons aged 20 years or older in 2007. Trinidad and Tobago had the highest per capita rate of diabetes in the Western Hemisphere and ranked 5th in the world in that category [20]. Socioeconomic studies have documented the differ- ences between the two dominant ethnic groups and be- tween wealthy and lower income groups in the country. Ariyanayagam-Baksh reported that hospital admission rates were 33% higher in the Indian origin population and 47% lower in those of mixed ethnicity than those of Af- rican ancestry, suggesting ethnic associations exist [18]. These differences are significant since approximately 45% of the population is of Indian ancestry and 45% is of African ancestry. Guilliford’s study concluded that prevalence and morbidity from diabetes were signifi- cantly greater in groups with lower socioeconomic status and lower educational achievement [19]. This is signifi- cant because although Trinidad and Tobago is consid- ered as a high income country by the World Bank, much of the population is of relatively lower income. The economic consequence of diabetes has an enor- mous impact on Trinidad-Tobago as well. Ariyanaya- gam-Baksh estimated that the annual cost of admissions with diabetes was conservatively estimated at TT$ 10.66 million in 1995 [18]. More recently, the cost has been estimated at $49,335,000 (TT$296,010,000) as reported by Nicholls. However, Nicholls pointed out that the $49,335,000 likely represented only direct costs. If indi- rect costs, such as loss of earnings due to illness or pre- mature death, disability payments, time lost from work, and so forth, are factored in, the economic debacle as- sumes even graver proportions with more negative im- pacts on GDP [20]. Effective treatment options are important aspects to manage chronic illness and several studies have been conducted on various elements of diabetes treatment in Trinidad and Tobago. Popularity and value of traditional medicines were examined by Mahabir and Guilliford 1997 [21], and more recently by Motilal and Maharaj in 2012, both reported inconclusive results [22]. While some patients experienced improvement with some treat- ments, others did not. With few exceptions, little attention has been paid to the importance of patient self-manage- ment strategies. Self-management practices of monitor- ing chronic illnesses are very effective in reducing the economic burden and reducing hospital loads [23,24]. Because one serious and common complication of dia- betes is foot wound which often results in amputation, availability of effective wound treatments and foot clin- ics are important areas of concern [25,26]. While there have been many important publications on diabetes in Trinidad, little if any atten tion has been given to the network of hospitals and providers available to treat the thousands of persons with diabetes in Trinidad and Tobago. A geographic or spatial approach is an es- sential component when attempting to redu ce the number or treat populations with diabetes. Such an analysis of access to services has been conspicuously absent from published research. This study attempts to fill this void by examining the level of available diabetes care based on established health districts and amount of clinic hours devoted to the treatment of diabetes. It presents an over- view of facility services on the island of Trinidad. Data were entered into ArcMap. Distances and populations to provider ratios were calculated. The process revealed that there were significant deficits in access to ser vices locally, regionally among the four health districts, and nationally. 2. DATA SOURCES AND METHODS Community shapefiles with 2000 populations, streets and community boundaries were provided by The Uni- versity of the West Indies, St. Augustine. Community files for Tobago were not included and therefore Tobago is not represented in this study. Data on public clinic locations, street name and com- munity as well as diabetes specific clinic hours were ac- cessed from the Ministry of Health (MOH) website. The Ministry also included a schedule of clinic times devoted to particular conditions such as pre-natal, ante-natal, chronic disease, diabetes and wound care. However, clinic schedules only included “morning session” or “af- ternoon session” without a specific listing of times. Therefore it was assumed the morning session was 4 hours and the af ternoon was 4 hours in length. Each clinic schedule was examined and clinic times devoted specifically to “wound care” and “diabetes Copyright © 2013 SciRes. OPEN A CCESS  P. Boda / Health 5 (2013) 35-42 37 clinic” were calculated according to the following stan- dards: If morning hours stated only wound care or diabetes clinic the entire 4 hour morning clinic was entered into the calculations for diabetes clinics; If morning schedule indicated wound care or diabetes clinic but also displayed other clinics such as pre-natal, ante-natal, primary care, or any other clinic, the time devoted to diabetes and wound care was divided propor- tionally am ong the number of other clinic ho urs. Clinic hours devoted to wound and diabetes care were calculated by clinic, by district and n ationally. Clinic locations, hours of diabetes treatment and com- munity data were entered into ArcMAp 10 .0 for analysis and were manually placed on the community maps ac- cording to the following method: The community was located on the community shape- file map using “select by attribute” for the community name. Street names for the clinics were located by the same method, and the clinics were laced on the correct street, in the correct community by placing the clinic in the middle of the street. Hours of diabetes and wound care clinics were added and divided by 40 hours to produce a full time equivalent (FTE) for the provider. It was not stated if the clinic ser- vices were provided by a physician or another trained professional such as nurse, so the assumption was made that care was provided by a single physician. Proximity was determined by applying buffers and Theissen Polygons. Six clinics were not entered because no street name was provided, no community name was provided, or there was no schedule of hours provided. 3. AVAILABILITY AND ACCESSIBILITY TO DIABETES CLINICS In order to effectively reduce the burden of diabetes in Trinidad, there must be a threefold approach that includes surveillance, prevention, and intervention. Surveillance consists of monitoring exposures (risk factors), monitor- ing outcomes. Prevention includes addressing exposures (risk factors) and enlisting education. Intervention and treatment examines levels of availability by assessing health system capacity and o access to services. Access can be difficult to define as it is a multi-di- mensional concept that evaluates the ability of a popula- tion to use medical services [27]. Penchansky and Tho- mas identified five dimensions that identify specific bar- riers: availability, accessibility, accommodation, afforda- bility, and acceptability. Availability defines numbers of providers such as physicians, dentists, nurses and other health care workers in relation to the demand for their services. It also includes numbers of hospital beds and services that facilities provide. Accessibility generally describes geographic accessibility and identifies the geo- graphic barriers to receiving such services such as dis- tance, transportation, and travel time to the facility. Ac- commodation refers to the degree that services meet the needs of patients and include hours of service, waiting times, appointments and scheduling. Affordability dis- cusses the cost of services an d acceptability describes how the provider interacts with the pa tient on a personal leve l. Acceptability includes potential barriers such as gender, ethnicity, language and sexual orientation but also en- compasses patient satisfaction [28]. Each dimension can obstruct access by creating barriers that limit utilization of services. This study utilizes the Penchansky and Thomas definitions of “availability” and “accessibility”. 3.1. Provider Availability by Health District Define Availability defines numbers of providers in re- lation to the demand for their services and includes num- bers of services that facilities provide. The map of Trini- dad in Figure 1, displays community populations by health district. It also reveals that clinics are located fairly unevenly on the island and clinics with higher numbers of hours devoted to diabetes care are shown with larger circles. Several clinics had zero hours sched- uled. In this study, assessment of the number of providers was based on scheduled hours devoted to diabetes care or wound care. Clinic hours devoted to diabetes and wound care ranged from zero to twelve hours per week at the Cumuto Clinic This was the only clinic with twelve hours scheduled per week. The clinic is located in the Eastern Health District and is identified in Figure 1 by the yellow cross. Calculations of the Full Time Equivalents (FTE) for the providers reveal significant differences among the four health districts. Of the 14 clinics in Northwest Dis- trict only 3 clinics reported to have diabetes/wound care hours scheduled. The 3 clinics had a total of 13 hours per week scheduled. Two clinics had 4 hours per week and 1 clinic had 5 hours. The 13 hours per week calculates to be 0.325 FTE. In the North Central district 8 of the 10 clinics had diabetes care scheduled. Hours ranged from 2 to 8 hours per week and totaled 50 hours per week re- sulting in an FTE of 1.25. The Eastern district has 16 clinics, 11 of which scheduled hours for diabetes care. Hours ranged from 3 to 12, totaling 65 hours per week and an FTE of 1.625. The Southwest district has the highest number of clinics and the highest FTE. Only on e of the 25 clinics in this district did not have scheduled hours for diabetes or wound care. Hours scheduled ranged from 2 to 8 and totaled 114 hours per week which is 2.85 FTE. The total clinic-based FTE for diabetes or wound care on Trinidad therefore is 6.05. Assessment of the demand for services of clinic and Copyright © 2013 SciRes. OPEN A CCESS 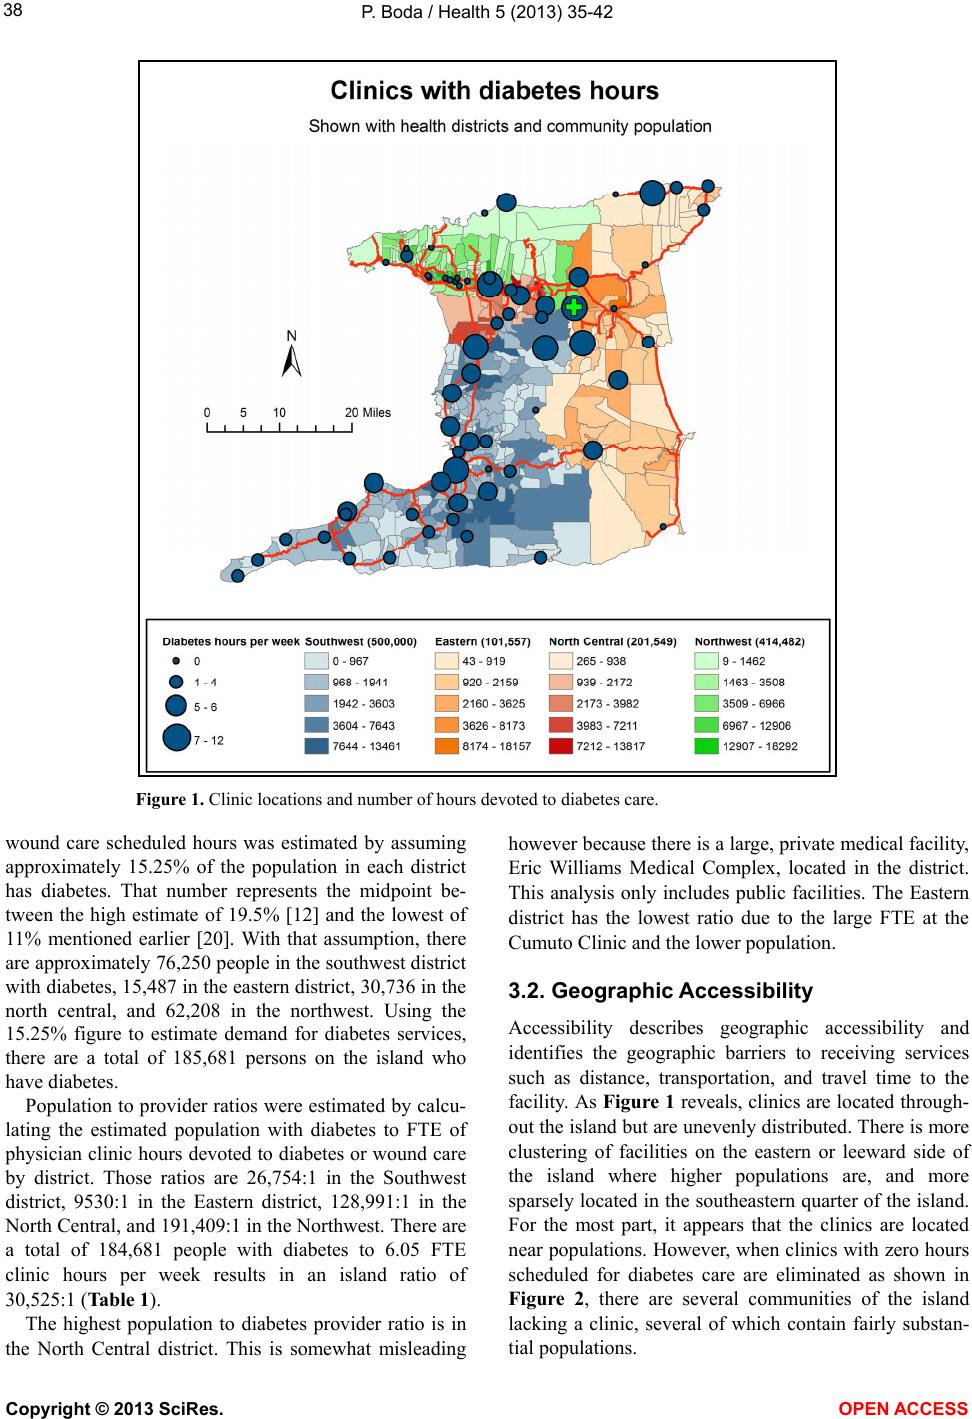 P. Boda / Health 5 (2013) 35-42 Copyright © 2013 SciRes. 38 Figure 1. Clinic locations and number of hours devoted to diabetes care. wound care scheduled hours was estimated by assuming approximately 15.25% of the population in each district has diabetes. That number represents the midpoint be- tween the high estimate of 19.5% [12] and the lowest of 11% mentioned earlier [20]. With that assumption, there are approximately 76,2 50 people in the southwest district with diabetes, 15,487 in th e eastern district, 30,736 in the north central, and 62,208 in the northwest. Using the 15.25% figure to estimate demand for diabetes services, there are a total of 185,681 persons on the island who have diabetes. OPEN ACCESS Population to provider ratios were estimated by calcu- lating the estimated population with diabetes to FTE of physician clinic hours devoted to diabetes or wound care by district. Those ratios are 26,754:1 in the Southwest district, 9530:1 in the Eastern district, 128,991:1 in the North Central, and 191,409:1 in the Northwest. There are a total of 184,681 people with diabetes to 6.05 FTE clinic hours per week results in an island ratio of 30,525:1 (Table 1). The highest population to diabetes provider ratio is in the North Central district. This is somewhat misleading however because there is a la rge, private medical facility, Eric Williams Medical Complex, located in the district. This analysis only includes public facilities. The Eastern district has the lowest ratio due to the large FTE at the Cumuto Clinic and the lower popu lation. 3.2. Geographic Accessibility Accessibility describes geographic accessibility and identifies the geographic barriers to receiving services such as distance, transportation, and travel time to the facility. As Figure 1 reveals, clinics are located th rough- out the island but are unevenly distributed. There is more clustering of facilities on the eastern or leeward side of the island where higher populations are, and more sparsely located in the south eastern quarter of the island. For the most part, it appears that the clinics are located near populations. Howev er, when clinics with zero hours scheduled for diabetes care are eliminated as shown in Figure 2, there are several communities of the island lacking a clinic, several of which contain fairly substan- ial populations. t 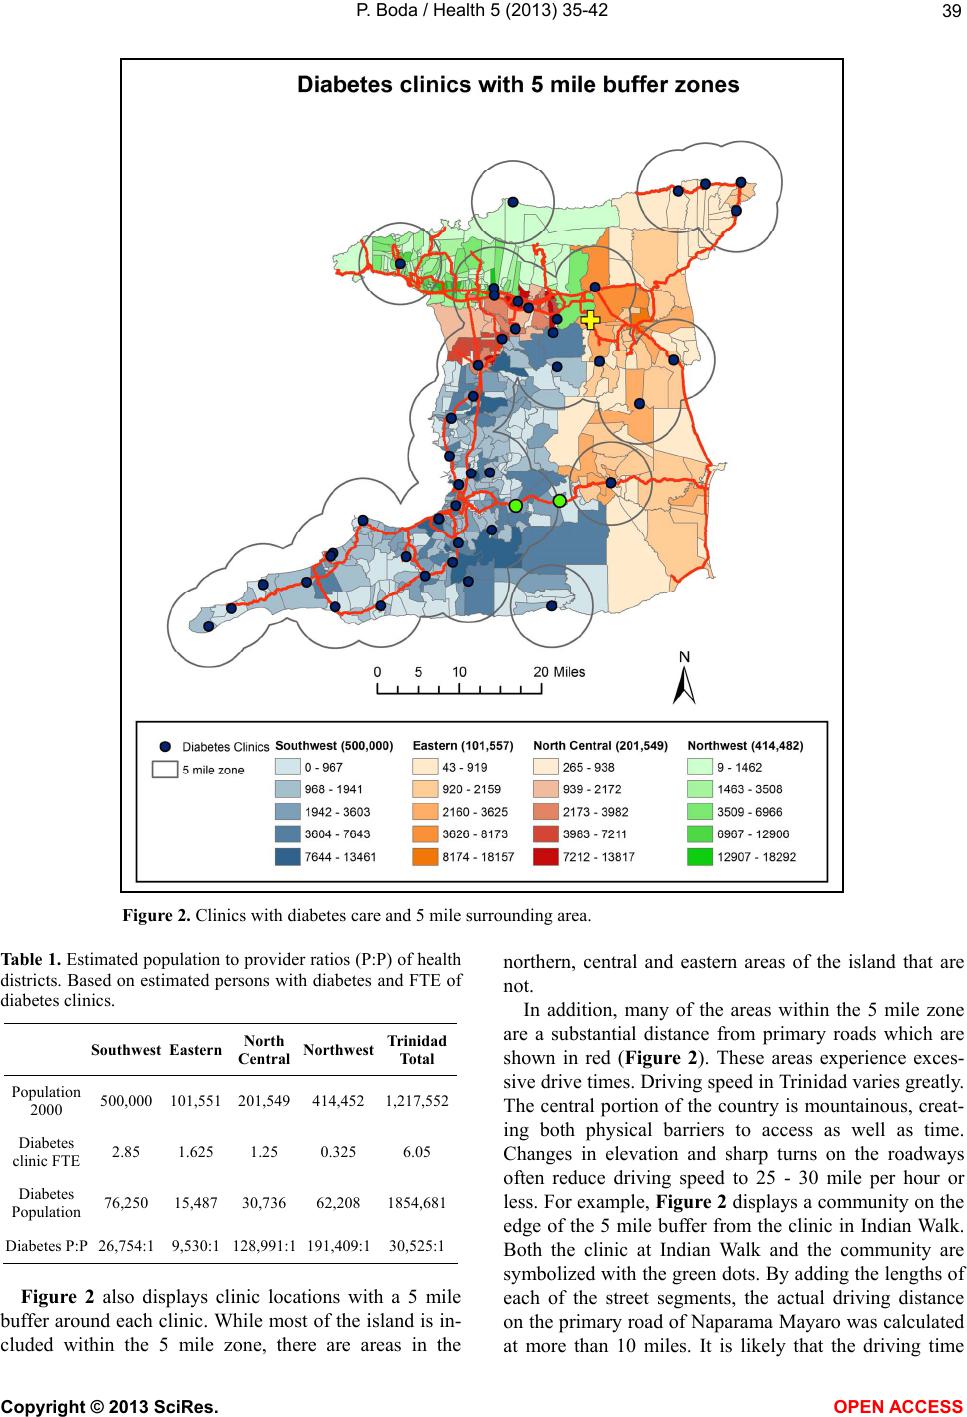 P. Boda / Health 5 (2013) 35-42 39 Figure 2. Clinics with diabetes care and 5 mile surrounding area. Table 1. Estimated population to provider ratios (P:P) of health districts. Based on estimated persons with diabetes and FTE of diabetes clinics. Southwest Eastern North Central Northwest Trinidad Total Population 2000 500,000 101,551 201,549 414,452 1,217,552 Diabetes clinic FTE 2.85 1.625 1.25 0.325 6.05 Diabetes Population 76,250 15,487 30,736 62,208 1854,681 Diabetes P:P 26,754:1 9,530:1 128,991:1 191,409: 1 30,525:1 Figure 2 also displays clinic locations with a 5 mile buffer around each clinic. While most of the island is in- cluded within the 5 mile zone, there are areas in the northern, central and eastern areas of the island that are not. In addition, many of the areas within the 5 mile zone are a substantial distance from primary roads which are shown in red (Figure 2). These areas experience exces- sive drive times. Driving speed in Tr in idad varies greatly. The central portion of the country is mountainous, creat- ing both physical barriers to access as well as time. Changes in elevation and sharp turns on the roadways often reduce driving speed to 25 - 30 mile per hour or less. For example, Figure 2 displays a community on the edge of the 5 mile buffer from the clinic in Indian Walk. Both the clinic at Indian Walk and the community are symbolized with the green dots. By add ing the lengths of each of the street segments, the actual driving distance on the primary road of Naparama Mayaro was calculated at more than 10 miles. It is likely that the driving time Copyright © 2013 SciRes. OPEN A CCESS 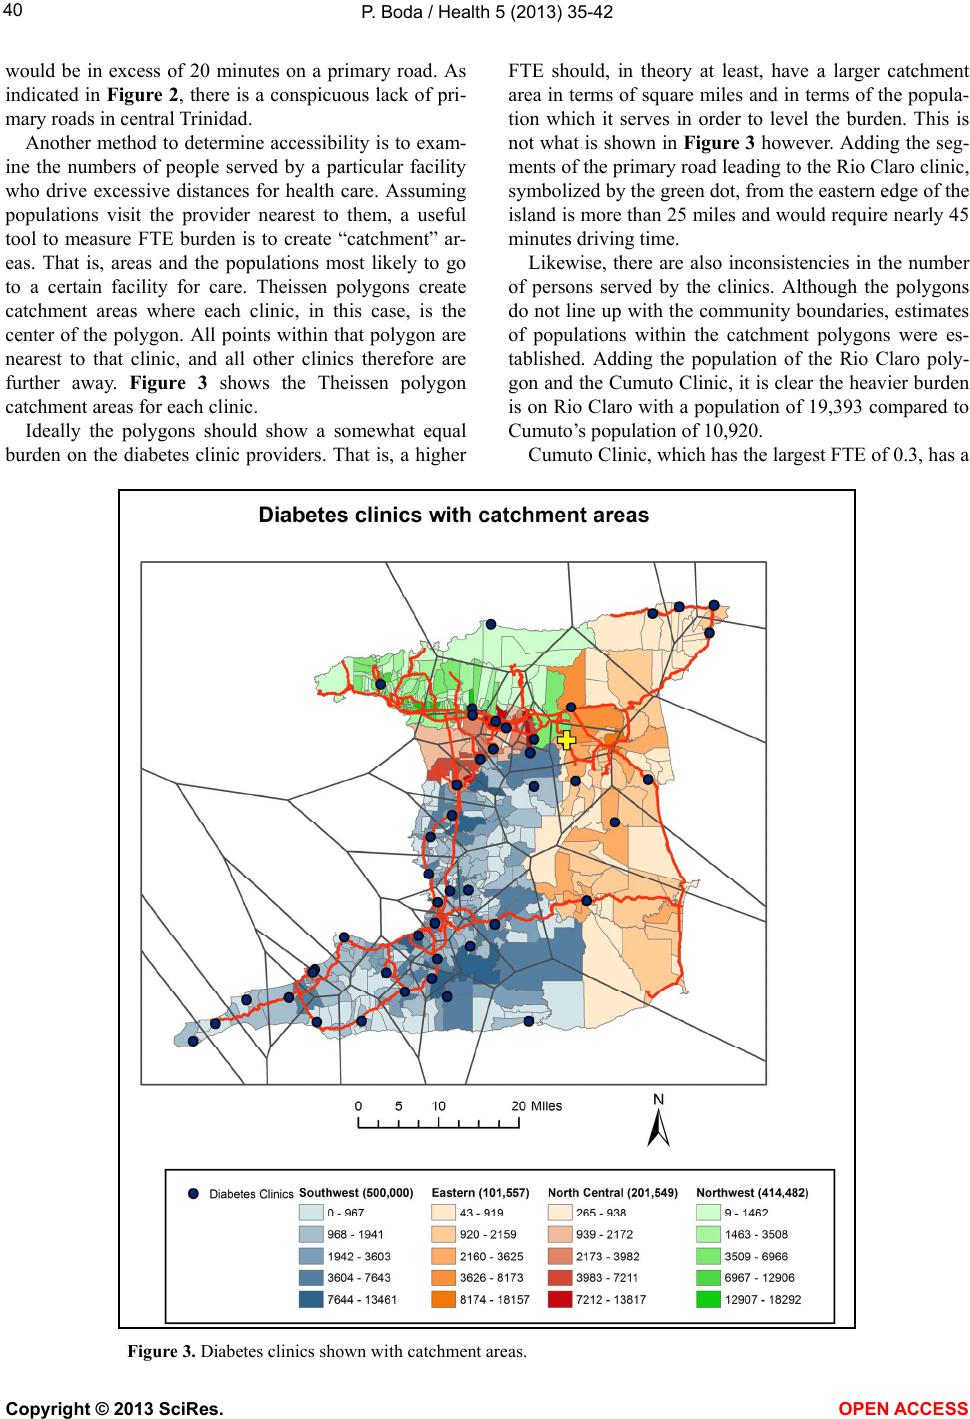 P. Boda / Health 5 (2013) 35-42 40 would be in excess of 20 minutes on a primary road. As indicated in Figure 2, there is a conspicuous lack of pri- mary roads in central Trinidad. Another method to determine accessibility is to exam- ine the numbers of people served by a particular facility who drive excessive distances for health care. Assuming populations visit the provider nearest to them, a useful tool to measure FTE burden is to create “catchment” ar- eas. That is, areas and the populations most likely to go to a certain facility for care. Theissen polygons create catchment areas where each clinic, in this case, is the center of the polygon. All points within that polygon are nearest to that clinic, and all other clinics therefore are further away. Figure 3 shows the Theissen polygon catchment areas for each clinic. Ideally the polygons should show a somewhat equal burden on the diabetes clinic providers. That is, a higher FTE should, in theory at least, have a larger catchment area in terms of square miles and in terms of the popula- tion which it serves in order to level the burden. This is not what is shown in Figure 3 however. Adding the seg- ments of the primary road leading to the Rio Claro clin ic, symbolized by the green dot, from the eastern edge of the island is more than 25 miles and would require nearly 45 minutes driving time. Likewise, there are also inconsistencies in the number of persons served by the clinics. Although the polygons do not line up with the co mmunity boundaries, estimates of populations within the catchment polygons were es- tablished. Adding the population of the Rio Claro poly- gon and the Cumuto Clinic, it is clear the heavier burd en is on Rio Claro with a population of 19,393 co mpared to Cumuto’s population of 10,920. Cumuto Clinic, which has the largest FTE of 0.3, has a Figure 3. Diabetes clinics shown with catchment areas. Copyright © 2013 SciRes. OPEN A CCESS 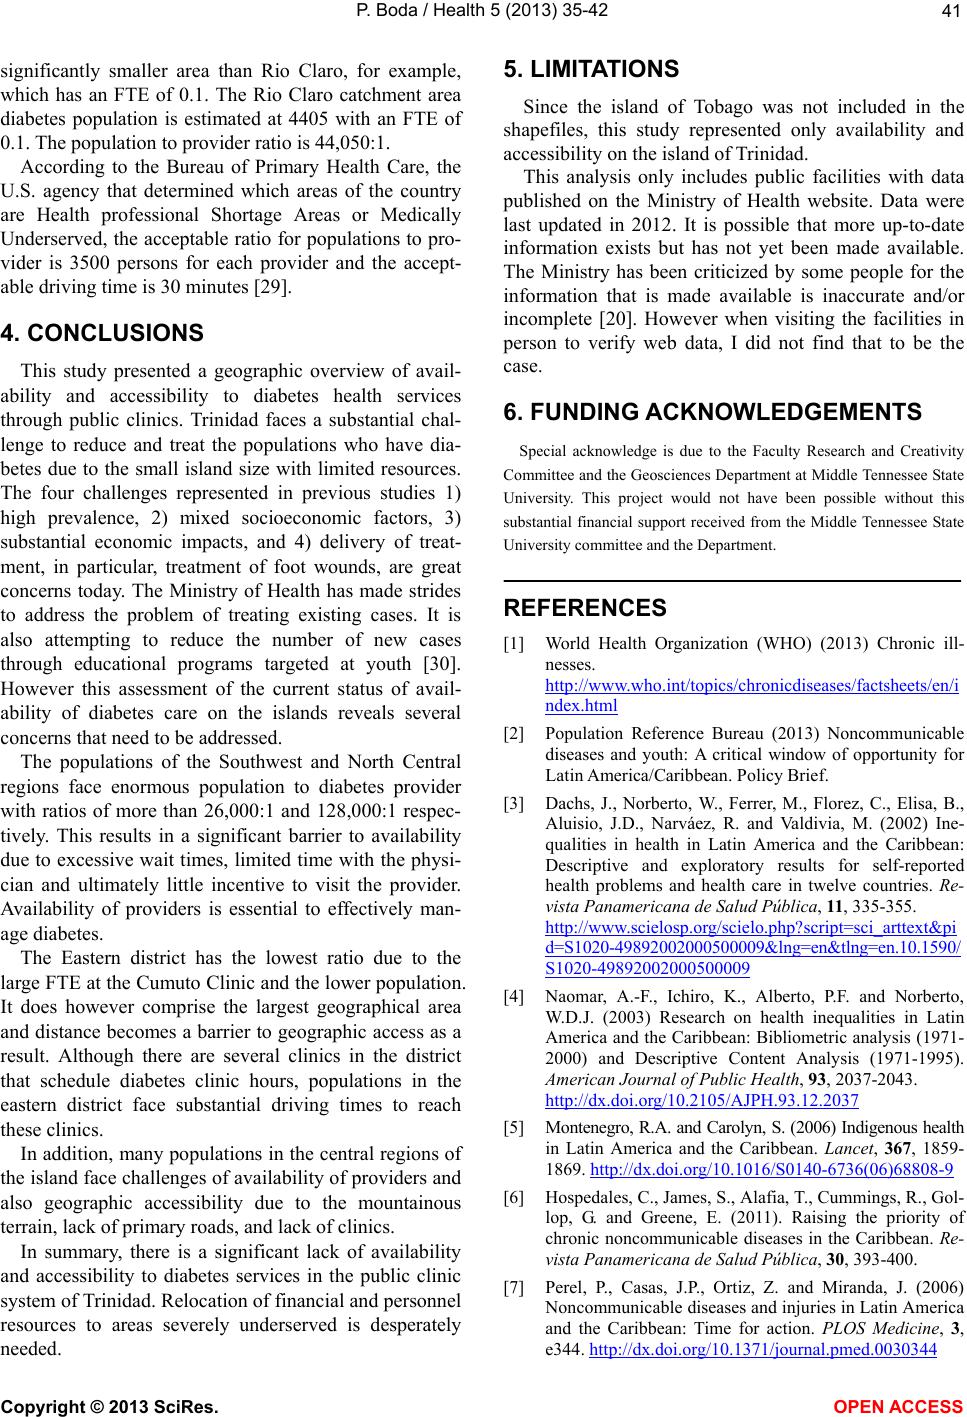 P. Boda / Health 5 (2013) 35-42 41 significantly smaller area than Rio Claro, for example, which has an FTE of 0.1. The Rio Claro catchment area diabetes population is estimated at 4405 with an FTE of 0.1. The population to provider ratio is 44,050:1. According to the Bureau of Primary Health Care, the U.S. agency that determined which areas of the country are Health professional Shortage Areas or Medically Underserved, the acceptable ratio for populations to pro- vider is 3500 persons for each provider and the accept- able driving time is 30 minutes [29]. 4. CONCLUSIONS This study presented a geographic overview of avail- ability and accessibility to diabetes health services through public clinics. Trinidad faces a substantial chal- lenge to reduce and treat the populations who have dia- betes due to the small island size with limited resources. The four challenges represented in previous studies 1) high prevalence, 2) mixed socioeconomic factors, 3) substantial economic impacts, and 4) delivery of treat- ment, in particular, treatment of foot wounds, are great concerns today. The Ministry of Health has made strides to address the problem of treating existing cases. It is also attempting to reduce the number of new cases through educational programs targeted at youth [30]. However this assessment of the current status of avail- ability of diabetes care on the islands reveals several concerns that need to be addressed. The populations of the Southwest and North Central regions face enormous population to diabetes provider with ratios of more than 26,000:1 and 128,000:1 respec- tively. This results in a significant barrier to availability due to excessive wait times, limited time with the physi- cian and ultimately little incentive to visit the provider. Availability of providers is essential to effectively man- age diabetes. The Eastern district has the lowest ratio due to the large FTE at the Cumuto Clinic and the lower population. It does however comprise the largest geographical area and distance becomes a barrier to geographic access as a result. Although there are several clinics in the district that schedule diabetes clinic hours, populations in the eastern district face substantial driving times to reach these clinics. In addition, many populations in the central regions of the island face challenges of availability of providers and also geographic accessibility due to the mountainous terrain, lack of primary roads, and lack of clinics. In summary, there is a significant lack of availability and accessibility to diabetes services in the public clinic system of Trinidad. Relocation of financial and personnel resources to areas severely underserved is desperately needed. 5. LIMITATIONS Since the island of Tobago was not included in the shapefiles, this study represented only availability and accessibility on the island of Trinidad. This analysis only includes public facilities with data published on the Ministry of Health website. Data were last updated in 2012. It is possible that more up-to-date information exists but has not yet been made available. The Ministry has been criticized by some people for the information that is made available is inaccurate and/or incomplete [20]. However when visiting the facilities in person to verify web data, I did not find that to be the case. 6. FUNDING ACKNOWLEDGE MENTS Special acknowledge is due to the Faculty Research and Creativity Committee and the Geosciences Department at Middle Tennessee State University. This project would not have been possible without this substantial financial support received from the Middle Tennessee State University committee and the Department. REFERENCES [1] World Health Organization (WHO) (2013) Chronic ill- nesses. http://www.who.int/topics/chronicdiseases/factsheets/en/i ndex.html [2] Population Reference Bureau (2013) Noncommunicable diseases and youth: A critical window of opportunity for Latin America/C aribbean. Polic y Brief. [3] Dachs, J., Norberto, W., Ferrer, M., Florez, C., Elisa, B., Aluisio, J.D., Narváez, R. and Valdivia, M. (2002) Ine- qualities in health in Latin America and the Caribbean: Descriptive and exploratory results for self-reported health problems and health care in twelve countries. Re- vista Panamericana de Salud Pública, 11, 335-355. http://www.scielosp.org/scielo.php?script=sci_arttext&pi d=S1020-49892002000500009&lng=en&tlng=en.10.1590/ S1020-49892002000500009 [4] Naomar, A.-F., Ichiro, K., Alberto, P.F. and Norberto, W.D.J. (2003) Research on health inequalities in Latin America and the Caribbean: Bibliometric analysis (1971- 2000) and Descriptive Content Analysis (1971-1995). American Journal of Public Health, 93, 2037-2043. http://dx.doi.org/10.2105/AJPH.93.12.2037 [5] Montene gro, R.A. and Ca rolyn, S. (2 006) Indigen ous health in Latin America and the Caribbean. Lancet, 367, 1859- 1869. http://dx.doi.org/10.1016/S0140-6736(06)68808-9 [6] Hospedales, C., James, S., Alafia, T., Cummings, R., Gol- lop, G. and Greene, E. (2011). Raising the priority of chronic noncommunicable diseases in the Caribbean. Re- vista Panamericana de Salud Pública, 30, 393-400. [7] Perel, P., Casas, J.P., Ortiz, Z. and Miranda, J. (2006) Noncommunicable diseases and injuries in Latin America and the Caribbean: Time for action. PLOS Medicine, 3, e344. http://dx.doi.org/10.1371/journal.pmed.0030344 Copyright © 2013 SciRes. OPEN A CCESS  P. Boda / Health 5 (2013) 35-42 42 [8] Ferguson, T.S., Tulloch-Reid, M.K., Cunningham-Myrie, C.A., Davidson-Sadler, T., Copeland, S. and Lewis-Fuller, (2011) Chronic disease in the Caribbean: Strategies to respond to the public health challenge in the region. What can we learn from Jamaica’s experience? West Indian Medical Journal, 60, 397-411. [9] Bourne, P.A. (2009) Socio-demographic determinants of health care-seeking behaviour, self-reported illness and self-evaluated health status in Jamaica. International Journal of Collaborative Research on Internal Medicine & Public Health, 1, 101-130. [10] Bourne, P.A. and Joan, R. (2009) Good health status of rural women in the reproductive ages. International Jour- nal of Collaborative Research on Internal Medicine & Public Health, 1, 132-155. [11] Bourne, P.A. (2009) A theoretical framework of the good health status of Jamaicans: Using econometric analysis to model good health status over the life course. North Ame- rican Journal of Medical Science, 1, 86-95. [12] Chadee, D., Terrance, S., Lexley, M., Pinto, P., Mary, C., Rohan M., and Surujpal, T. (2013) Prevalence of self- reported diabetes, hypertension and heart disease in in- dividuals seeking State funding in Trinidad and Tobago, West Indies. Journal of Epidemiology and Global Health, 3, 95-103. http://dx.doi.org/10.1016/j.jegh.2013.02.002 [13] Singh, H., Haqq, E.D. and Mustapha, N. (1999) Patients’ perception and satisfaction with health care professionals at primary care facilities in Trinidad and Tobago. Bulle- tin-World Health. [14] Pinto, P., Lexley, M., Terrance, S., Suruipal, T. and Shi- vananda N. (2013) Restrictive pulmonary deficit is as- sociated with inflammation in sub-optimally controlled obese diabetes. Journal of Thoracic Disease, 5, 289-297. [15] Nayak, S., Sateesh, S., Castay, G., Safia, C., Jacita, B., Ce- cile, M., David, D., Francesca, K. and Shaun, W. (2013) Evaluation of pulmonary dysfunction among persons with type 2 diabetes in Trinidad. International Journal of Research and Development in Pharmacy and Life Sci- ences. http://imsear.hellis.org/handle/123456789/146400 [16] Nayak, B.S., Ali, P., Seepersad, R., Cooke, N., Geawan, S., Brown, A., Ramdeen, A., Mahabir, L. and Lutchman, B. (2013) Type 2 diabetes, high triglycerides, LDL, are risk factors for cardiovascular disease in persons 45 years and older. International Journal of Research in Phar- maceutical and Biomedical Sciences, 4, 165-169. [17] Nayak, B.S., Kameel, M., Shawn, S., Justin, S., Shalina, S., Crystal, S., Cadina, S., Victoria, S., Nirvani, S. and Munish, S. (2013) A comparison between HbA1c and fasting plasma glucose in the diagnosis of type 2 diabetes in Trinidad: A high prevalence setting. World Journal of Pharmacy and Pharmaceutical Sciences, 1, 1171-1180. [18] Ariyanayagam-Baksh, S.M., Bickram, L., Picou, D. and Mahabir, D..(1995) Counting the cost of diabetic hospital admissions from a multi-ethnic population in Trinidad. Diabetic Medicine, 12, 1077-1085. h ttp :// dx. doi.org/1 0.1111/ j.1464-5491.1995.tb00424.x [19] Gulliford, M.C., Ariyanayagam-Baksh, S.M., Bickram, L., Picou, D. and Mahabir, D. (1997) Social environment, morbidity and use of health care among people with dia- betes mellitus in Trinidad. International Journal of Epi- demioogy, 26, 620-627. http://dx.doi.org/10.1093/ije/26.3.620 [20] Nicholls, K. (2010) The diabetes epidemic in Trinidad & Tobago: Attacking a burdensome disease with conven- tional weapons. White paper. http://www.docs-archive.com/view/766d00e5c7c28db892 94aa2d77764114/THE-DIABETES-EPIDEMIC-IN-TRI NIDAD-%26-TOBAGO.pdf [21] Mahabir, D. and Guiliford, M.C. (1997) Use of medicinal plantgs for diabetes in Trinidad and Tobago. Revista Panamericana de Salud Publica, 1. http://dx.doi.org/10.1590/S1020-498919970003000002 [22] Motilal, S. and Rohan, G.M. (2013) Nutmeg extracts for painful diabetic neuropathy: A randomized, double-blind, controlled study. The Journal of Alternative and Com- plementary Medicine, 19, 347-352. http://dx.doi.org/10.1089/acm.2012.0016 [23] Gucciardi, E. and Souraya, S. (2013) A systematic litera- ture review of diabetes self-management education fea- tures to improve diabetes education in women of Black African/Caribbean decent and Hispanic/Latin American ethnicity Patient Education and Counseling. Science Di- rect. http://www.sciencedirect.com/science/artiucle/pii/S07383 9911300116X [24] New and comprehensive study of diabetes care in Trini- dad-Tobago released (2012) http://www.hopkinsmedicine.org/news/media/releases/ne w_and_comprehensive_study_of_diabetes_care_in_trinid ad_and_tobago_released [25] Carrington, S., Cohall, D.H., Gossell-Williams, M. and Lindo, J.F. (2012) The antimicrobial screening of a Bar- badian medicinal plant with indications for use in the treatment of diabetic wound infections. West Indian Medical Journal. http://caribbean.scielo.org/scielo.php?script=sci_arttext& pid=S0043-31442012000900003&lng=en&nrm=iso [26] Ferguson, T.S., Tulloch-Reid, M.K., Younger, N., Wright- Pascoe, R., Boyne, M., McFarland, S.R., Francis, D. and Wilks, R.J. (2012) Diabetic foot complications among patients attending a specialist diabetes clinic in Jamaica: Prevalence and associated factors. West Indian Medical Journal, 61. [27] Lee, J., Wolch, J.R. and Walsh, J. (1998) Homeless health and service needs. In: Kearns, R.A. and Gesler, W., Eds., Putting Health into Place, Syracuse University Press, Sy - racuse. [28] Penchansky, R. and Thomas, J.W. (1981) The concept of access: Definition and relationships to consumer satisfac- tion. Medical Care, 19, 127-140. http://dx.doi.org/10.1097/00005650-198102000-00001 [29] Bureau of Primary Health Care (BPHC) (2012) Published in The Federal Register, 77, Government Accounting Office, Washington DC. [30] Trinidad and Tobago Ministry of Health website (2013) http://www.health.gov.tt/ Copyright © 2013 SciRes. OPEN A CCESS |