

Paper Menu >>
Journal Menu >>
 American Journal of Anal yt ical Chemistry, 2011, 2, 109-115 doi:10.4236/ajac.2011.22012 Published Online May 2011 (http://www.SciRP.org/journal/ajac) Copyright © 2011 SciRes. AJAC Simple, Inexpensive and Ecologically Friendly Derivative Spectrophotometric Fluconazole Assay from Nail Lacquer Formulations Alisa Elezović1, Amar Elezović2, Sabira Hadžović1 1Department of Pharmaceutical Technology, Faculty of Pharmacy, University of Sarajevo, Sarajevo, Bosnia and Herzegovina 2Agency for Drugs and Medical Devices, Control Laboratory Sarajevo, Sarajevo, Bosnia and Herzegovina E-mail: [email protected] Received December 29, 2010; revised February 9, 2011; accepted February 14, 2011 Abstract Nail lacquers represent new drug form specifically designed to treat infected nail plate. They are complex organic solutions with specific assaying problems due to the high content of the polymer and plasticizer. Furthermore, there is a lack of assaying methods of active substances from this type of formulations in scien- tific literature. We developed derivative UV-spectrophotometric method for determination of fluconazole content in antifungal nail lacquer formulations. The method was validated for specificity, linearity, precision (repeatability), intermediate precision and accuracy (recovery). The method is specific, linear in the range of 99.53 - 497.65 μg/ml, precise and showed good recovery (98.79% - 101.77% from all six developed formu- lations). Besides, it is inexpensive, simple and nontoxic, i.e. ecologically acceptable. This method can be used for assaying fluconazole from this type of formulations. Keywords: Nail Lacquer, Fluconazole Assay, Derivative Spectrophotometry 1. Introduction Onychomycoses, fungal nail infections, are responsible for 50% of all nail disorders [1]. Fluconazole is a potent triazole antifungal agent, very effective in treatment of onychomycoses [2-4]. However, it is underused in systemic treatment of the disease due to its numerous drug interactions and side-effects [5] as well as heightened susceptibility for development of fungal resistance. These hindrances of fluconazole in systemic therapy of onychomycoses can be solved by its topical use [6]. Nail lacquers (named also transungual therapeutic systems) represent new drug forms specifically designed to enable longer release and sustained action of active principle into the infected nail plate. These systems are commonly solutions (or suspensions) containing anti- fungal agent, film-forming polymer, plasticizer and suit- able volatile solvent. These excipients give stable solu- tion (or suspension), easily spread on nail plate, and after evaporation leave homogenous film. In our laboratory, we developed six formulations of nail lacquer. There are literature accounts of determination of few substances from cosmetic nail lacquers, such as organic paints [7,8], formaldehyde [9], phthalate esters [10,11]. However, methods of assaying of active substances from this type of formulations are not available in scientific literature. Thus, the derivative UV-spectrophotometric method was developed for determination of fluconazole content in nail lacquers. 2. Equipments Shimadzu UV-1601 spectrophotometer was used for the spectrophotometric measurements. Measurements were performed in quartz cuvette (d = 1 cm) with fixed slit width of 2 nm in the range of 225 - 400 nm. First deriva- tive spectra were obtained in the same range, i.e. 225 - 400 nm (Δλ (N) = 4). The inermediate precision study was performed under the same conditions as described above on Shimadzu UV-1700 spectrophotometer.  A. ELEZOVIĆ ET AL. 110 3. Reagents and Samples Fluconazole, fluconazole working standard and Eudragit RS100 were in accordance to the corresponding mono- graphs’ specifications of Ph. Eur. 6.0. Fluconazole and fluconazole working standard were gifts from Bosnalijek, d.d., Sarajevo, Bosnia and Herzegovina; Eudragit RS100 was kindly provided by Degussa AG, Rhome-Pharma GmbH, Germany. All other reagents were of analytical grade or better. The nail lacquer formulations were prepared as clear solutions containing 0.9% (w/v) fluconazole as antifun- gal agent, Eudragit RS 100 as film-forming polymer, and acetone as solvent. The formulations varied with respect to nature and concentration of plasticizer, and they con- tain: di-butyl phthalate in concentration of 15% (formu- lation 1 L) or 25% (2 L) compared to the polymer, poly- ethylene glycol 400 in concentration of 15% (3 L) or 25% (4 L) compared to the polymer, and propylene gly- col in concentration of 15% (5 L) or 25% (6 L) compared to the polymer. The blank sample of each formulation contained all components as the corresponding formula- tion except for fluconazole. 4. Procedure Nail lacquer sample (0.5 ml) was spread on filter paper (blue ribbon) and left to dry in tilted position for 10 - 15 minutes. After acetone evaporated (it could not be smelled), the filter paper was placed in Erlenmeyer flask of 100 ml. Distilled water (25 ml) was added and the paper was completely submerged in water. Erlenmeyer flask was closed and sonicated for 60 minutes. The content was filtered and filtrate was used for the measure- ment of first order derivative of absorbance at 268.4 nm. Fluconazole concentration was calculated using the calibration curve. The stock solution of fluconazole (c = 500 μg/ml) for the construction of calibration curve was prepared as aqueous solution of fluconazole standard by gentle heating at 40˚C and was diluted afterwards to target concentrations. For the recovery studies, the fluconazole standard was added to each nail lacquer formulation in concentrations of 10, 20 and 30 μg/ml. 5. Results and Discusion Considering the nature of sample (nail lacquer), i.e. the fact that it is organic solution with high content of film forming polymer, there were very unique challenges to solve. Namely, nail lacquers are very specific formula- tions, since they are non-aqueous, they have high poly- mer content (usually 12% - 36%) and plasticizer content (10% - 40% compared to the polymer). These excipients may interfere with the determination of active substance present in comparatively low concentration (in this case 0.9%). When dry, the films are relatively thick and plas- tic and the extraction of active substance from such ma- trices is very difficult. We developed derivative UV- spectrophotometric method, enabling relatively easy fluconazole content determination from these six formu- lations. This method was validated according to ICH gui- deline Q2 (R1) [12]. Validation parameters were speci- ficity, linearity, repeatability, intermediate precision and accuracy (recovery). 6. Sample Treatment First, the extraction of fluconazole was attempted by pouring lacquer sample into water or different concentra- tions of methanol (5% - 15%), leading to precipitation of water insoluble acrylate polymer. However, spectropho- tometry requires large sample volume for measurement, and relatively large volume of extraction medium would have to be used. Very large amount of nail lacquer sam- ple would be needed for adequate precipitation to occur, but this might not ensure complete dissolution of flu- conazole and could pose another problem if trying to extract it quantitatively from such suspension. Thus, by using smaller amount of nail lacquer, instead of precipi- tation, dilution resulted in strong opalescence. This pre- vented obtaining UV spectra, and the opalescence could not be removed by filtration through the 0.22 μm pore filter. Also, the presence of acetone, even in small concen- trations (less than 5%), strongly destabilizes fluconazole spectrum. This problem was solved by evaporating ace- tone, i.e. by drying the lacquer. Firstly, we tried spread- ing of lacquer on the bottom of Erlenmeyer flask and evaporating the acetone at 40˚C. Acetone evaporation in such way was disputable, depending on flask’s neck width, and it might not be completed after 90 minutes of drying. Recovery in this instance was around 70%, and for 2 L being as low as 57%. The solution was found in spreading the nail lacquer on filter paper. In this manner, the acetone evaporates fast and easily, the film is well bound to the filter paper and there is double area from which fluconazole can be extracted. Water was chosen since Eudragit RS 100 is not solu- ble in it (unlike most organic solvents including alcohols) and it is also non-toxic and inexpensive. The volume of extractant was set to give concentration of fluconazole in the extract at the optimal position of calibration curve. The sonication time was chosen to be 60 minutes, since after 45 minutes or less the recovery was not suffi- Copyright © 2011 SciRes. AJAC 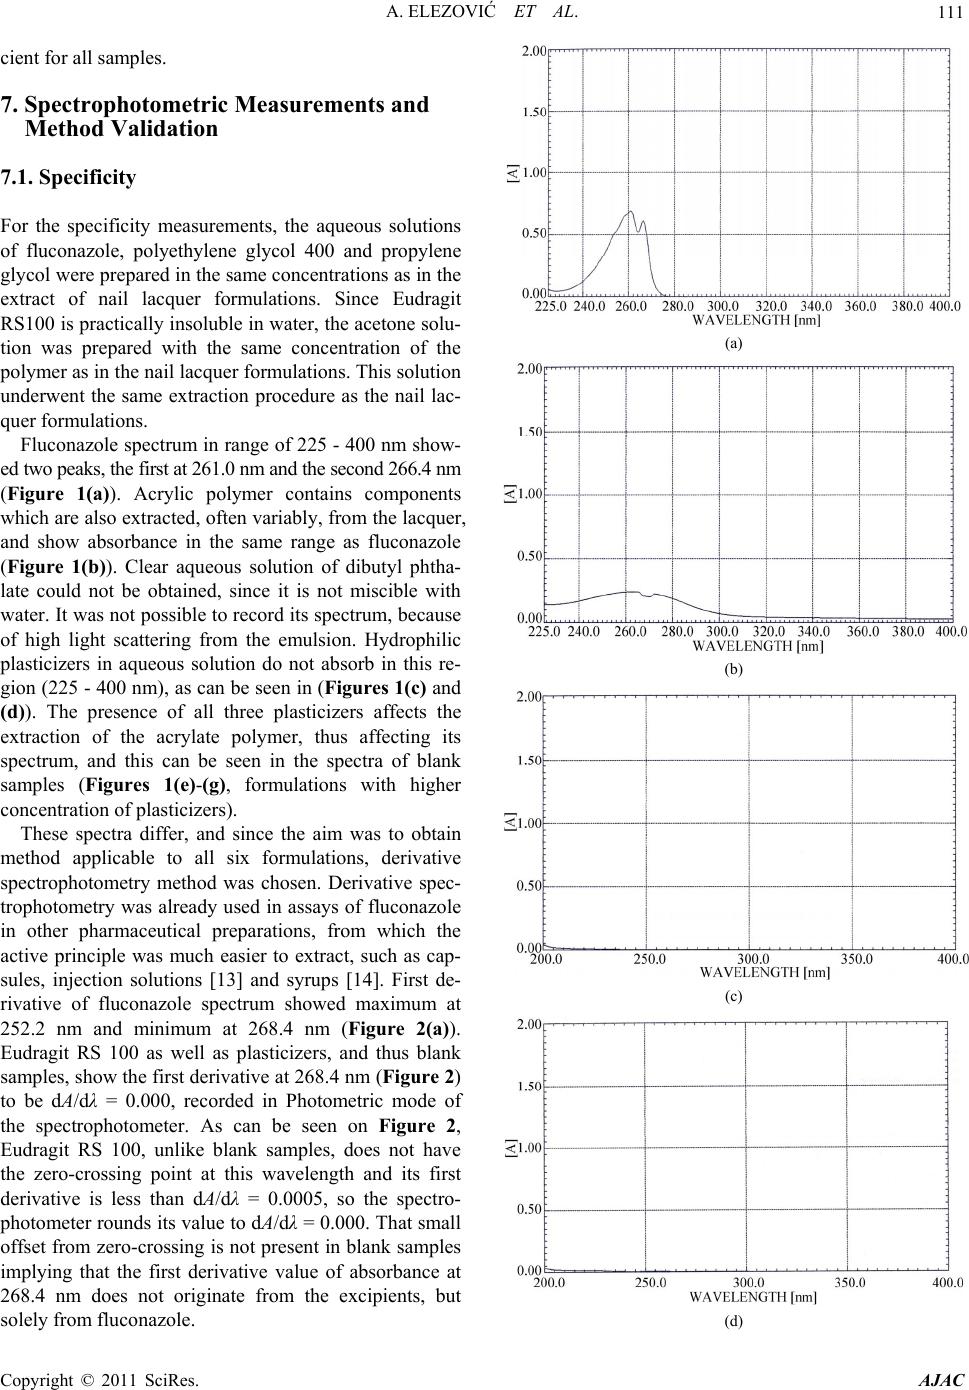 A. ELEZOVIĆ ET AL.111 cient for all samples. 7. Spectrophotometric Measurements and Method Validation 7.1. Specificity For the specificity measurements, the aqueous solutions of fluconazole, polyethylene glycol 400 and propylene glycol were prepared in the same concentrations as in the extract of nail lacquer formulations. Since Eudragit RS100 is practically insoluble in water, the acetone solu- tion was prepared with the same concentration of the polymer as in the nail lacquer formulations. This solution underwent the same extraction procedure as the nail lac- quer formulations. Fluconazole spectrum in range of 225 - 400 nm show- ed two peaks, the first at 261.0 nm and the second 266.4 nm (Figure 1(a)). Acrylic polymer contains components which are also extracted, often variably, from the lacquer, and show absorbance in the same range as fluconazole (Figure 1(b)). Clear aqueous solution of dibutyl phtha- late could not be obtained, since it is not miscible with water. It was not possible to record its spectrum, because of high light scattering from the emulsion. Hydrophilic plasticizers in aqueous solution do not absorb in this re- gion (225 - 400 nm), as can be seen in (Figures 1(c) and (d)). The presence of all three plasticizers affects the extraction of the acrylate polymer, thus affecting its spectrum, and this can be seen in the spectra of blank samples (Figures 1(e)-(g), formulations with higher concentration of plasticizers). These spectra differ, and since the aim was to obtain method applicable to all six formulations, derivative spectrophotometry method was chosen. Derivative spec- trophotometry was already used in assays of fluconazole in other pharmaceutical preparations, from which the active principle was much easier to extract, such as cap- sules, injection solutions [13] and syrups [14]. First de- rivative of fluconazole spectrum showed maximum at 252.2 nm and minimum at 268.4 nm (Figure 2(a)). Eudragit RS 100 as well as plasticizers, and thus blank samples, show the first derivative at 268.4 nm (Figure 2) to be dA/dλ = 0.000, recorded in Photometric mode of the spectrophotometer. As can be seen on Figure 2, Eudragit RS 100, unlike blank samples, does not have the zero-crossing point at this wavelength and its first derivative is less than dA/dλ = 0.0005, so the spectro- photometer rounds its value to dA/dλ = 0.000. That small offset from zero-crossing is not present in blank samples implying that the first derivative value of absorbance at 268.4 nm does not originate from the excipients, but solely from fluconazole. (a) (b) (c) (d) Copyright © 2011 SciRes. AJAC  A. ELEZOVIĆ ET AL. 112 (e) (f) (g) Figure 1. UV spectra of fluconazole (a), Eudragit RS100 (b), polyethylene glycol 400 (c), propylene glycol (d), blank samples 2 (e), 4 (f) and 6 (g) in the region 225 - 400 nm. The minimum of the first derivative of absorbance at 268.4 nm was chosen for quantification. In this manner, the specificity of the method was proven. 7.2. Linearity Linearity was shown by obtaining the first derivative of absorbance of fluconazole at 268.4 nm in concentration range 99.53 - 497.65 μg/ml, and the correlation coefficient was R2 = 0.99985.(Figure 3) (a) (b) (c) (d) (e) Figure 2. The first derivatives of UV spectra of fluconazole (a), Eudragit RS100 (b), blank samples 2 (c), 4 (d) and 6 (e) in the region 225 - 400 nm. Copyright © 2011 SciRes. AJAC 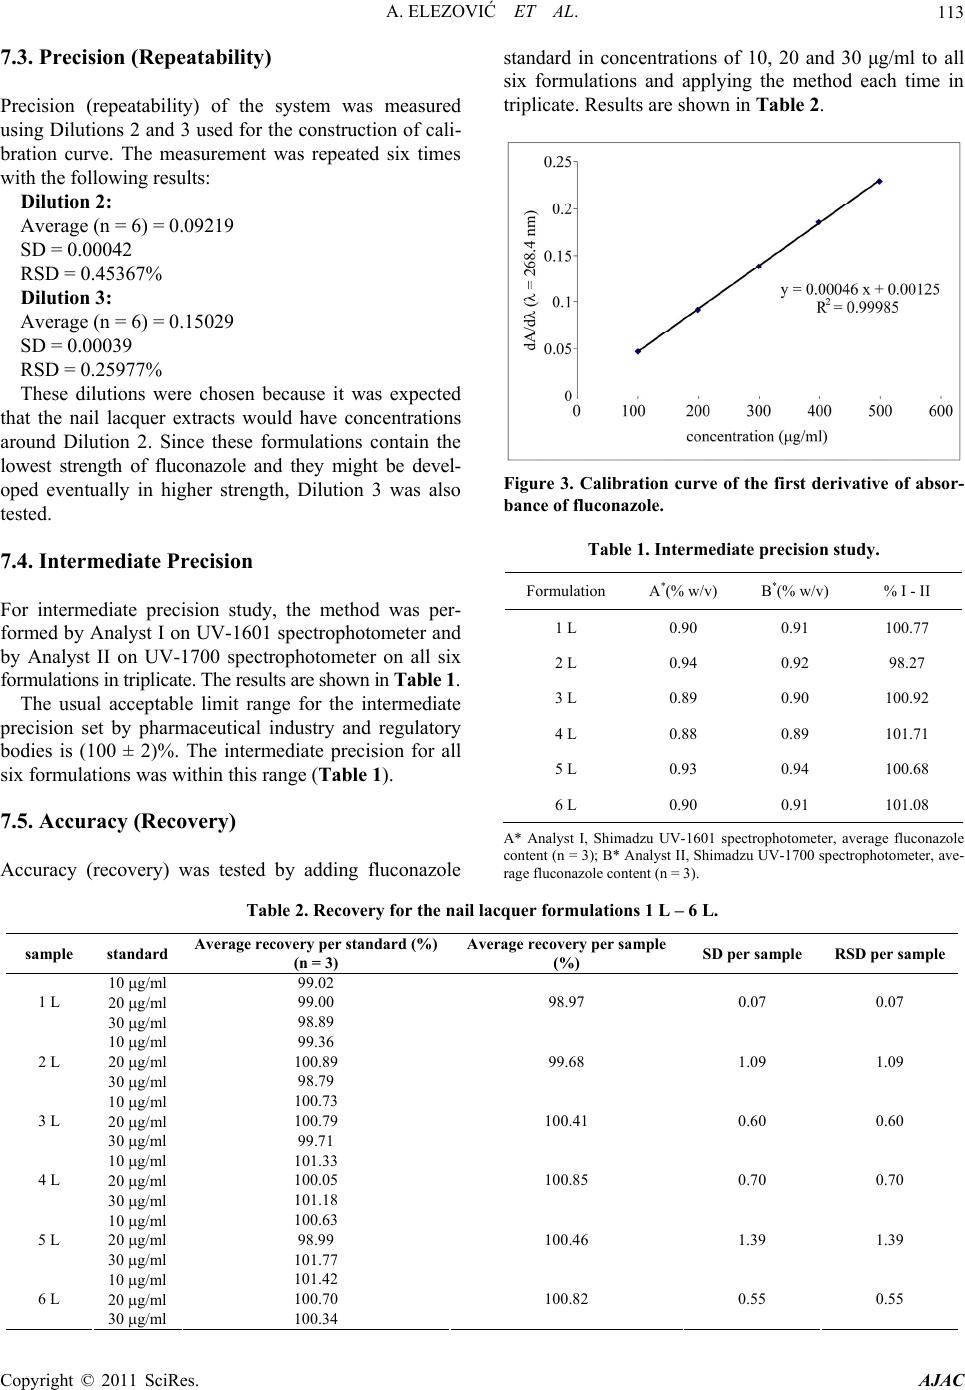 A. ELEZOVIĆ ET AL. Copyright © 2011 SciRes. AJAC 113 7.3. Precision (Repeatability) standard in concentrations of 10, 20 and 30 μg/ml to all six formulations and applying the method each time in triplicate. Results are shown in Table 2. Precision (repeatability) of the system was measured using Dilutions 2 and 3 used for the construction of cali- bration curve. The measurement was repeated six times with the following results: Dilution 2: Average (n = 6) = 0.09219 SD = 0.00042 RSD = 0.45367% Dilution 3: Average (n = 6) = 0.15029 SD = 0.00039 RSD = 0.25977% These dilutions were chosen because it was expected that the nail lacquer extracts would have concentrations around Dilution 2. Since these formulations contain the lowest strength of fluconazole and they might be devel- oped eventually in higher strength, Dilution 3 was also tested. Figure 3. Calibration curve of the first derivative of absor- bance of fluconazole. Table 1. Intermediate precision study. 7.4. Intermediate Precision Formulation A*(% w/v) B*(% w/v) % I - II 1 L 0.90 0.91 100.77 2 L 0.94 0.92 98.27 3 L 0.89 0.90 100.92 4 L 0.88 0.89 101.71 5 L 0.93 0.94 100.68 6 L 0.90 0.91 101.08 For intermediate precision study, the method was per- formed by Analyst I on UV-1601 spectrophotometer and by Analyst II on UV-1700 spectrophotometer on all six formulations in triplicate. The results are shown in Table 1. The usual acceptable limit range for the intermediate precision set by pharmaceutical industry and regulatory bodies is (100 ± 2)%. The intermediate precision for all six formulations was within this range (Table 1). 7.5. Accuracy (Recovery) A* Analyst I, Shimadzu UV-1601 spectrophotometer, average fluconazole content (n = 3); B* Analyst II, Shimadzu UV-1700 spectrophotometer, ave- rage fluconazole content (n = 3). Accuracy (recovery) was tested by adding fluconazole Table 2. Recovery for the nail lacquer formulations 1 L – 6 L. sample standard Average recovery per standard (%) (n = 3) Average recovery per sample (%) SD per sample RSD per sample 10 g/ml 99.02 20 g/ml 99.00 1 L 30 g/ml 98.89 98.97 0.07 0.07 10 g/ml 99.36 20 g/ml 100.89 2 L 30 g/ml 98.79 99.68 1.09 1.09 10 g/ml 100.73 20 g/ml 100.79 3 L 30 g/ml 99.71 100.41 0.60 0.60 10 g/ml 101.33 20 g/ml 100.05 4 L 30 g/ml 101.18 100.85 0.70 0.70 10 g/ml 100.63 20 g/ml 98.99 5 L 30 g/ml 101.77 100.46 1.39 1.39 10 g/ml 101.42 20 g/ml 100.70 6 L 30 g/ml 100.34 100.82 0.55 0.55 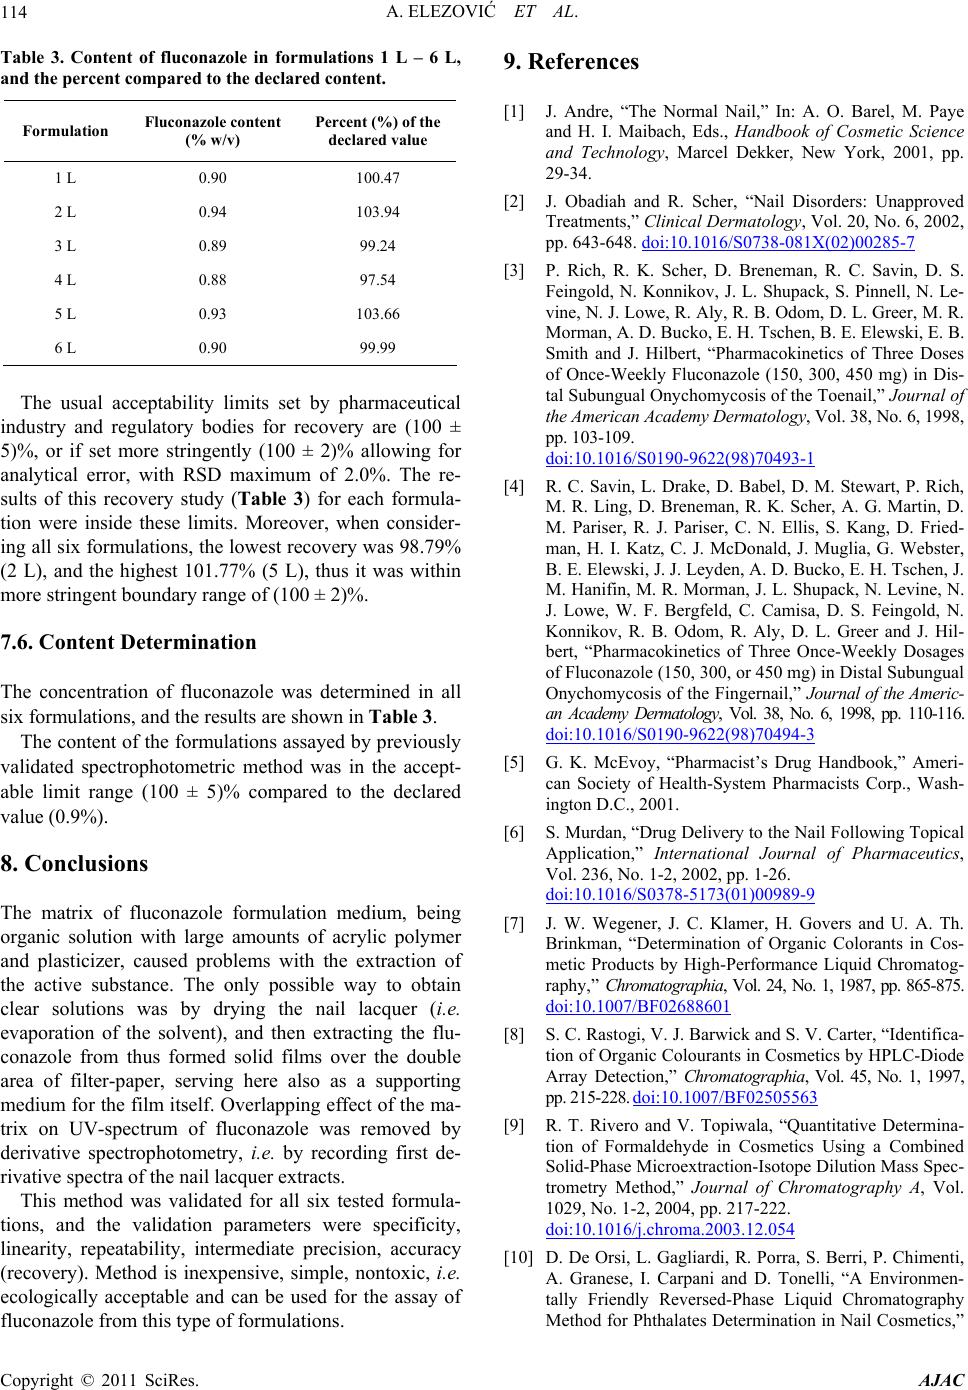 A. ELEZOVIĆ ET AL. Copyright © 2011 SciRes. AJAC 114 Table 3. Content of fluconazole in formulations 1 L – 6 L, and the percent compared to the declared content. Formulation Fluconazole content (% w/v) Percent (%) of the declared value 1 L 0.90 100.47 2 L 0.94 103.94 3 L 0.89 99.24 4 L 0.88 97.54 5 L 0.93 103.66 6 L 0.90 99.99 The usual acceptability limits set by pharmaceutical industry and regulatory bodies for recovery are (100 ± 5)%, or if set more stringently (100 ± 2)% allowing for analytical error, with RSD maximum of 2.0%. The re- sults of this recovery study (Table 3) for each formula- tion were inside these limits. Moreover, when consider- ing all six formulations, the lowest recovery was 98.79% (2 L), and the highest 101.77% (5 L), thus it was within more stringent boundary range of (100 ± 2)%. 7.6. Content Determination The concentration of fluconazole was determined in all six formulations, and the results are shown in Table 3. The content of the formulations assayed by previously validated spectrophotometric method was in the accept- able limit range (100 ± 5)% compared to the declared value (0.9%). 8. Conclusions The matrix of fluconazole formulation medium, being organic solution with large amounts of acrylic polymer and plasticizer, caused problems with the extraction of the active substance. The only possible way to obtain clear solutions was by drying the nail lacquer (i.e. evaporation of the solvent), and then extracting the flu- conazole from thus formed solid films over the double area of filter-paper, serving here also as a supporting medium for the film itself. Overlapping effect of the ma- trix on UV-spectrum of fluconazole was removed by derivative spectrophotometry, i.e. by recording first de- rivative spectra of the nail lacquer extracts. This method was validated for all six tested formula- tions, and the validation parameters were specificity, linearity, repeatability, intermediate precision, accuracy (recovery). Method is inexpensive, simple, nontoxic, i.e. ecologically acceptable and can be used for the assay of fluconazole from this type of formulations. 9. References [1] J. Andre, “The Normal Nail,” In: A. O. Barel, M. Paye and H. I. Maibach, Eds., Handbook of Cosmetic Science and Technology, Marcel Dekker, New York, 2001, pp. 29-34. [2] J. Obadiah and R. Scher, “Nail Disorders: Unapproved Treatments,” Clinical Dermatology, Vol. 20, No. 6, 2002, pp. 643-648. doi:10.1016/S0738-081X(02)00285-7 [3] P. Rich, R. K. Scher, D. Breneman, R. C. Savin, D. S. Feingold, N. Konnikov, J. L. Shupack, S. Pinnell, N. Le- vine, N. J. Lowe, R. Aly, R. B. Odom, D. L. Greer, M. R. Morman, A. D. Bucko, E. H. Tschen, B. E. Elewski, E. B. Smith and J. Hilbert, “Pharmacokinetics of Three Doses of Once-Weekly Fluconazole (150, 300, 450 mg) in Dis- tal Subungual Onychomycosis of the Toenail,” Journal of the American Academy Dermatology, Vol. 38, No. 6, 1998, pp. 103-109. doi:10.1016/S0190-9622(98)70493-1 [4] R. C. Savin, L. Drake, D. Babel, D. M. Stewart, P. Rich, M. R. Ling, D. Breneman, R. K. Scher, A. G. Martin, D. M. Pariser, R. J. Pariser, C. N. Ellis, S. Kang, D. Fried- man, H. I. Katz, C. J. McDonald, J. Muglia, G. Webster, B. E. Elewski, J. J. Leyden, A. D. Bucko, E. H. Tschen, J. M. Hanifin, M. R. Morman, J. L. Shupack, N. Levine, N. J. Lowe, W. F. Bergfeld, C. Camisa, D. S. Feingold, N. Konnikov, R. B. Odom, R. Aly, D. L. Greer and J. Hil- bert, “Pharmacokinetics of Three Once-Weekly Dosages of Fluconazole (150, 300, or 450 mg) in Distal Subungual Onychomycosis of the Fingernail,” Journal of the Americ- an Academy Dermatology, Vol. 38, No. 6, 1998, pp. 110-116. doi:10.1016/S0190-9622(98)70494-3 [5] G. K. McEvoy, “Pharmacist’s Drug Handbook,” Ameri- can Society of Health-System Pharmacists Corp., Wash- ington D.C., 2001. [6] S. Murdan, “Drug Delivery to the Nail Following Topical Application,” International Journal of Pharmaceutics, Vol. 236, No. 1-2, 2002, pp. 1-26. doi:10.1016/S0378-5173(01)00989-9 [7] J. W. Wegener, J. C. Klamer, H. Govers and U. A. Th. Brinkman, “Determination of Organic Colorants in Cos- metic Products by High-Performance Liquid Chromatog- raphy,” Chromatographia, Vol. 24, No. 1, 1987, pp. 865-875. doi:10.1007/BF02688601 [8] S. C. Rastogi, V. J. Barwick and S. V. Carter, “Identifica- tion of Organic Colourants in Cosmetics by HPLC-Diode Array Detection,” Chromatographia, Vol. 45, No. 1, 1997, pp. 215-228. doi:10.1007/BF02505563 [9] R. T. Rivero and V. Topiwala, “Quantitative Determina- tion of Formaldehyde in Cosmetics Using a Combined Solid-Phase Microextraction-Isotope Dilution Mass Spec- trometry Method,” Journal of Chromatography A, Vol. 1029, No. 1-2, 2004, pp. 217-222. doi:10.1016/j.chroma.2003.12.054 [10] D. De Orsi, L. Gagliardi, R. Porra, S. Berri, P. Chimenti, A. Granese, I. Carpani and D. Tonelli, “A Environmen- tally Friendly Reversed-Phase Liquid Chromatography Method for Phthalates Determination in Nail Cosmetics,” 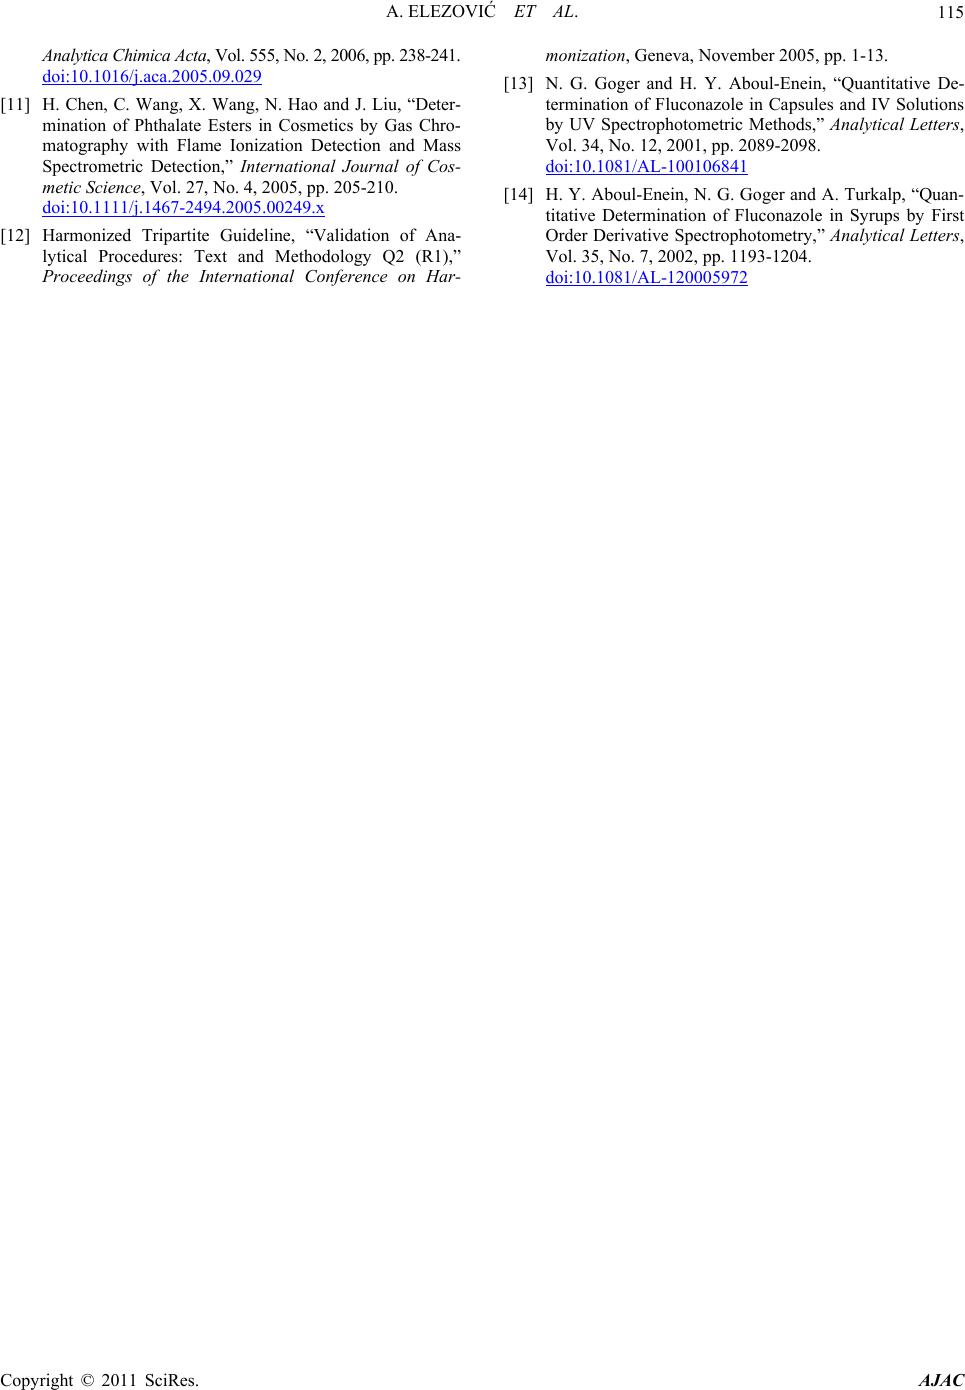 A. ELEZOVIĆ ET AL.115 Analytica Chimica Acta, Vol. 555, No. 2, 2006, pp. 238-241. doi:10.1016/j.aca.2005.09.029 [11] H. Chen, C. Wang, X. Wang, N. Hao and J. Liu, “Deter- mination of Phthalate Esters in Cosmetics by Gas Chro- matography with Flame Ionization Detection and Mass Spectrometric Detection,” International Journal of Cos- metic Science, Vol. 27, No. 4, 2005, pp. 205-210. doi:10.1111/j.1467-2494.2005.00249.x [12] Harmonized Tripartite Guideline, “Validation of Ana- lytical Procedures: Text and Methodology Q2 (R1),” Proceedings of the International Conference on Har- monization, Geneva, November 2005, pp. 1-13. [13] N. G. Goger and H. Y. Aboul-Enein, “Quantitative De- termination of Fluconazole in Capsules and IV Solutions by UV Spectrophotometric Methods,” Analytical Letters, Vol. 34, No. 12, 2001, pp. 2089-2098. doi:10.1081/AL-100106841 [14] H. Y. Aboul-Enein, N. G. Goger and A. Turkalp, “Quan- titative Determination of Fluconazole in Syrups by First Order Derivative Spectrophotometry,” Analytical Letters, Vol. 35, No. 7, 2002, pp. 1193-1204. doi:10.1081/AL-120005972 Copyright © 2011 SciRes. AJAC |