

Paper Menu >>
Journal Menu >>
 Journal of Power and Energy Engineering, 2013, 1, 7-15 http://dx.doi.org/10.4236/jpee.2013.15002 Published Online October 2013 (http://www.scirp.org/journal/jpee) Copyright © 2013 SciRes. JPEE 7 Addressing the Challenge of I nterpreting Microclimat i c Weather Data Collected from Urb an Sites L. Bourikas1, T. Shen2, P. A. B. James1, D. H. C. Chow2, M. F. Jentsch3, J. Darkwa2, A. S. Bahaj1 1Sustainable Energy Research Group (SERG), University of Southampton, Southampton, UK; 2Centre for Sustainable Energy Tech- nologies (CSET), University of Nottingham, Ningbo, China; 3Urban Energy Systems, Bauhaus-Universität, Weimar, G ermany. Email: [email protected] Received August 2013 ABSTRACT This paper presents some installation and data analysis issues from an ongoing urban air temperature and humidity measurement campaign in Hangzhou and Ningbo, China. The location of the measurement sites, th e positioning of the sensors and the harsh conditions in an urban environment can result in missing values and observations that are unre- presentative of the local urban microclimate. Missing data and erroneous values in micro-scale weather time series can produce bias in the data analysis, false correlations and wrong conclusions when deriving the specific local weather patterns. A methodology is presented for the identification of values that could be false and for determining whether these are “noise”. Seven statistical methods were evaluated in their performance for replacing missing and erroneous values in urban weather time series. The two methods that proposed replacement with the mean values from sensors in locations with a Sky View Factor similar to that of the target sensor and the sensor s closest to the target’s location per- formed well for all Day-Night and Cold-Warm days scenarios. However, during night time in warm weather the re- placement with the mean values for air temperature of the nearest locations outperformed all other methods. The results give some initial evidence of the distinctive urban microclimate development in time and space under different regional weather forcings. Keywords: Urban Microclimate Observations; Installation Challenges; Weather Data Time Series Analysis; Missing Data 1. Introduction In the current decade from 2010 to 2020 the urban popu- lation of China is expected to exceed the rural one for the first time in history [1]. In the Zhejiang Province, cities such as Hangzhou and Ningbo are developing into finan- cial centres attracting still more people from the countr y- side. Over the next decade the borders of these urban agglomerations are expected to expand further. The new population will put pressures on the existing transporta- tion, water supply, sewage and energy infrastructures. The expansion of city borders and the changes in land use as well as building density usually have a prominent, and often ominous, effect on the air temperature devel- opment within the urban canopy layer (the part of the atmosphere from ground level up to average building height) [ 2] . An informed mitigation strategy at th e initial stages of urban planning is, therefore, of paramount importance. Common practice in making such informed urban design decisions is to rely on simulation results. Simulation models are typically dr iven by weather data for the place of study. Commonly available weather data files have a typical meteorological year format that is based on his- torical hourly data which were usually collected at air- ports. However, these historical datasets largely underes- timate the effects of the urban microclimate and do not represent of locations within the city where the local sp e- cific microclimates develop [3]. Despite the “urbanisation” of regional weather predic- tion models [4,5] and the development of micro-climatic models that solve the urban energy balance [6, 7], there is still a need for simple urban weather forecasting models [8,9] that would produce urban and building simulation ready weather data-series adapted to the local micro- climate within an acceptable accuracy. This paper reports on an on-going air temperature and humidity measurement campaign in Hangzhou and Ningbo, China and details key issues regarding the weather data time series analysis as a baseline for pro- ducing a methodology for the micro-climatic adaptation of commonly available weather data files. 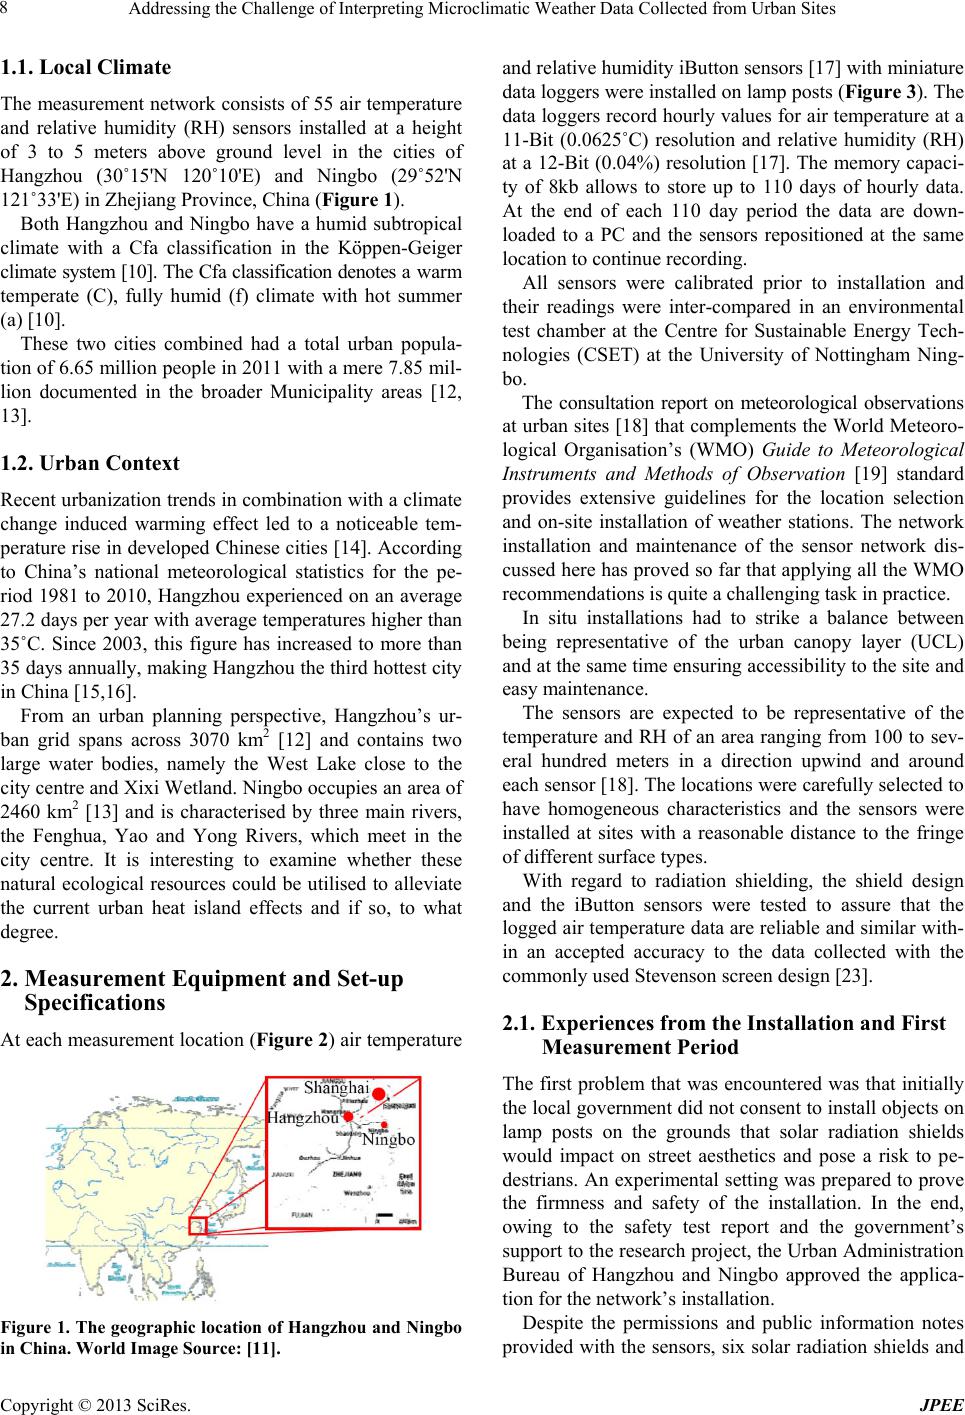 Addressing the Challenge of Interpreting Microclimatic Weather Data Collected from Urban Sites Copyright © 2013 SciRes. JPEE 8 1.1. Local Climate The measurement network consists of 55 air temperature and relative humidity (RH) sensors installed at a height of 3 to 5 meters above ground level in the cities of Hangzhou (30˚15'N 120˚10'E) and Ningbo (29˚52'N 121˚33'E) in Zhejiang Province, China (Figure 1). Both Hangzhou and Ningbo have a humid subtropical climate with a Cfa classification in the Köppen-Geiger climate system [10]. The Cfa classification denotes a warm temperate (C), fully humid (f) climate with hot summer (a) [10]. These two cities combined had a total urban popula- tion of 6.65 million people in 2011 with a mere 7.85 mil- lion documented in the broader Municipality areas [12, 13]. 1.2. Urban Context Recent urbanization trends in combination with a climate change induced warming effect led to a noticeable tem- perature rise in developed Chinese cities [14]. According to China’s national meteorological statistics for the pe- riod 1981 to 2010, Hangzhou experienced on an average 27.2 days per year with average temperatures higher than 35˚C. Since 2003, this figure has increased to more than 35 days annually, making Hangzhou the third hottest city in China [15,16]. From an urban planning perspective, Hangzhou’s ur- ban grid spans across 3070 km2 [12] and contains two large water bodies, namely the West Lake close to the city centre and Xixi Wetland. Ningbo occupies an area of 2460 km2 [13] and is characterised by three main rivers, the Fenghua, Yao and Yong Rivers, which meet in the city centre. It is interesting to examine whether these natural ecological resources could be utilised to alleviate the current urban heat island effects and if so, to what degree. 2. Measurement Equipment and Set-up Specifications At each measurement location (Figure 2) air temperature Figure 1. The geographic location of Hangzhou and Ningbo in China. World Image Source: [11]. and relative humidity iButto n sen sor s [17] with miniature data loggers were installed on lamp posts (Figure 3) . The data loggers record hourly values for air temperature at a 11-Bit (0.0625˚C) resolution and relative humidity (RH) at a 12-Bit (0.04%) resolution [17]. The memory capaci- ty of 8kb allows to store up to 110 days of hourly data. At the end of each 110 day period the data are down- loaded to a PC and the sensors repositioned at the same location to continue recording. All sensors were calibrated prior to installation and their readings were inter-compared in an environmental test chamber at the Centre for Sustainable Energy Tech- nologies (CSET) at the University of Nottingham Ning- bo. The consultation report on meteorological observations at urban sites [18] that complements the World Meteoro- logical Organisation’s (WMO) Guide to Meteorological Instruments and Methods of Observation [19] standard provides extensive guidelines for the location selection and on-site installation of weather stations. The network installation and maintenance of the sensor network dis- cussed here has proved so far that applying all the WMO recommendations is quite a challenging task in practice. In situ installations had to strike a balance between being representative of the urban canopy layer (UCL) and at the same time ensuring accessibility to the site and easy maintenance. The sensors are expected to be representative of the temperature and RH of an area ranging from 100 to sev- eral hundred meters in a direction upwind and around each sensor [18]. The locations were carefully selected to have homogeneous characteristics and the sensors were installed at sites with a reasonable distance to the fringe of different surface types. With regard to radiation shielding, the shield design and the iButton sensors were tested to assure that the logged air temperature data are reliable and similar with- in an accepted accuracy to the data collected with the commonly used Stevenson screen design [23]. 2.1. Experiences from th e Installation and First Measurement P eriod The first problem that was encountered was that initially the local government did not consent to install objects on lamp posts on the grounds that solar radiation shields would impact on street aesthetics and pose a risk to pe- destrians. An experimental setting was prepar ed to prove the firmness and safety of the installation. In the end, owing to the safety test report and the government’s support to the research project, the Urban Administration Bureau of Hangzhou and Ningbo approved the applica- tion for the network’s installation. Despite the permissions and public information notes provided with the sensors, six solar radiation shields and 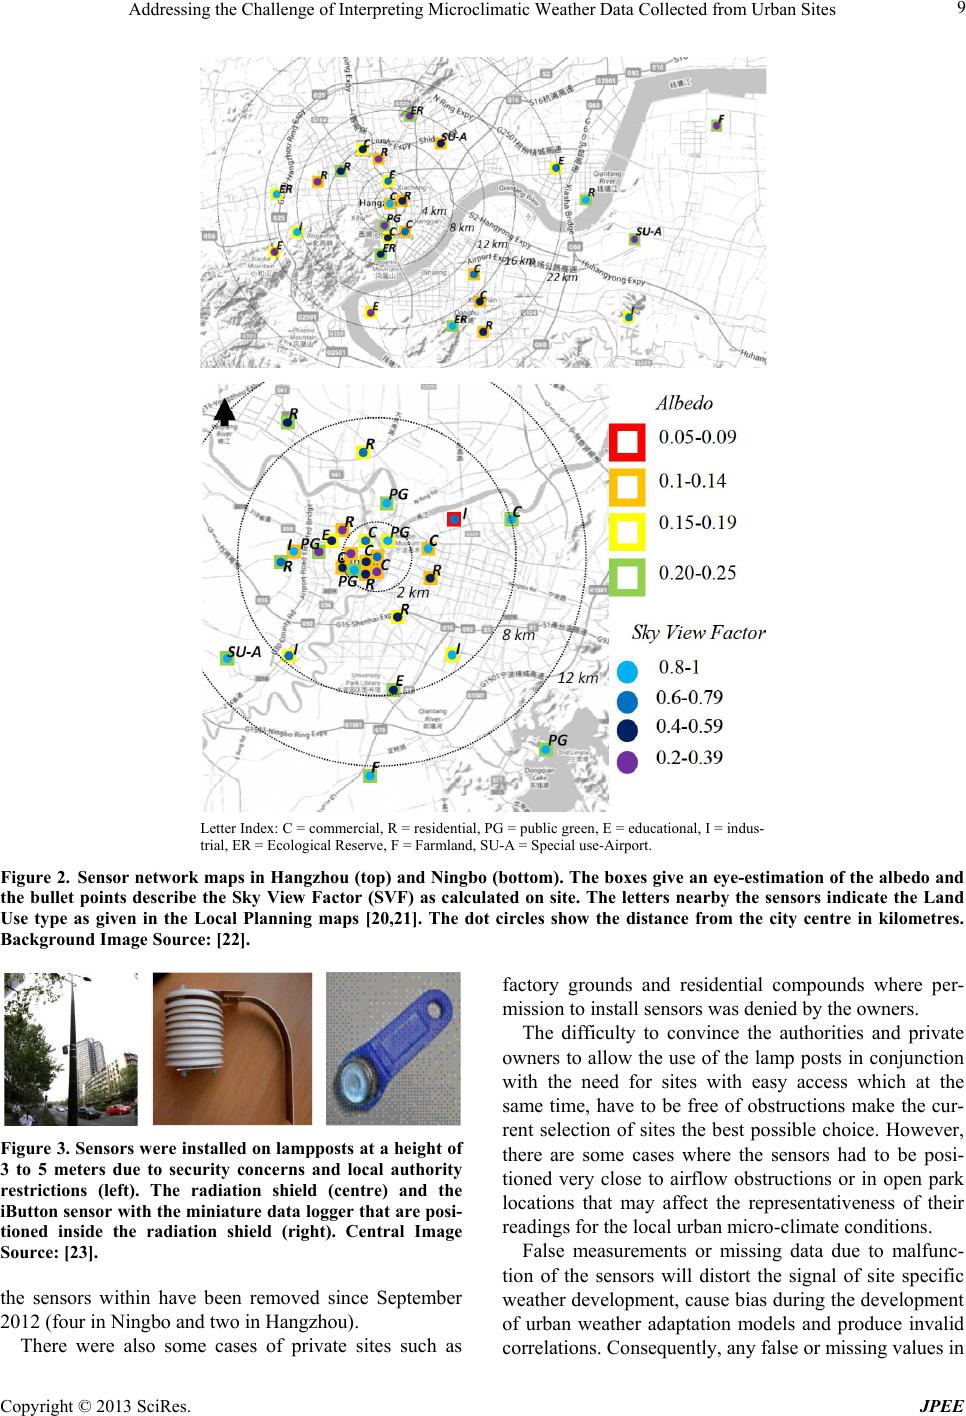 Addressing the Challenge of Interpreting Microclimatic Weather Data Collected from Urban Sites Copyright © 2013 SciRes. JPEE 9 Letter Index: C = commercial, R = residential, PG = public green, E = educational, I = indus- trial, ER = Ecological Reserve, F = Farmland, SU-A = Special use-Airport. Figure 2. Sensor network maps in Hangzhou (top) and Ningbo (bottom). The boxes give an eye-estimation of the albedo and the bullet points describe the Sky View Factor (SVF) as calculated on site. The letters nearby the sensors indicate the Land Use type as given in the Local Planning maps [20,21]. The dot circles show the distance from the city centre in kilometres. Background Image Source: [22]. Figure 3. Sensors were installed on lampposts at a height of 3 to 5 meters due to security concerns and local authority restrictions (left). The radiation shield (centre) and the iButton sensor with the miniature data logger that are posi- tioned inside the radiation shield (right). Central Image Source: [23]. the sensors within have been removed since September 2012 (fou r in Ningbo and two in Hang z hou). There were also some cases of private sites such as factory grounds and residential compounds where per- mission to install sensors was deni e d by the owne rs . The difficulty to convince the authorities and private owners to allow the use of the lamp posts in conjunction with the need for sites with easy access which at the same time, have to be free of obstructions make the cur- rent selection of sites the best possible choice. However, there are some cases where the sensors had to be posi- tioned very close to airflow obstructions or in open park locations that may affect the representativeness of their readings for the local urban micro-climate conditio ns. False measurements or missing data due to malfunc- tion of the sensors will distort the signal of site specific weather development, cause bias during the development of urban weather adaptation models and produce invalid correlations. Consequently, any false or missing values in  Addressing the Challenge of Interpreting Microclimatic Weather Data Collected from Urban Sites Copyright © 2013 SciRes. JPEE 10 the time series must be identified and effectively replaced. 2.2. Data Analysis and Interpretation in the Urban Context The weather data time series collected from the sensors’ network were, in a first step, examined to identify any noise in the form of outliers in the datasets. It was found that RH values were often above 100% regardless of the sensor and its location. A simple algorithm was applied to cap the RH values at 100% levels. The scatter and frequency of the erroneous RH data indicates that the most probable cause is a sensor’s drift due to pollution, water spray and general degradation. In a second stage, boxplots of the hourly air tempera- ture distribution per week were created with IBM SPSS Statistics Ver.19 [24] for each sensor’s location in Hangzhou (see Figure 2). All outliers were traced back to the data sample. Outliers that showed up in groups of subsequent hours or were common to all sensors at a specific time and day were not treated as potential errors. The remaining outliers were compared against the av- erage hourly air temperature for the same week and the coldest and hottest days of this week respectively (Fig- ure 4). The range of hourly changes on each measure- ment site (Figure 5) was also assessed against the hourly changes in weather data collected at Mantou Mountain, National Principle weather Station (30˚13'N, 120˚26'E). The interpretation of these tests’ results in view of site specific attributes (i.e. Sky View Factor (where SVF is an index (0 to 1) of the unobstructed sky area which can be seen from a given point), albedo, building height to street width aspect ratio, impermeable to permeable sur- face ratio, surrounding materials’ properties) can lead to conclusions for the weight of each parameter and their role in the local urban micro-climate’s development in time and space. 3. Case Study for the Replacement of Missing/False Data in Urban Observations Datasets Seven cases (Table 1) have been investigated for replac- ing false data readings and missing values in urban weath- er measurements. The first three cases involved the use of statistical pre- diction models with the existing dataset and application of these models to the forecast of missing data (Cases 1-3 in Table 1). These models estimate the level, seasonal change and trend for the data that are put into the models and predict the time series’ development [24]. The remaining four cases were based on the replace- Figure 4. Comparison of hourly air temperature to the weekly trend and extreme days in the week. 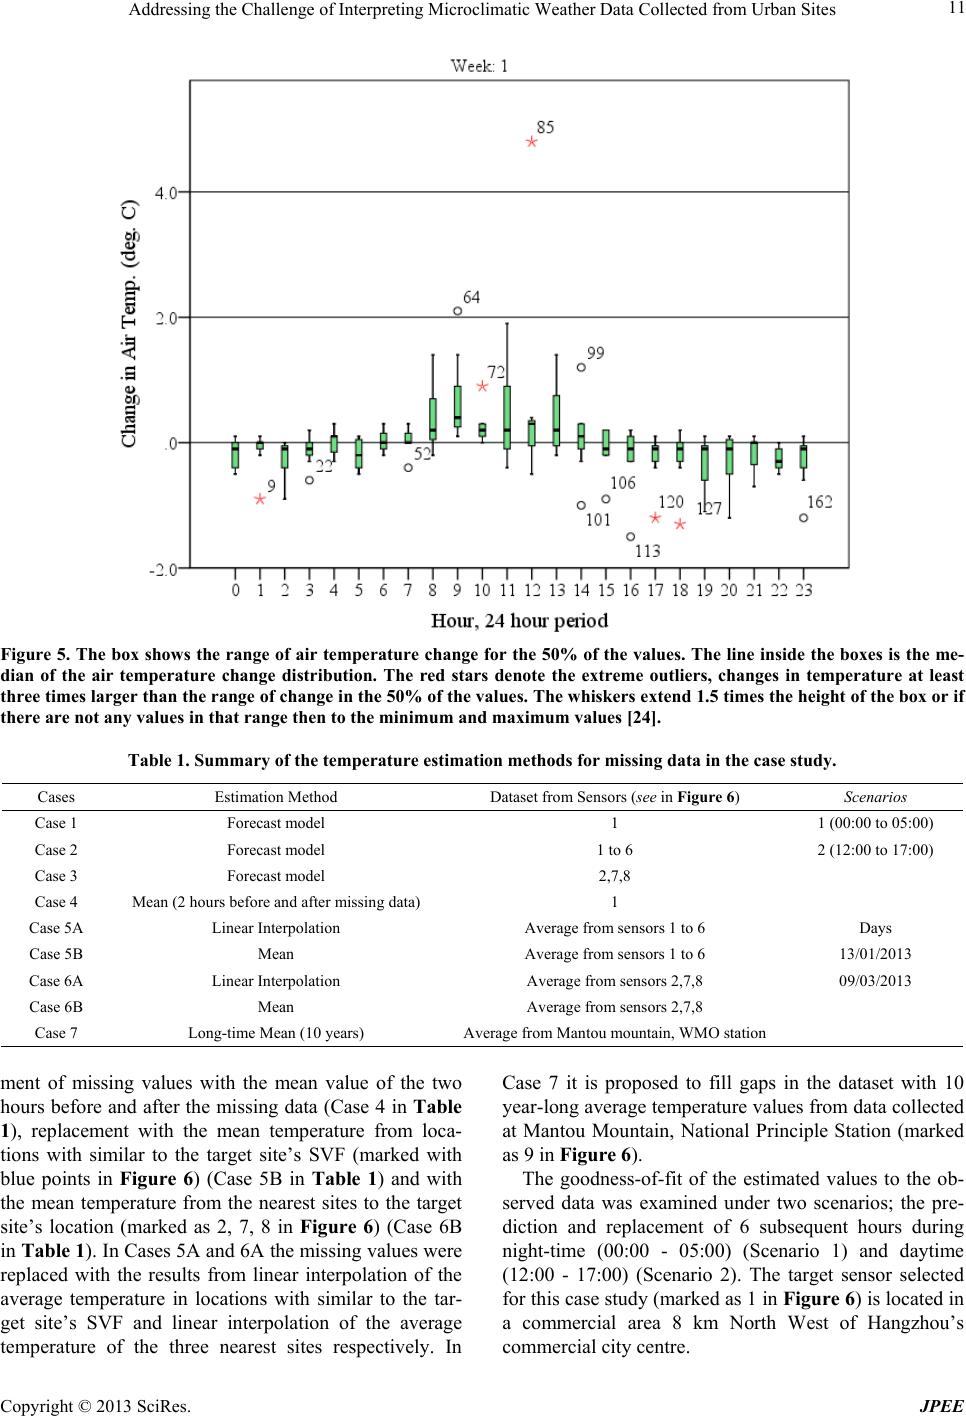 Addressing the Challenge of Interpreting Microclimatic Weather Data Collected from Urban Sites Copyright © 2013 SciRes. JPEE 11 Figure 5. The box shows the range of air temperature change for the 50% of the values. The line inside the boxes is the me- dian of the air temperature change distribution. The red stars denote the extreme outliers, changes in temperature at least three times larger than the range of change in the 50% of the values. The whiskers extend 1.5 times the height of the box or if there are not any values in that range then to the minimum and maximum values [24]. Table 1. Summary of the temperature estimation methods for missing data in the case study. Cases Estimation Method Dataset from Sensors (see in Figure 6) Scenarios Case 1 Forecast model 1 1 (00:00 to 05:00) Case 2 Forecast model 1 to 6 2 (12:00 to 17:00) Case 3 Forecast model 2,7,8 Case 4 Mean (2 hours before and after missing data) 1 Case 5A Linear Interpolation Average from sensors 1 to 6 Days Case 5B Mean Average from sensors 1 to 6 13/01/2013 Case 6A Linear Interpolation Average from sensors 2,7,8 09/03/2013 Case 6B Mean Average from sensors 2,7,8 Case 7 Long-time Mean (10 years) Average from Mantou mountain, WMO station ment of missing values with the mean value of the two hours before and after the missing data (Case 4 in Table 1), replacement with the mean temperature from loca- tions with similar to the target site’s SVF (marked with blue points in Figure 6) (Case 5B in Table 1) and with the mean temperature from the nearest sites to the target site’s location (marked as 2, 7, 8 in Figure 6) (Case 6B in Tab le 1). In Cases 5A and 6A the missing values were replaced with the results from linear interpolation of the average temperature in locations with similar to the tar- get site’s SVF and linear interpolation of the average temperature of the three nearest sites respectively. In Case 7 it is proposed to fill gaps in the dataset with 10 year-long average temperature values from data collected at Mantou Mountain, National Principle Station (marked as 9 in Figure 6). The goodness-of-fit of the estimated values to the ob- served data was examined under two scenarios; the pre- diction and replacement of 6 subsequent hours during night-time (00:00 - 05:00) (Scenario 1) and daytime (12:00 - 17:00) (Scenario 2). The target sensor selected for this case study (marked as 1 in Figure 6) is located in a commercial area 8 km North West of Hangzhou’s commercial city centre. 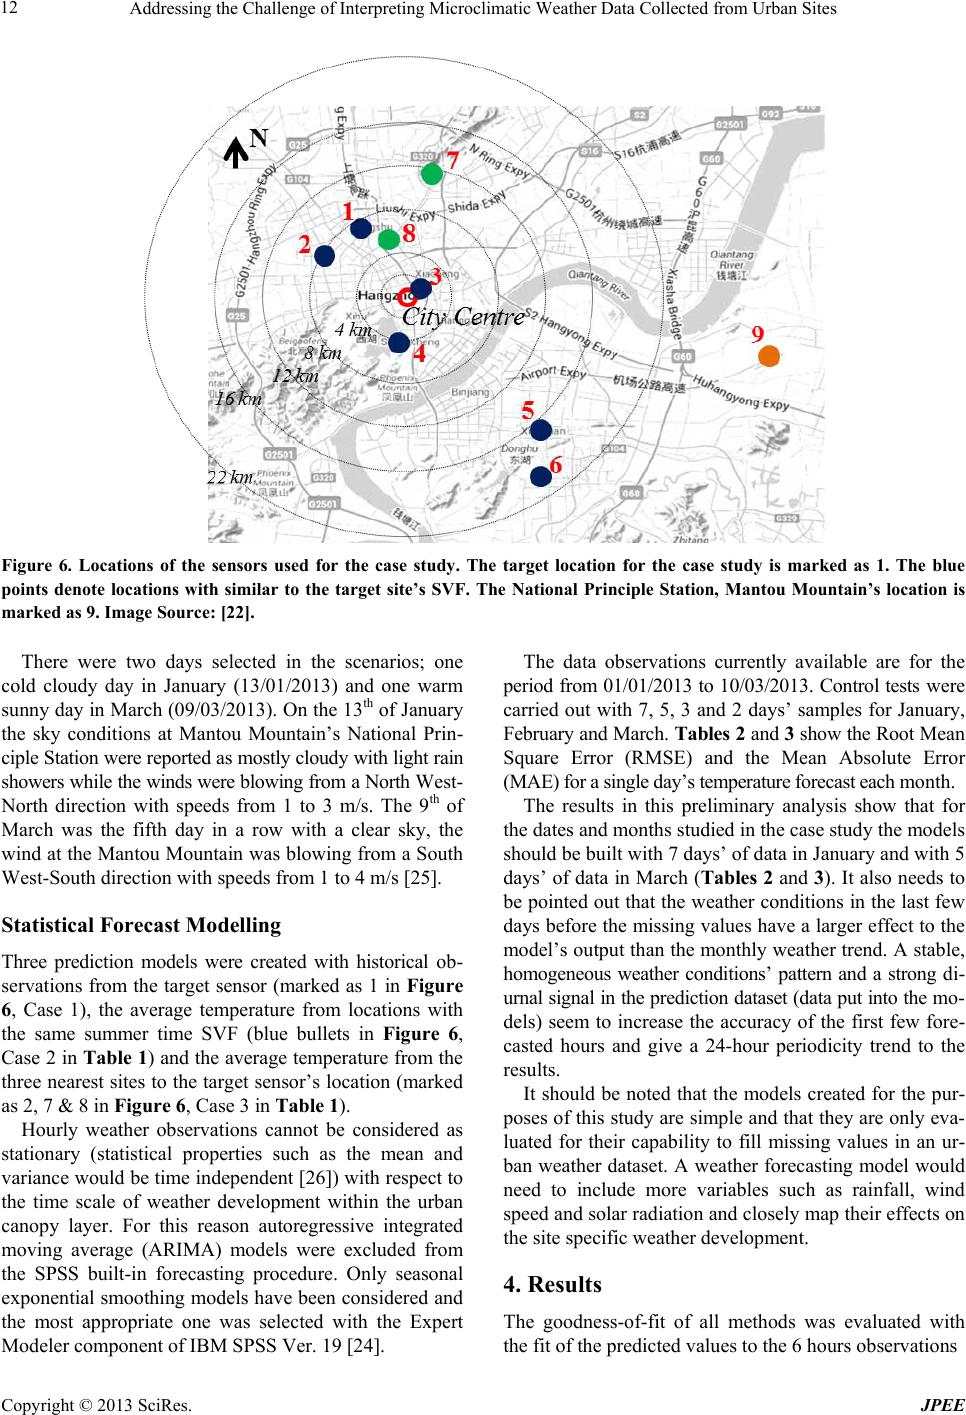 Addressing the Challenge of Interpreting Microclimatic Weather Data Collected from Urban Sites Copyright © 2013 SciRes. JPEE 12 Figure 6. Locations of the sensors used for the case study. The target location for the case study is marked as 1. The blue points denote locations with similar to the target site’s SVF. The National Principle Station, Mantou Mountain’s location is marked as 9. Image Source: [22]. There were two days selected in the scenarios; one cold cloudy day in January (13/01/2013) and one warm sunny day in March (09/03/2013). On the 13th of January the sky conditions at Mantou Mountain’s National Prin- ciple S tatio n were reported as mostly cloudy with light rain showers while the winds were blow ing from a North West- North direction with speeds from 1 to 3 m/s. The 9th of March was the fifth day in a row with a clear sky, the wind at the Mantou Mountain was blowing from a South West-South direction with speeds from 1 to 4 m/s [25]. Statistical Forecast Modelling Three prediction models were created with historical ob- servations from the target sensor (marked as 1 in Figure 6, Case 1), the average temperature from locations with the same summer time SVF (blue bullets in Figure 6, Case 2 in Tab le 1) and the average temperature from the three nearest sites to the target sensor’s location (marked as 2, 7 & 8 in Figure 6, Case 3 in Table 1). Hourly weather observations cannot be considered as stationary (statistical properties such as the mean and variance would be time independent [26]) with respect to the time scale of weather development within the urban canopy layer. For this reason autoregressive integrated moving average (ARIMA) models were excluded from the SPSS built-in forecasting procedure. Only seasonal exponential smoothing models have been considered and the most appropriate one was selected with the Expert Modeler component of IBM SPSS Ve r. 1 9 [ 24]. The data observations currently available are for the period from 01/01/2013 to 10/03/2013. Control tests were carried out with 7, 5, 3 and 2 days’ samples for January, February and March. Ta bles 2 and 3 show the Root Mean Square Error (RMSE) and the Mean Absolute Error (MAE) for a single day ’s temperat ure forecast each month. The results in this preliminary analysis show that for the dates and months studied in the case study the models should be built with 7 days’ of data in January and with 5 days’ of data in Mar ch (Tab les 2 and 3). It also needs to be pointed out that the weather conditions in the last few days before the missing values have a larger effect to the model’s output than the monthly weather trend. A stable, homogeneous weather conditions’ pattern and a strong di- urnal signal in the prediction dataset (data put into the mo- dels) seem to increase the accuracy of the first few fore- casted hours and give a 24-hour periodicity trend to the results. It should be noted that the models created for the pur- poses of this study are simple and that they are only eva- luated for their capability to fill missing values in an ur- ban weather dataset. A weather forecasting model would need to include more variables such as rainfall, wind speed and solar radiation and closely map their effects on the site specific weather development. 4. Results The goodness-of-fit of all methods was evaluated with the fit of t he predicte d va l ue s to the 6 h ou rs observat ions 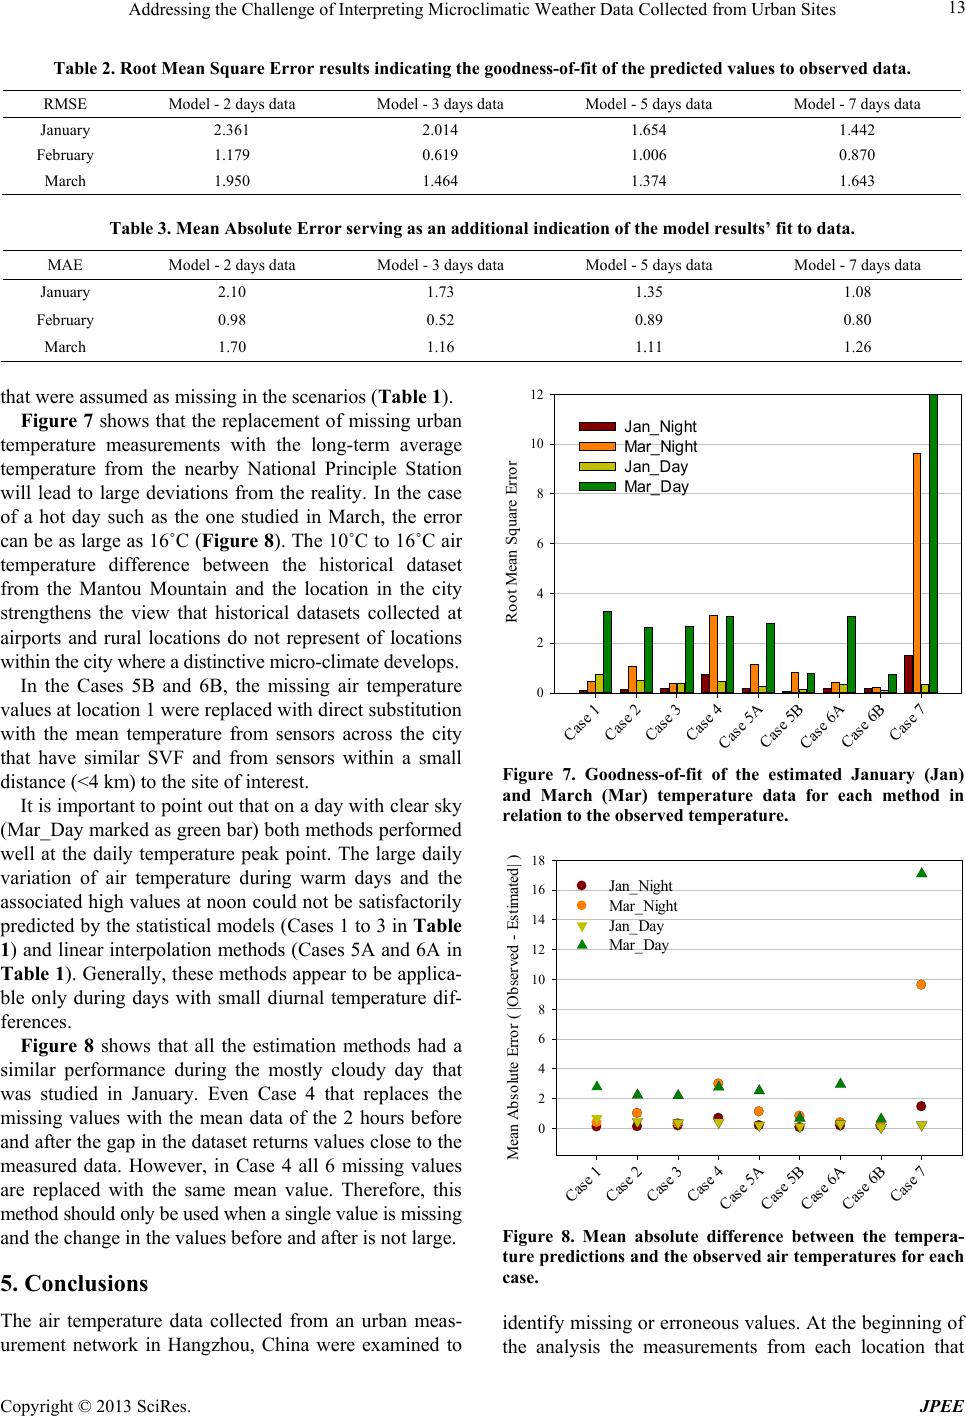 Addressing the Challenge of Interpreting Microclimatic Weather Data Collected from Urban Sites Copyright © 2013 SciRes. JPEE 13 Table 2. Root Mean Square Error results indicating the goodness-of-fit of the predicted values to observed data. RMSE Model - 2 days data Model - 3 days data Model - 5 day s data Model - 7 days data January 2.361 2.014 1.654 1.442 February 1.179 0.619 1.006 0.870 March 1.950 1.464 1.374 1.643 Table 3. Mean Absolute Error serving as an additional indication of the model results’ fit to data. MAE Model - 2 days data Model - 3 days data Model - 5 days data Model - 7 days data January 2.10 1.73 1.35 1.08 February 0.98 0.52 0.89 0.80 March 1.70 1.16 1.11 1.26 that were assumed as missing in the scenarios (Table 1). Figure 7 shows that the replacement of missing urban temperature measurements with the long-term average temperature from the nearby National Principle Station will lead to large deviations from the reality. In the case of a hot day such as the one studied in March, the error can be as large as 16˚C (F igure 8). The 10˚C to 16˚C air temperature difference between the historical dataset from the Mantou Mountain and the location in the city strengthens the view that historical datasets collected at airports and rural locations do not represent of locations within the city where a distinctive micro-climate develops. In the Cases 5B and 6B, the missing air temperature values at location 1 were replaced with direct substitution with the mean temperature from sensors across the city that have similar SVF and from sensors within a small distance (<4 km) to the site of interest. It is important to point ou t that on a day with clear sky (Mar_Day marked as green bar) both methods performed well at the daily temperature peak point. The large daily variation of air temperature during warm days and the associated high values at noon could not be satisfactorily predicted by the statistical models (Cases 1 to 3 in Table 1) and linear interpolation methods (Cases 5A and 6A in Table 1). Generally, these methods appear to be applica- ble only during days with small diurnal temperature dif- ferences. Figure 8 shows that all the estimation methods had a similar performance during the mostly cloudy day that was studied in January. Even Case 4 that replaces the missing values with the mean data of the 2 hours before and after the gap in the dataset returns values close to the measured data. However, in Case 4 all 6 missing values are replaced with the same mean value. Therefore, this method should only be used when a single value is missing and the change in the values before and after is not large. 5. Conclusions The air temperature data collected from an urban meas- urement network in Hangzhou, China were examined to Figure 7. Goodness-of-fit of the estimated January (Jan) and March (Mar) temperature data for each method in relation to the observed temperature. Figure 8. Mean absolute difference between the tempera- ture predictions and the observed air temperatures for each case. identify missing or erroneous values. At the beginning of the analysis the measurements from each location that C ase 1 C ase 2 C ase 3 C ase 4 C ase 5A C ase 5B C ase 6A C ase 6B C ase 7 R oot Mean Square Error 0 2 4 6 8 10 12 J an_Night Mar_Night Jan_Day Mar_Day C ase 1 C ase 2 C ase 3 C ase 4 C ase 5A C ase 5B C ase 6A C ase 6B C ase 7 Mean Absolute Erro r ( |O bserved - Estimated | ) 0 2 4 6 8 10 12 14 16 18 Jan_Night Mar_Night Jan_Day Mar_Day 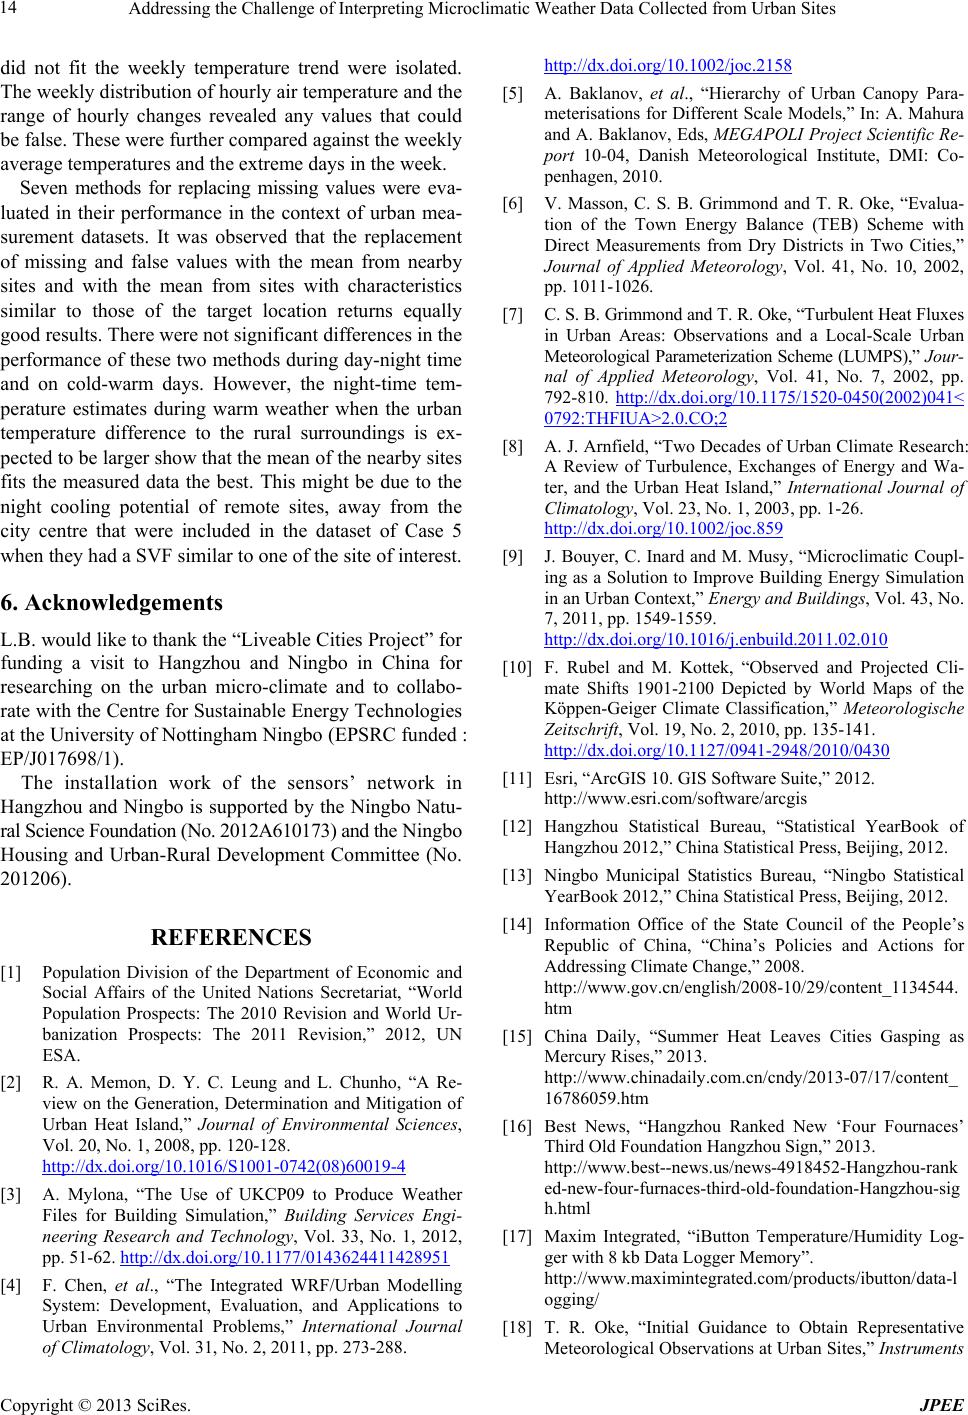 Addressing the Challenge of Interpreting Microclimatic Weather Data Collected from Urban Sites Copyright © 2013 SciRes. JPEE 14 did not fit the weekly temperature trend were isolated. The weekly distribution of hourly air temperature and the range of hourly changes revealed any values that could be false. These were further compared against the weekly average temperatures and the extreme days in the week. Seven methods for replacing missing values were eva- luated in their performance in the context of urban mea- surement datasets. It was observed that the replacement of missing and false values with the mean from nearby sites and with the mean from sites with characteristics similar to those of the target location returns equally good results. There were not significant differences in the performance of these two methods during day-night time and on cold-warm days. However, the night-time tem- perature estimates during warm weather when the urban temperature difference to the rural surroundings is ex- pected to be larger show that the mean of the nearby sites fits the measured data the best. This might be due to the night cooling potential of remote sites, away from the city centre that were included in the dataset of Case 5 when they had a SVF similar to one of the site of interest. 6. Acknowledgements L.B. would like to thank th e “Liveable Cities Proj ect” for funding a visit to Hangzhou and Ningbo in China for researching on the urban micro-climate and to collabo- rate with the Centre for Sustainable Energy Technologies at the University of Nottingha m Ningbo (EPSRC funded : EP/J017698/1). The installation work of the sensors’ network in Hangzhou and Ningbo is supported by the Ningbo Natu- ral Science Foundation (No. 2012A610173) and the Ningbo Housing and Urban-Rural Development Committee (No. 201206). REFERENCES [1] Population Division of the Department of Economic and Social Affairs of the United Nations Secretariat, “World Population Prospects: The 2010 Revision and World Ur- banization Prospects: The 2011 Revision,” 2012, UN ESA. [2] R. A. Memon, D. Y. C. Leung and L. Chunho, “A Re- view on the Generation, Determination and Mitigation of Urban Heat Island,” Journal of Environmental Sciences, Vol. 20, No. 1, 2008, pp. 120-128. http://dx.doi.org/10.1016/S1001-0742(08)60019-4 [3] A. Mylona, “The Use of UKCP09 to Produce Weather Files for Building Simulation,” Building Services Engi- neering Research and Technology, Vol. 33, No. 1, 2012, pp. 51-62. http://dx.doi.org/10.1177/0143624411428951 [4] F. Chen, et al., “The Integrated WRF/Urban Modelling System: Development, Evaluation, and Applications to Urban Environmental Problems,” International Journal of Climatology, Vol. 31, No. 2, 2011, pp. 273-288. http://dx.doi.org/10.1002/joc.2158 [5] A. Baklanov, et al., “Hierarchy of Urban Canopy Para- meterisations for Different Scale Models,” In: A. Mahura and A. Baklanov, Eds, MEGAPOLI Project Scientific Re- port 10-04, Danish Meteorological Institute, DMI: Co- penhagen, 2010. [6] V. Masson, C. S. B. Grimmond and T. R. Oke, “Evalua- tion of the Town Energy Balance (TEB) Scheme with Direct Measurements from Dry Districts in Two Cities,” Journal of Applied Meteorology, Vol. 41, No. 10, 2002, pp. 1011-1026. [7] C. S. B. Grimmond and T. R. Oke, “Turbulent Hea t Fluxes in Urban Areas: Observations and a Local-Scale Urban Meteorological Parameterization Scheme (LUMPS),” Jour- nal of Applied Meteorology, Vol. 41, No. 7, 2002, pp. 792-810. http://dx.doi.org/10.1175/1520-0450(2002)041< 0792:THFIUA>2.0.CO;2 [8] A. J. Arnfield, “Two Decades of Urban Climate Research: A Review of Turbulence, Exchanges of Energy and Wa- ter, and the Urban Heat Island,” International Journal of Climatology, Vol. 23, No. 1, 2003, pp. 1-26. http://dx.doi.org/10.1002/joc.859 [9] J. Bouyer, C. Inard and M. Musy, “Microclimatic Coupl- ing as a Solution to Improve Building Energy Simulation in an Urban Context,” Energy and Buildings, Vol. 43, No. 7, 2011, pp. 1549-1559. http://dx.doi.org/10.1016/j.enbuild.2011.02.010 [10] F. Rubel and M. Kottek, “Observed and Projected Cli- mate Shifts 1901-2100 Depicted by World Maps of the Köppen-Geiger Climate Classification,” Meteorologische Zeitschrift, Vol. 19, No. 2, 2010, pp. 135-141. http://dx.doi.org/10.1127/0941-2948/2010/0430 [11] Esri, “ArcGIS 10. GIS Software Suite,” 2012. http://www.esri.com/software/arcgis [12] Hangzhou Statistical Bureau, “Statistical YearBook of Hangzhou 2012,” China Statistical Press, Beijing, 2012. [13] Ningbo Municipal Statistics Bureau, “Ningbo Statistical YearBook 2012,” China Statistical Press, Beijing, 2012. [14] Information Office of the State Council of the People’s Republic of China, “China’s Policies and Actions for Addressing Climate Change,” 2008. http://www.gov.cn/english/2008-10/29/content_1134544. htm [15] China Daily, “Summer Heat Leaves Cities Gasping as Mercury Rises,” 2013. http://www.chinadaily.com.cn/cndy/2013-07/17/content_ 16786059.htm [16] Best News, “Hangzhou Ranked New ‘Four Fournaces’ Third Old Foundation Hangzhou Sign,” 2013. http://www.best--news.us/news-4918452-Hangzhou-rank ed-new-four-furnaces-third-old-foundation-Hangzhou-sig h.html [17] Maxim Integrated, “iButton Temperature/Humidity Log- ger with 8 kb Data Logger Memory ”. http://www.maximintegrated.com/products/ibutton/data-l ogging/ [18] T. R. Oke, “Initial Guidance to Obtain Representative Meteorological Observations at Urban Sites,” Instruments  Addressing the Challenge of Interpreting Microclimatic Weather Data Collected from Urban Sites Copyright © 2013 SciRes. JPEE 15 and Observing Methods (WMO/TD-No. 1250):47, 2006. http://www.wmo.int/pages/prog/www/IMOP/publications /IOM-81/IOM-81-UrbanMetObs.pdf [19] World Meteorological Organisation, “Guide to Meteoro- logical Instruments and Methods of Observation. Sixth Edition,” WMO-No. 8, Geneva, 1996. [20] Hangzhou Academy of Urban Planning & Design, “Hang- zhou General Planning Map,” Hangzhou, China, 2006. [21] Ningbo Urban Planning Bureau, “Ningbo General Plan- ning Map (2004-2020),” Ningbo, China, 2003. [22] Google Earth, “Satellite Images and Maps of Hangzhou and Ningbo, China,” 2013. [23] H. K. W. Cheung, G. J. Levermore and R. Watkins, “A Low Cost, Easily Fabricated Radiation Shield for Tem- perature Measurements to Monitor Dry Bulb Air Tem- perature in Built Up Urban Areas,” Building Services En- gineering Research and Technology, Vol. 4, No. 31, 2010, pp. 371-380. http://dx.doi.org/10.1177/0143624410376565 [24] IBM Corp., “IBM SPSS Statistics for Windows,” Version 19.0. Released 2010, Armonk, NY: IBM Corp. [25] The Weather Underground, “Hangzhou Weather Data from from Mantou Mountain’s National Principle WMO- Listed Weather Station”. http://www.wunderground.com/ [26] NIST/SEMATECH, “e-Handbook of Statistical Methods,” 2013. http://www.itl.nist.gov/div898/handbook/ |