

Paper Menu >>
Journal Menu >>
 Chinese Studies 2013. Vol.2, No.4, 185-192 Published Online November 2013 in SciRes (http://www.scirp.org/journal/chnstd) http://dx.doi.org/10.4236/chnstd.2013.24030 Open Access 185 Analysis of Rural Drinking Water Status and Improving Strategies in Pu’er Municipality, Yunnan Province of China Zhou Xingwu1*, Jane T. Bertrand2, Li Bingcheng3, Guo Linfeng3, Gabriel Cohen2 1Yunan Institute of Parasitic Diseases, Pu’er City, China 2Department of Global Health System and Development, School of Public Health & Tropical Medicine, Tulane University, New Orleans, USA 3Pu’er Center for Disease Prevention and Control, Pu’er City, China Email: *[email protected] Received July 17th, 2013; revised October 22nd, 2013; accepted November 6th, 2013 Copyright © 2013 Zhou Xingwu et al. This is an open access article distributed under the Creative Commons Attribution License, which permits unrestricted use, distribution, and reproduction in any medium, provided the original work is properly cited. Objective: The study aims to assess Pu’er rural drinking water quality and to investigate the reasons why microbial indexes exceed the national rural drinking water standard. Methods: The study uses existing data obtained from Pu’er rural drinking water monitoring Network. Simultaneously, a series of semi-con- structed in-depth interviews were conducted with key informants. Results: The water samples taken from Pu’er which met the national rural drinking water standard only accounted for 17.5%, while 82.5% of samples did not meet this standard. The P-value of x2 test of total colony and total coliform number with chemical and physical treatment was .195 and .000, treated water and tap water was .175 and .340, dry season and rainy season was .003 and .000. Discussion: The results present that the percentage of water in Pu’er Municipality which meets the national rural drinking water standard is very low. Keywords: Rural Safe Drinking Water; Pathogenic Microorganisms; Rural Residents; Vulnerable Population; Improving Strategies Introduction Rural drinking water is a very important livelihood project. It is involved in a huge vulnerable population. Helping people to gain access to safe drinking water is one of the most important health-related infrastructure programs in the world. As of 2007, around 1.1 billion people were still using unsafe drinking water in the world (World Health Organization, 2007). Accessing rural safe drinking water has become a policy priority in Chi- nese government action plans for comprising more than 70 percent rural residents of China’s total population since 1996. China’s the 11th Five-Year Plan (2006-2010) focuses on the construction of water works and technological innovation for securing water supply and drinking water safety (World Water, 2010). During the 11th Five-Year Plan, the Chinese govern- ment invested a huge amount of funds to resolve the problem of the rural safe drinking water and to provide safe drinking water to most rural residents by 2015. The program has evidently made tremendous progress. It resolves a lot of rural residents’ drinking water problems, but many of the rural residents still lack access to clean and safe drinking water. Pathogenic microorganisms in drinking water, the leading causes of diarrhea, have drawn a lot of attention in public health and other related fields. A recent Chinese study (The Subspe- cialty Groups of Gastroenterology and Infectious Diseases, 2009) found that the diarrheal mortality rate in rural areas of seven Chinese provinces was .51 per thousand persons. In the Fourth National Health Service Survey in 2008, only 41.9 per- cent of rural people had access to water from water treatment plants (Center for Health Statistics and Information, Ministry of Health of the People’s Republic of China, 2009). Currently in rural China, about 300 million rural people are still using un- safe drinking water. The water construction program is still ongoing. In poor Pu’er Municipality of Yunnan Province, West of China, this problem is particularly prominent. This can be inferred from the data and documents from the recent five years water surveillance project from Pu’er Municipal Center for Disease Prevention and Control, in which it is found that Pathogenic microorganisms of most projects exceed the na- tional rural drinking water standard. Pu’er is a large agricultural prefecture level city with 9 coun- ties and 1 district, and a population of 2,542,898 as of Decem- ber, 2010. Among this population ethnic groups were 1,551,313,comprising 61.01% of the total population, whereas, Chinese Han was 991,585, accounting for 38.99%. In addition, rural population is 1,754,600, making up 69.0%, while urban population was 788,298, only covering 31% (Pu’ershi Renkou Pucha Ban’gongshi 普洱市人口普查办公室, 2011). Pu’er belongs to an underdeveloped area. Based on statistics, the annual net income of the rural population is RBM 3456 (about $557.4) (Pu’ershi Tongjijv普洱市统计局, 2010). According to the survey of construction of water infrastructure of Pu’er (Pu’ershi Zhenzhi Xieshang Huiyi 普洱市政治协商会议, 2011), 781,800 rural residents are still waiting to access safe drinking water, accounting for 37.4%. While in the areas where there is access to drinking water, the construction standard of the water projects is quite low and the water sources are rela- *Corresponding author.  ZHOU X. W. ET AL. tively unstable. The local rural residents have cultural norms of eating and cooking raw food, such as salad, and drinking un- boiled water, which could be a great potential threat from the unsafe drinking water. The most dangerous of the issues would potentially bring diseases such as diarrhea or intestinal diseases to the vulnerable population. For the vulnerable population’s health and safe drinking water, the study is trying to obtain the following objectives: 1) To assess Pu’er rural drinking water quality, especially focusing on pathogenic microorganisms by analyzing national monitoring data of rural drinking water. 2) To explore reasons why the microbial index exceeds the national rural water standard. 3) To recommend intervention strategies to improve the qual- ity of safe rural drinking water. Materials and Method The study involved 2 types of data collection: Water Samples Data Collection The study used existing data obtained from Pu’er Municipal- ity Rural Water Supply Projects of Water Quality Monitoring Network of the 11th Five-Year National Plan from 2008-2011 collected by Pu’er Municipal Center for Diseases Prevention and Control. The water samples were collected in dry season and rainy season from treated water and tap water and tested by the GB 5749-2006 National Standard for Rural Drinking Water Quality. The data was collected by stratified random sampling method. At the first stage, the surveillance counties were selected by stratified random sampling according to the proportion of water quality, water source, and treatment, which can typically repre- sent the feature of the central or dispersal water supply of the counties. At the second stage, from the selected counties, monitoring sites were selected by stratified random sampling according to water source, treatment methods, and population covered, but the sites in county capitals were required to be included (The National Office of Patriotic Public Health Cam- paign, 2011). In total, 905 samples from 5 of the 10 counties/districts in Pu’er Municipality in 2008-2011 were collected from monitor- ing sites by 4 different categorized forms: the general informa- tion of central water quality supply of rural monitoring county, water source and water supply, monitoring site information and results of the water sample test, and the pollution events reports. Each entered data included ID number, card number, name of counties and sites, type of water supply, water source, time of completion, invested fund, disinfection methods and facility, population covered, water supply capacity, date of water sam- pled, and test date of water sample. In total, there were 20 in- dexes of water samples tested in labs of Center for Disease Prevention and Control. All of these labs responsible for the data collection and testing had already passed the quality au- thentication of ISO9002. However, most of samples (885 of 905) had no residual chlorine index due to lack of chemical treatment. So the study only used 19 indexes, including 13 physical and chemical indexes, 3 toxic indexes, 3 microorgan- ism indexes, which excluded 1 disinfectant index—free residual chlorine. Semi-Structured Interviews with Key Informants In order to justify and help to explain results of the national water monitoring data in Pu’er Municipality, semi-structured interviews of qualitative method were used to conduct further investigations to perceive depth, richness, and complexity in- herent in the problem as well. The key informants included the relevant water authorities in different levels, the water moni- toring professionals and beneficiaries of villages. The semi-structured interviews only focused on key infor- mants due to lack of funds to support. These informants in- cluded: The water authorities from 2 levels, Pu’er Municipal Gov- ernment and County/district government, who were especially responsible for the rural water project, were identified for inter- views to obtain information about project plan, implementation, monitoring, and evaluation. In order to avoid refusals, espe- cially with some politicians, it was crucial to clearly explain the purpose, necessity, and importance of the survey before the interviews. Professionals responsible for collecting water samples and technicians in labs for testing samples working with the coun- ties and prefecture CDPC were also interviewed to obtain water treatment, training and sample tests, among other information. Some key rural community leaders and villagers near the Pu’er Municipality were identified for interviews to acquire certain information regarding operation, maintenance, and problems. At the same time, the location of the water projects was observed, including source of water, facilities, physical structure and methods used for the treatment of water. Lastly, some of the relevant documents about the project, such as national and local policy, strategy, and water project management were also collected for review. Analysis Methods The study was trying to search for cause and effect relation- ships related to the levels of pathogenic microorganisms. The features of the entire water projects over the 11th Five-Year Plan were comprehensively analyzed to look at Pu’er rural water quality, especially focusing on pathogenic microorganism levels and their trend in different seasons over time, and then to explain some reasons through database analysis. SPSS software was used to analyze the collected data. First, based on the GB 5749-2006 National Standard for Drinking Water Quality, water samples were analyzed to obtain the per- centage of water samples which met the national rural drinking water standard through 13 physical and chemical indexes, 3 toxic indexes, and 3 microorganism indexes. Second, x2 test was used to test the association of water samples which met and did not meet the national rural drinking water standard with the total colony and coliform number among the dry season and rainy season, treated water and tap water, water sample types, and physical and chemical treatment. From the significance of the P value, some potential variables associated with the effect of the water microbial index could be fairly identified. Finally, One Way ANOVA was used to find mean total amount of the microbial levels among 6 sources of water: reservoir, river, ditch and pond, spring, well, and stream. The results of One Way ANOVA could find the association of sources of water with the microorganism levels and help to interpret the quality among 6 sources of water. It was hoped the study could find Open Access 186  ZHOU X. W. ET AL. some clues or evidence of the causality and provide information on the distribution of risk factors. Once interesting and strong associations were observed, they could provide the evidence for designing intervention strategies. Beyond the data itself, the qualitative method semi-structured interviews might find some information about project design drawback, management and policy problems, treatment facili- ties, environmental pollution, or the protection of water sources. The responses of the semi-structured interviews were compre- hensively evaluated to formulate a descriptive statement about the issue. It was expected to identify some meaningful rela- tionship of interests or evidence related to the problem from the critical stakeholders’ perspective views of projects, policies, and management. Results Pu’er Water Source and Tre atment The rural drinking water sources were mainly composed of streams (78.2%), spring (17.2%), and reservoir (2.7%). The other water sources, river (.9%), ditch and pond (.4%), and well (.6%), only accounted for a very small proportion. The water treatment methods most commonly used in Pu’er Municipality were chemical and physical methods. Within chemical method, only 1.8% used chemical method and most of them (98.2%) did not. In regards to physical treatment, the sediment and filtration were the main types of water purification used, covering 55%. The untreated water is still comprised of 43.2%, and the com- plete treated water was only 1.8%. The low application of chemical treatment was due to lack of treatment facilities be- cause most of them have no such facilities, covering 92.9%, and 5.7% had facilities but did not use them. Pu’er Water Quality The drinking water quality was strictly examined by assess- ing four classes of attributes: physical, chemical, toxic and microbial indexes. There was a national standard of water qual- ity set for each of these four classes of attributes. According to GB 5749-2006 National Standard for Drinking Water Quality, developed by the Ministry of Health, a water sample met the standard only if all indexes conformed to the standard of re- quirement, limitation, or maximums. Following the standard, the water samples of Pu’er which met the standard only covered 17.5%, and the others which did not meet the standard were 82.5%. The results presented the percentage of water samples which met the standard was very low. The following were at- tributes of each category: Physical, chemical, and toxic indexes: It was notable that the 3 toxic indexes, fluoride, arsenic and nitrate, all met the stan- dard. All chemical indexes, chloride, sulphate, total dissolved solid, and hardness also met the standard. On the other hand, the proportion that met the standard of physical index of color, turbidity, unpleasant taste and smell, visible substance were 99.3%, 89.5%, 98.8%, and 84.2%, respectively. There were still a considerable amount of water of these indexes which did not meet the standard, covering .7%, 10.5%, 1.2%, and 15.8%, respectively. Microbial indexes: The most serious problem of Pu’er rural water was that most of the microbial index extremely exceeded limitations set for rural drinking water standard. The proportion of colony, coliform and thermo-tolerant coliform number which did not meet the standard accounted for 15.7%, 78.7%, and 78.7%, respectively. It must be pointed out that given the con- dition, environmental, and hygiene of the rural area, the total colony number actually extended to 500 CFU/100ml by the standard. Table 1 shows the results of water status of the Pu’er Municipality. Cause and Effect Relationships with Microorganism Levels The association of total colony and total coliform number among chemical and physical treatment, treated water and tap water, dry season and rainy season was shown in Table 2. Chemical treatment had no association with total colony num- ber, as shown by a P-value of .195, but was associated with the total coliform number. Physical treatment had an important effect on total colony and coliform number. Physical treatment of P-value (.00) showed that there was a highly significant association. The physical water treatment methods were very effective against microorganisms. It can greatly reduce the levels of microorganisms. P-value of treated water and tap wa- ter is .431 and .340, respectively, which implied no significance. The reasons may be due to the fact that most of the water lacked treatment or was not fully treated, or there were no treatment facilities. Secondly, the secondary water supply sys- tem from the treatment facilities to households could still ex- perience some problems from lack of tanker covers and peri- odic cleaning of the water tanks and pipelines. The dry and the rainy season had a great effect on the quality of the water. Both P-value of total colony and total coliform number between the dry season and rainy season was .000. The percentage of water samples which met the standard for total colony number was 51.8% in dry season and 23.2% in rainy season. The percentage of water samples which met the stan- dard for total coliform number was 17.5% in dry season and 3.9% in the rainy season. Both water samples which met the standard in dry season were obviously higher than that in rainy season. Figure 1 shows that the trend of mean total colony and coli- form number in dry season is obviously lower than that in the rainy season from 2008-2011. This trend explained that the water quality in dry season is usually better than rainy season. There was an abnormality of an increasing tendency of both total colony and coliform number in 2009-2010. One possible explanation was that the year was extremely dry in the mete- orological record history, when most of the southern places in the west of China experienced extreme drought. The Effect of Water Sources on Microbial Indexes The different types of water sources also influenced the mi- crobial indexes. One Way ANOVA analysis showed that the mean of total colony number among water sources existed the difference (F = 15.076, P = .00) (F-value did not show on table). There were essential differences between the two main sources of water. From the statistic of LSD, it was found that P-value of total number of colony between spring and stream were sig- nificantly different with a P-value of .003. The mean of total colony amounts in spring water was 201.1, but in stream was 763.1. The quality of spring water was obviously better than that of stream, whereas, the others type of water showed no difference. Table 3 explains the results of the P-value among the different sources of water. Open Access 187 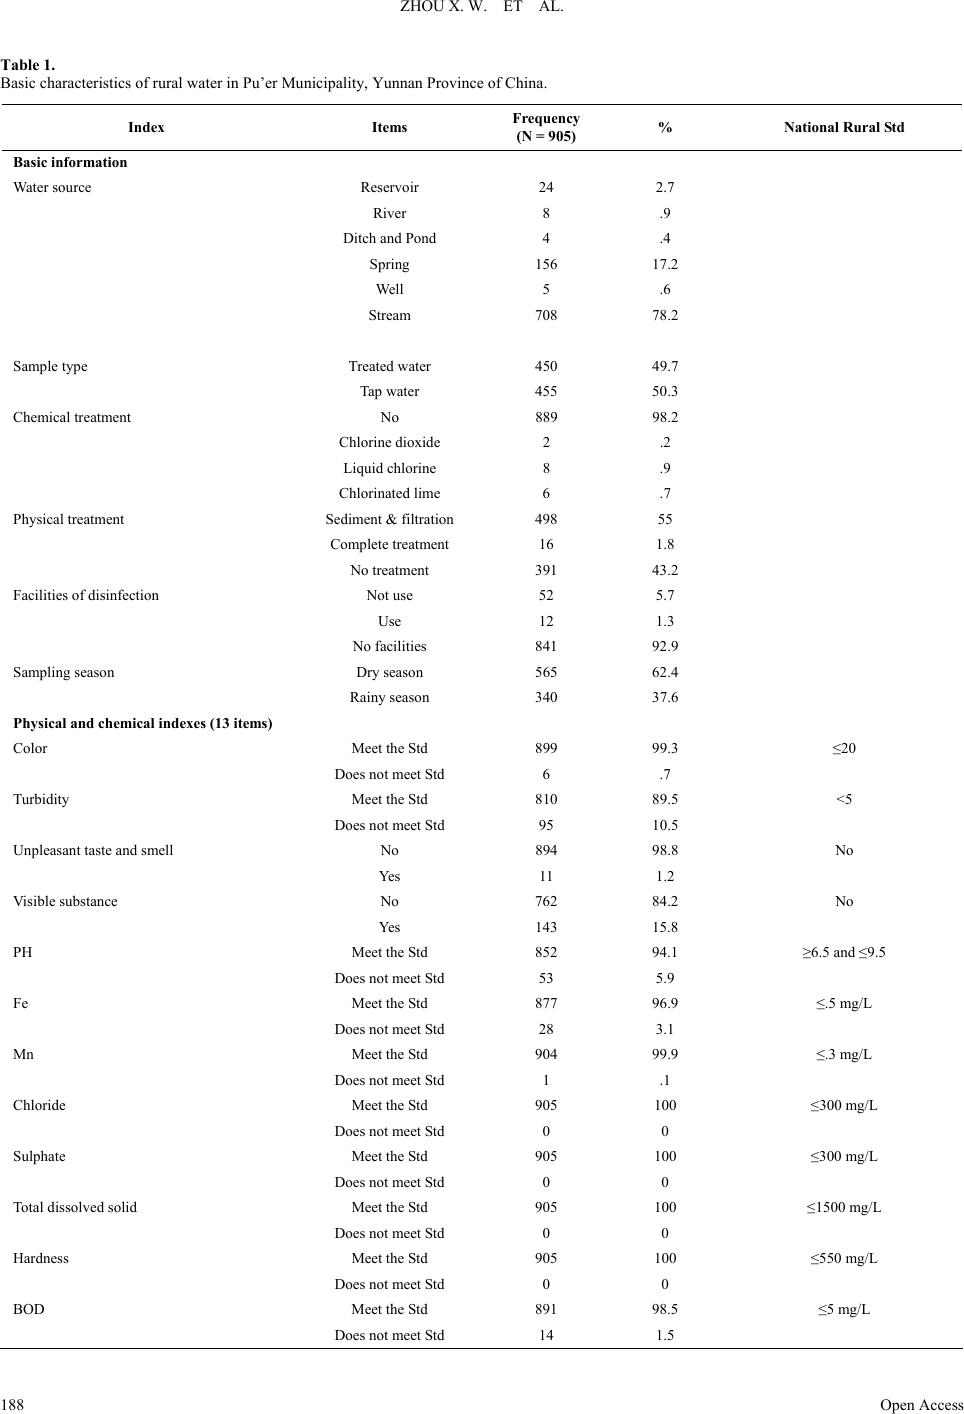 ZHOU X. W. ET AL. Open Access 188 Table 1. Basic characteristics of rural water in Pu’er Municipality, Yunnan Province of China. Index Items Frequency (N = 905) % National Rural St d Basic information Water source Reservoir 24 2.7 River 8 .9 Ditch and Pond 4 .4 Spring 156 17.2 Well 5 .6 Stream 708 78.2 Sample type Treated water 450 49.7 Tap water 455 50.3 Chemical treatment No 889 98.2 Chlorine dioxide 2 .2 Liquid chlorine 8 .9 Chlorinated lime 6 .7 Physical treatment Sediment & filtration 498 55 Complete treatment 16 1.8 No treatment 391 43.2 Facilities of disinfection Not use 52 5.7 Use 12 1.3 No facilities 841 92.9 Sampling season Dry season 565 62.4 Rainy season 340 37.6 Physical and chemical indexes (13 items) Color Meet the Std 899 99.3 ≤20 Does not meet Std 6 .7 Turbidity Meet the Std 810 89.5 <5 Does not meet Std 95 10.5 Unpleasant taste and smell No 894 98.8 No Yes 11 1.2 Visible substance No 762 84.2 No Yes 143 15.8 PH Meet the Std 852 94.1 ≥6.5 and ≤9.5 Does not meet Std 53 5.9 Fe Meet the Std 877 96.9 ≤.5 mg/L Does not meet Std 28 3.1 Mn Meet the Std 904 99.9 ≤.3 mg/L Does not meet Std 1 .1 Chloride Meet the Std 905 100 ≤300 mg/L Does not meet Std 0 0 Sulphate Meet the Std 905 100 ≤300 mg/L Does not meet Std 0 0 Total dissolved solid Meet the Std 905 100 ≤1500 mg/L Does not meet Std 0 0 Hardness Meet the Std 905 100 ≤550 mg/L Does not meet Std 0 0 BOD Meet the Std 891 98.5 ≤5 mg/L Does not meet Std 14 1.5  ZHOU X. W. ET AL. Continued NH Meet the Std 879 97.1 ≤.5 mg/L Does not meet Std 26 2.9 Toxic Index (3 Items) Fluoride Meet the Std 905 100 ≤1.2 mg/L Does not meet Std 0 0 As Meet the Std 905 100 ≤.05 mg/L Does not meet Std 0 0 Nitrate Meet the Std 905 100 ≤20 mg/L Does not meet Std 0 0 Microbial index (3 items) Total colony # Meet the Std 763 84.3 ≤500 CFU/100ml Does not meet Std 142 15.7 Total coliform # Meet the Std 193 21.3 No Does not meet Std 712 78.7 Total thermo-tolerant colifrom # Meet the Std 148 16.4 No Does not meet Std 674 74.5 Missing 83 9.1 All indexes Meet the St d 158 17.5 Does not meet Std 747 82.5 Table 2. Comparison of total colony and total coliform number among chemical and physical treatment, treated water and tap water, dry season and rainy season. Total colony # Total coliform # Item Classification Meet Std N(%) Does not meet Std N(%) Total P-value Meet Std N(%) Does not meet Std N(%) Total P-value Yes 14(1.5) 2(.2) 16(1.8) .195 13(1.4) 3(.4) 16(1.8) .000 No 665(73.5) 224(24.8) 889(98.2) 180(19.9)709(78.3) 889(98.2) Chemical treatment Total 679(75.0) 226(25.0) 905(100.0) 193(21.3)712(78.7) 905(100.0) Yes 419(46.3) 95(10.5) 514(56.8) .000 156(17.2)358(39.6) 514(56.8) .000 No 260(28.7) 385(42.5) 391(43.2) 37(4.1) 354(39.1) 391(43.2) Physical treat- ment Total 679(75.0) 226(96.9) 905(100.0) 193(21.3)712(78.7) 905(100.0) Treated water 336(37.1) 114(12.6) 450(49.7) .431 99(10.9) 351(38.8) 450(59.7) .340 Tap water 343(41.8) 112(8.5) 455(50.3) 94(10.4) 361(39.9) 455(50.3) Water sample type Total 679(75.0) 226(25.0) 905(100.0) 193(21.3)712(78.7) 905(100.0) Dry season 469(51.8) 96(10.7) 565(62.4) .000 158(17.5)407(45.0) 565(62.4) .000 Rainy season 210(23.2) 130(14.4) 340(37.6) 35(3.9) 305(33.7) 340(37.6) Test date Total 679(75.0) 226(25.0) 905(100.0) 193(21.3)712(78.7) 905(100.0) Table 3. The P-value of sources of water and total colony number. P-value N Mean Std Deviation Reservoir River Ditch & pond Spring Well Stream Reservoir 24 232.20 401.85 .790 .863 .947 .927 .230 River 8 466.60 1065.80 .740 .731 .785 .695 Ditch & pond 4 34.25 20.60 .877 .943 .495 Spring 156 201.10 376.36 .946 .003* Well 5 136.00 144.97 .512 Stream 708 763.10 2390.73 Total 905 642.80 2135.45 *P-value of total number of colony between spring and stream was significantly different. Open Access 189  ZHOU X. W. ET AL. Open Access 190 .00 200.00 400.00 600.00 800.00 1000.00 1200.00 1400.00 1600.00 2008 20092010 2011 CFU/100mL To talcolony#in dryseason To talcolony#in rainyse ason To talcolifor m#indryseaso n To talcolifor m#inrainy se ason Years Figure 1. The mean total colony and coliform number in dry and rainy season from 2008-2011. The Spring Water and Mi crobial Index Table 4. The qualification of spring water with total colony number and coli- form number. Pu’er prefecture is a typical mountainous area, where ground and surface water can easily form runoff of spring and stream. Generally, compared with the other sources of water, spring water was considered to be of a high quality. However, from the result analysis, among the total 156 spring water samples, the samples of total colony number which met the standard were 89.1% and 10.9% did not. At the same time, the water samples of total coliform number which met the standard were 50% and 50% did not. Table 4 shows the results. Microbial Index Frequency Percent Meet Std 139 89.1 Total colony # Does not meet Std 17 10.9 Meet Std 78 50.0 Does not meet Std 78 50.0 Total coliform # Total 156 100.0 Semi-Structured Interview water source again. This could be potentially a threat to health of the human being and domestic animal. Currently, there were still many people who did not have access to drinking water. The priority of the current government was to make efforts to increase access to drinking water, rather than fix current prob- lems because of the limited funds. Key informants of water authorities: There was only one in- terview conducted with one official in Prefecture government. She used a very official tone: “Everything of rural drinking water is good. There are no problems about rural water pro- jects”. “We completed rural projects every year according to the rural drinking water project of the 11th Five-year Plan. When permission to review some data and document about the project was requested, she asked me to look for the data from the Statistic Bureau of Pu’er Municipality. She refused my request to review the project’s plan, management, and policies in detail. Much information from the prefecture government could not be collected. Community Informants: There were 3 villages observed and 6 villagers were interviewed. The 2 community villagers who were using the spring water, held the point of views that their water was of very good quality. They thought the spring water was better than any other kind of water. There was no pollution to the water because pipes were directly connected to the mouth of the spring. But they recognized that the water was slightly affected in the rainy season since the water became a little bit turbid at that time. They hoped that the government now invests funds to help the village to construct their roads. When asked about their drinking habits, they said: “Most of the people drink boiled water, but some young men still drink the unboiled wa- ter.” Interviews were conducted with officials of Simao District Government (a county level), which were a group of people working in the same office. They knew that colony and coli- form levels of rural water exceeded the national rural drinking water standard. They acknowledged that extensive deforesta- tion contributed to reduction of water sources. In recent years, many places concentrated on developing commercial plants, such as planting tea, coffee, and rubber trees. Therefore, many of the forests with very good function of conserving the water were replaced by planting the pine trees and other commercial plants. In some areas, people were facing water shortages. Therefore, protection of the forest was very crucial to regenera- tion of the water. Second, there were many villages clustered around the water source. The domestic sewerage was dis- charged into the water source. It seriously affected the water quality of the low level of stream. Third, there were many ag- riculture fields near some of the water projects. The use of fer- tilizer and insecticides often polluted water sources. However, the polluted water was untreated and then converged into the The other 2 villagers who were using the stream water wor- ried about their drinking water very much because their drink- ing water was drawn from stream of the mountains by the pipes. I could see some of the water tank covered with the asbestos tiles. When looked into tap water under the sunlight, there was still some visual substance suspended in the water. They did not use disinfectant or treatment facilities. While one village near the Pu’er Municipaliy was much more developed, although they used stream water, they bought an advanced purification unit to treat the water for their community. They happily told me: “Our water is good like bottle water. You can drink right from it.” CDPC professionals and technicians: There was one interview  ZHOU X. W. ET AL. with a professional in Ning’er County CDPC and some infor- mal interviews in Pu’er Prefecture CDPC including several ones from the Lab. Both the county CDPC and prefecture CDPC professionals were very concerned about the water qual- ity. The county CDPC knew the circumstances about their wa- ter quality because they tested every water sample in their cen- ter. They said they used to test high concentration microbes in the samples. From the interview, the professional in Ning’er County CDPC said: “Most of the drinking water projects did not set protection zones to protect water source in the Counties”. However, according to The Law on Prevention and Control of Water Pollution (Quan’guo Renming Daibiao Dahui Changwu Weiyuanhui 全国人民代表大会常务委会, 2008), the gov- ernment above the county level had the right to define the area for protecting water source to conserve the water quality. Sec- ond, “most of the water tanks had no cover, no purification and disinfection procedures and facilities”, which could be a poten- tial risk of microbial pollution. Third, “there are no special persons responsible for the maintenance and running the water facilities in the villages”. Discussion The rural drinking water status of Pu’er Municipality is in a very severe situation. From the analysis of these water samples, the percentage water samples which meet the standard is very low, only 17.5% and water samples which do not meet the standard predominates 82.5%. The 3 microbial indexes, the total colony, coliform and thermo-tolerant coliform number, are significantly above the national rural water standard, which seriously affect the overall quality of the rural drinking water. The high rate of the microbial index reveals the poor sanitation of the rural community. The water may be contaminated by human waste, which causes water-borne diseases such as diar- rhea, typhoid, and hepatitis (Root et al., 1982). Rural commu- nity water pollution may easily cause diarrhea and intestinal diseases from drinking and cooking with such kinds of water. These are the main threats to the health of the Pu’er rural resi- dents. The water treated by chemical and physical method is obvi- ously better than the untreated water by comparing the micro- bial level. The results of the analysis of the water in the regions have demonstrated it is very necessary for regular treatment of water to serve the population no matter what source of water since all of them exist heath risks. On the other hand, these methods are still quite effective when used, especially the physical treatment. Once these facilities were established, there will be long term benefits to the vulnerable population. The dry season and rainy season have a great effect on the microbial indexes. The water samples which meet the standard in dry season are better than in rainy season. These might be attributed to the fact that these water projects have no cover or protected barriers. In addition, in the rainy season, the water source especially the stream may increase density of the mi- crobe and concentration of pollutants, such as human and ani- mal feces and toxic metal and other indexes due to the ground surface runoff. The quality of spring water is better than any other main type of water. Spring water is generally regarded as a source of safe drinking water that many villagers think they can directly drink. Nevertheless, the spring water still has great hazards to the health because the total colony number in many of the spring water samples and the total coliform number in half of the spring water samples exceed the rural drinking water standard. The villagers misunderstand the real situation and still take it as a safe one. They should receive correct information so that they can change their behaviors in regards to drinking unboiled wa- ter. Recommended Intervention Strategies Designing some appropriate intervention strategies to mini- mize the microbial amounts is important to address problems at the policy level, which can improve the water status and help capacity building for future drinking water projects. These fol- lowing strategies are strongly recommended to improving water quality in Pu’er Municipality The health education is a long and lasting program to change the rural community drinking and cooking behavior. It is im- portant to continue the emphasis on health and hygiene educa- tion, rather than physical sanitation investments only. Existing survey results suggest that traditional approaches and measures in dissemination of health and hygiene education may not be sufficient (Meng, Tao, & Liu, 2004). The health departments and government must consistently conduct health education to the rural residents so that they are aware of the potential risks of drinking unboiled water. The proper information must be dis- seminated to the target population through the media, such as TV, newspaper, internet, poster, VCD, and community loud- speaker to improve rural residents’ compliance to drink boiled water and try to avoid washing vegetables with unboiled water and other unsanitary cooking methods. Community participation in water protection is critical to water quality improvement and project sustainability. Drinking water is an important livelihood that local residents rely on. They pay close attention to their project. Experience from pre- vious studies indicates that communities usually have very high motivation in participation and involvement in planning, con- structing, facilities maintenance, and management (Chris, 2000). Additionally, they have a strong responsibility to participate in protecting the water source forest and maintain the environment hygiene. Once the residents form the positive feeling of em- powerment, the projects can easily succeed and move into sus- tainable development and the government can greatly reduce the successive investment of maintenance and management. The drinking water project must emphasize the protection of the water source and restoring the ecological system around water sources. Based on the geographic location, source of water and national law, local governments need to define the protection zones of water sources and formulate protecting measures and regulations. The project needs to consider build- ing walls, barriers, and covers to protect the water from the pollution. Secondly, the water authority’s permits are required for discharge to water source from both sanitary and industrial wastes. In the water source zone, the pollution control includes these contents: prohibit the discharge of pollutants, restrict the use of noxious fertilizer and insecticide, ban deforestation, and exclude the placement of hazardous substances near village and houses (Quanguo Aiguo Weisheng Yundong Weiyuanhui 全国 爱国卫生运动委员会, 2008). The government can help the community establish regulations to protect environmental hy- giene and forest near water sources. In the areas of ecological system damage, a reforestation campaign needs to be conducted to restore the original ecological system. Open Access 191  ZHOU X. W. ET AL. Open Access 192 Water authorities and other relevant water project depart- ments must closely cooperate fully to communicate in design- ing, implementing, monitoring and evaluating the project. In rural areas, there is a lack of design engineers and reference materials for rural water plant design. This has led to techni- cally irrational design of some water plants (Meng, Tao, & Liu, 2004). The choice of appropriate disinfection and purification measures and treatment facilities based on the water quality analysis and water source must be included into the standard for water projects. It is greatly encouraged to expand construction of rural drinking water infrastructure, while maintaining or even improving quality is important as well (Liu et al., 2009). Since many water samples do not meet the rural drinking water standard, some surveys can be conducted to explore the possi- ble reasons from water project design and the corresponding measures must be put forward to improve the water project. In the rural area, the financial restraint impedes the water project development. The government is always the subject of investment to provide the basic service of safe drinking water. These still included the physical and chemical treatment facili- ties as well as the earmarked fund and personnel responsible for the maintenance and provide chemical disinfectants. Non-gov- ernment funds source, such as private, enterprise and other association and organization can participate in the water con- struction project as well and the participation can be diversified. No matter who invests, they are accountable for state laws and regulations. The most significant factor is to have clear property ownership and supervision so that the owner can be designated the relevant accountabilities and completely fulfill responsibili- ties. Meanwhile, the supervisors can effectively undertake the management. Finally, to small centralized water supply projects or remote villages, ownership can through beneficiaries of vil- lages. Thereafter, the health departments must take the physical examination for the water maintenance personnel and relevant departments train them how to dose appropriate disinfectant, operate, and maintain the facilities. The strength of the studies is that it identifies some risk fac- tors which are associated with microbial index. Furthermore, the study uses the national water project monitoring data which was collected and tested by the authenticated Labs and is con- sidered of a high accuracy of data quality. Therefore, the result can be high validity and worth taking into account of the policy intervention strategy. The limitation of the study is that the semi-structured inter- viewers’ responses in such a small scale, although reflecting some aspects of the existing problem, can not represent the general problems. In addition, the responses might be subjected to each individual’s consideration of importance and lead to refusal or difficulty to distinguish whether response is real or created because some of them could have response bias con- nected with their benefits. Lastly, the study design itself could have some potential risk of the ecological study fallacy because the inconsistencies of whole samples vs. individual-level with- out balanced attention to the causes of them (Wikipedia Con- tributors, 2012). The study implicates that it is meaningful to conduct a fur- ther study to explore the direct linkage in the analysis between individual’s exposure to pathogenic microorganisms and their own health outcome. Acknowledgements The project was sponsored by the Ford foundation Grant ID-15090351. I wish to express my gratitude to my advisor Prof. Jane T. Bertrand who helped me in structuring my thesis and gave me a lot of comments and suggestions. I would like to thank my practicum preceptor Assoc. Prof. Li Bingcheng, Pu’er Municipal CDPC, who helped me to conduct the semi-struc- tured interviews to collect qualitative data. Special thanks also due to Mr. Guo Linfeng, Pu’er CDPC, who helped me in un- derstanding the water sample data. I am also grateful to Mr. Gabriel Cohen’, MPH candidate, Tulane University, for his help in figuring out unclear ideas, terminologies and revising the written English for this thesis. REFERENCES Center for Health Statistics and Information (2009). Research on health services of primary health care facilities in China. Ministry of Health of the People’s Republic of China, Peking Union Medical College Press, Beijing Chris, H. (2000). Project management for construction: The owners’ perspective. http://pmbook.ce.cmu.edu/01_The_Owners'_Perspective.html Liu, C. F., et al. (2009). Infrastructure investment in rural China: Is quality being compromised during quantity expansion? The China Journal, 61, 105-129. Meng, S. C., Tao, Y., & Liu, J. Y. (2004). Rural water supply and sanitation in China—Scaling up services for the poor. The Interna- tional Bank for Reconstruction and Development/The World Bank. Root, J. J., Graveland, A., & Schultink, L. J. (1982). Consideration of organic matter in drinking water treatment. Water Research, 16, 113- 122. http://dx.doi.org/10.1016/0043-1354(82)90060-4 Quanguo Aiguo Weisheng Yundong Weiyuanhui Ban’gongshi 全国爱 国卫生运动委员会办公室 (2008). Quaguo Nongcun Yinyongshui Shuizhi Weisheng Jiance Jishu Fang’an 全国农村饮用水水质卫生 监测技术方案. http://xnc.zjnm.cn/zdxx/xwlb/view.jsp?zdid=24779&lmid=12&id=9 6434 Quanguo Renming Daibiao Dahui Changwu Weiyuanhui 全国人民代 表大会常务委员会 (2008). Zhonghua Renming Gongheguo Shui- wuran Fangzhifa 中华人民共和国水污染防治法. http://wenku.baidu.com/view/50aefc0b79563c1ec5da7113.html Pu’ershi Tongjijv 普洱市统计局 (2010). 2010 nian Pu’ershi Guoming Jingji he Shehui Fazhang Tongji Gongbao 2010年普洱市国民经济 和社会发展统计公报. http://wenku.baidu.com/view/2c2b125bbe23482fb4da4cf0.html Pu’ershi Renkou Pucha Ban’gongshi 普洱市人口普查办公室 (2011). 2010 nian Yunnansheng Pu’ershi Diliuci Quanguo Renkou Pucha Zhuyao Shujv Gongbao 云南省普洱市 2010 年第六次全国人口普 查主要数据公报. http://ishare.iask.sina.com.cn/f/15812157.html Pu’ershi Zhenzhi Xieshang Huiyi 普洱市政治协商会议 (2011). Pu’ershi Shuili Jichu Sheshi Jianshe Qingkuang Diaoyan Baogao 普 洱市水利基础设施建设情况调研报告. http://www.pezx.gov.cn/show.asp?NewsID=1611 The Subspecialty Groups of Gastroenterology and Infectious Diseases (2009). The Society of Pediatrics, Chinese Medical Association, Editorial Board of Chinese Journal of Pediatrics. Wikipedia Contributors (2012). Cross-sectional study. http://en.wikipedia.org/wiki/Cross-sectional_study World Health Organization (2007). The world health report—A safer future: Global public health security in the 21st century. World Health Organization, Geneva. World Water (2010). China. http://www.theworldwater.org/world_water.php?id=china |