

Paper Menu >>
Journal Menu >>
 J. Biomedical Science and Engineering, 2013, 6, 1062-1071 JBiSE http://dx.doi.org/10.4236/jbise.2013.611133 Published Online November 2013 (http://www.scirp.org/journal/jbise/) A resonance-mode piezoelectric device for measurement of respiratory mechanics Hamed Hanafi Alamdari, Lucas Posada, Swati A. Bhatawadekar, Jeremy A. Brown, Geoffrey N. Maksym School of Biomedical Engineering, Dalhousie University, Halifax, Canada Email: [email protected], [email protected] Received 10 September 2013; revised 15 October 2013; accepted 26 October 2013 Copyright © 2013 Hamed Hanafi Alamdari et al. This is an open access article distributed under the Creative Commons Attribution License, which permits unrestricted use, distribution, and reproduction in any medium, provided the original work is properly cited. ABSTRACT This paper presents the design o f a nove l oscillometry device for the measurement of respiratory mechanics based on piezoelectric bimorph actuator technology. To predict performance for measurement of human respiratory mechanics, a dynamic model was devel- oped based on a bimorph piezoelectric actuator driv- ing a linear resistance mesh screen including subject’s respiratory impedance loads, and realistic breathing noise. Model performance was also validated in a pro- totype device. We found that while breathing noise substantially lowered SNR, the model could produce sufficient pressure and flow for acceptable SNRs ex- ceeding 35 dB, and accuracies exceeding 99%. Sat- isfactory accuracy could be achieved with load impe- dance errors less than 3%. Maintaining the air-gap around the oscillating mesh with a resistance against the leak greater than 0.38 cmH2O/L/s maintained good performance, with an acceptable 4 dB decrease to SNR. Moreover, this work provides multiple solutions to host higher amounts of noise and nonlinearities. These results indicate that the development of an ac- curate lightweight portable single frequency FOT de- vice is feasible. Keywords: Forced Oscillation Technique FOT; Respiratory Mechanics; Tidal Volume 1. INTRODUCTION Oscillometry also known as the Forced Oscillation Tech- nique (FOT) superimposes fluctuations in airway pres- sure on normal breathing to measure the mechanical im- pedance to airflow of the respiratory system for diagnos- ing and monitoring lung diseases [1]. Using FOT is pos- sible in very young children to elderly patients as it is easy to perform unlike the current standard approach, which involves a learned maximal forced expiration that is difficult for many patients. Respiratory impedance is a complex quantity with a real part: respiratory resistance (Rrs) largely due to airflow resistance and an imaginary part: reactance (Xrs) arising from elastic properties of the lung and chest wall and the inertia of the air. The resis- tance is elevated in diseases such as asthma and COPD associated with airway narrowing and the reactance can also be altered due to loss of airspaces as airways close and limit flow [2]. FOT Devices must reliably produce oscillatory wave- forms even when perturbed by breathing, and must ac- curately measure pressure and flow due to the oscilla- tions, over a wide range of patient respiratory imped- ances, and compensate for any self-impedance of the de- vice and disposable filter. Current FOT devices use ei- ther a loudspeaker or oscillating electromagnetic actuator which results in a device that is larger or heavier than ty- pical spirometers. Piezoelectric actuators have been used for several years in applications such as loudspeakers, mechanical damp- ers, ultrasonic motors, precision position controlling, noise control, relays, phonograph pick-up, acoustics, and pres- sure sensing [3-6]. We have designed a smaller and less costly FOT device, based on a piezoelectric bimorph ac- tuator using a computer model to help explore the feasi- bility and design requirements for a suitable device. The design was tested in a prototype device. 2. METHODS 2.1. Simulations The device is based on a moving mesh in a flow tube and was modeled in MATLAB/SIMULINK as described in following paragraphs. The resonance of the oscillating cantilever was tuned to 6 Hz by varying the mass on the tip [7]. Forced air oscillation at 6 Hz was sent into a res- OPEN ACCESS 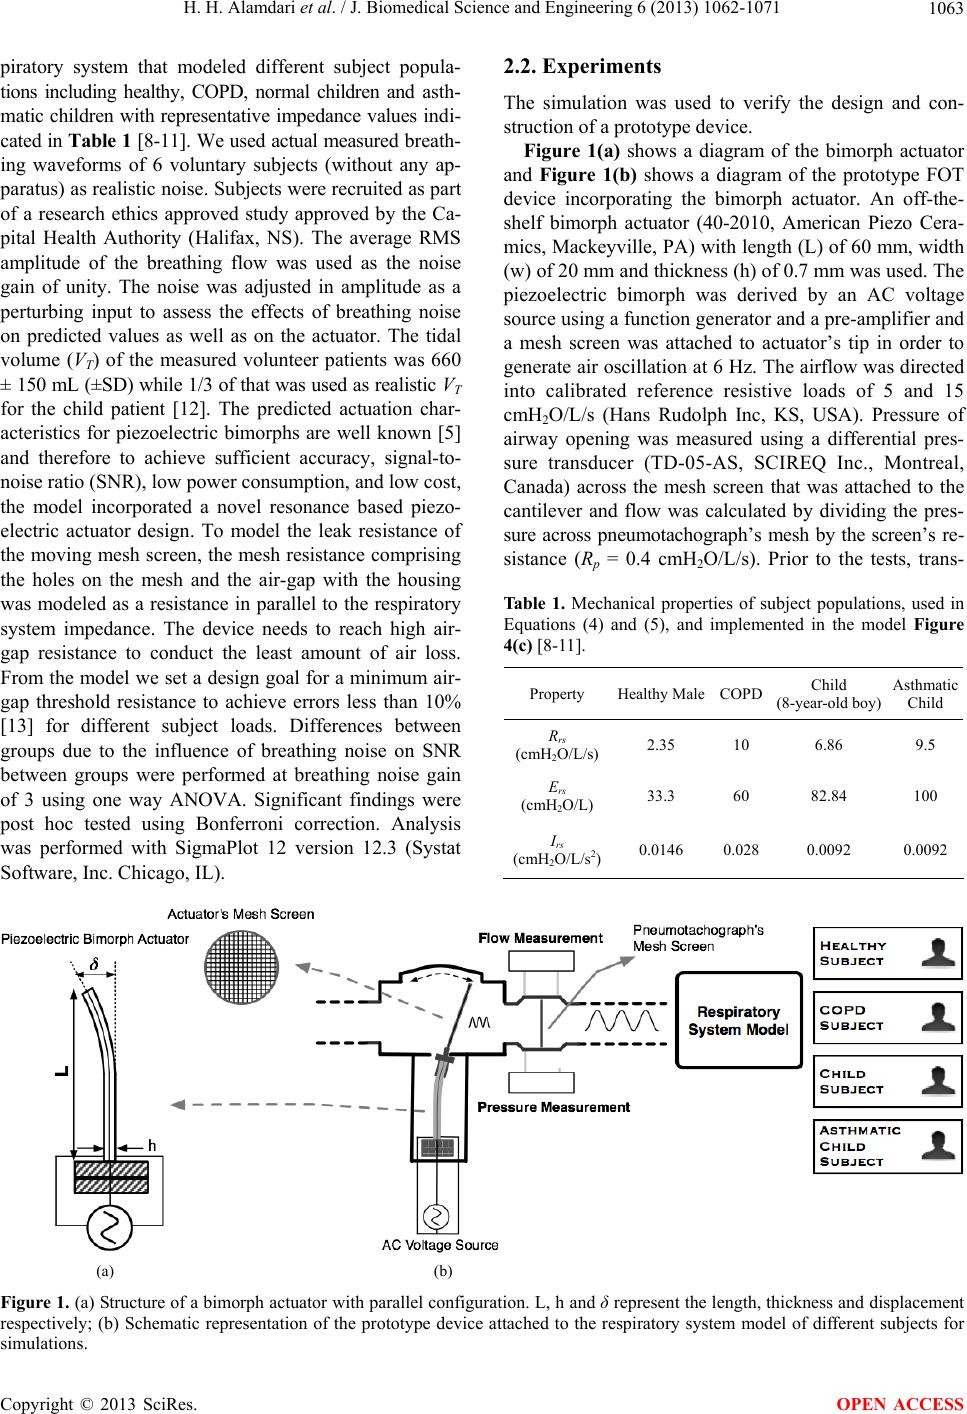 H. H. Alamdari et al. / J. Biomedical Science and Engineering 6 (2013) 1062-1071 1063 piratory system that modeled different subject popula- tions including healthy, COPD, normal children and asth- matic children with representative impedance values indi- cated in Table 1 [8-11]. We used actual measured breath- ing waveforms of 6 voluntary subjects (without any ap- paratus) as realistic noise. Subjects were recruited as part of a research ethics approved study approved by the Ca- pital Health Authority (Halifax, NS). The average RMS amplitude of the breathing flow was used as the noise gain of unity. The noise was adjusted in amplitude as a perturbing input to assess the effects of breathing noise on predicted values as well as on the actuator. The tidal volume (VT) of the measured volunteer patients was 660 ± 150 mL (±SD) while 1/3 of that was used as realistic VT for the child patient [12]. The predicted actuation char- acteristics for piezoelectric bimorphs are well known [5] and therefore to achieve sufficient accuracy, signal-to- noise ratio (SNR), low power consumption, and low cost, the model incorporated a novel resonance based piezo- electric actuator design. To model the leak resistance of the moving mesh screen, the mesh resistance comprising the holes on the mesh and the air-gap with the housing was modeled as a resistance in parallel to the respiratory system impedance. The device needs to reach high air- gap resistance to conduct the least amount of air loss. From the model we set a design goal for a minimum air- gap threshold resistance to achieve errors less than 10% [13] for different subject loads. Differences between groups due to the influence of breathing noise on SNR between groups were performed at breathing noise gain of 3 using one way ANOVA. Significant findings were post hoc tested using Bonferroni correction. Analysis was performed with SigmaPlot 12 version 12.3 (Systat Software, Inc. Chicago, IL). 2.2. Experiments The simulation was used to verify the design and con- struction of a prototype device. Figure 1(a) shows a diagram of the bimorph actuator and Figure 1(b) shows a diagram of the prototype FOT device incorporating the bimorph actuator. An off-the- shelf bimorph actuator (40-2010, American Piezo Cera- mics, Mackeyville, PA) with length (L) of 60 mm, width (w) of 20 mm and thickness (h) of 0.7 mm was used. The piezoelectric bimorph was derived by an AC voltage source using a function generator and a pre-amplifier and a mesh screen was attached to actuator’s tip in order to generate air oscillation at 6 Hz. The airflow was directed into calibrated reference resistive loads of 5 and 15 cmH2O/L/s (Hans Rudolph Inc, KS, USA). Pressure of airway opening was measured using a differential pres- sure transducer (TD-05-AS, SCIREQ Inc., Montreal, Canada) across the mesh screen that was attached to the cantilever and flow was calculated by dividing the pres- sure across pneumotachograph’s mesh by the screen’s re- sistance (Rp = 0.4 cmH2O/L/s). Prior to the tests, trans- Ta b le 1. Mechanical properties of subject populations, used in Equations (4) and (5), and implemented in the model Figure 4(c) [8-11]. Property Healthy MaleCOPD Child (8-year-old boy) Asthmatic Child Rrs (cmH2O/L/s) 2.35 10 6.86 9.5 Ers (cmH2O/L) 33.3 60 82.84 100 Irs (cmH2O/L/s2)0.0146 0.028 0.0092 0.0092 (a) (b) Figure 1. (a) Structure of a bimorph actuator with parallel configuration. L, h and δ represent the length, thickness and displacement respectively; (b) Schematic representation of the prototype device attached to the respiratory system model of different subjects for simulations. Copyright © 2013 SciRes. OPEN ACCESS 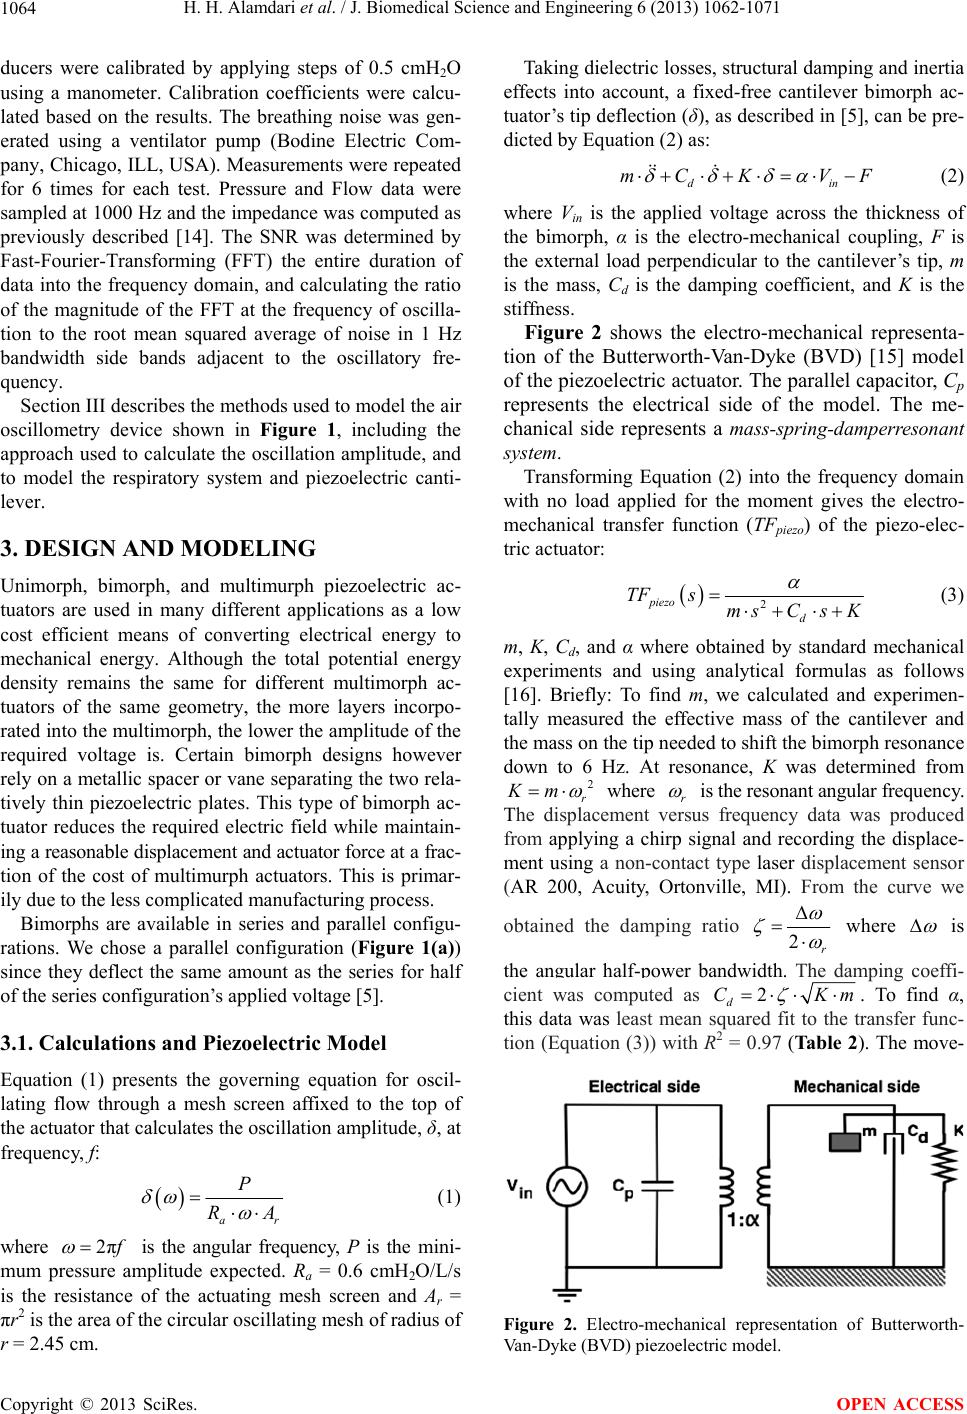 H. H. Alamdari et al. / J. Biomedical Science and Engineering 6 (2013) 1062-1071 1064 ducers were calibrated by applying steps of 0.5 cmH2O using a manometer. Calibration coefficients were calcu- lated based on the results. The breathing noise was gen- erated using a ventilator pump (Bodine Electric Com- pany, Chicago, ILL, USA). Measurements were repeated for 6 times for each test. Pressure and Flow data were sampled at 1000 Hz and the impedance was computed as previously described [14]. The SNR was determined by Fast-Fourier-Transforming (FFT) the entire duration of data into the frequency domain, and calculating the ratio of the magnitude of the FFT at the frequency of oscilla- tion to the root mean squared average of noise in 1 Hz bandwidth side bands adjacent to the oscillatory fre- quency. Section III describes the methods used to model the air oscillometry device shown in Figure 1, including the approach used to calculate the oscillation amplitude, and to model the respiratory system and piezoelectric canti- lever. 3. DESIGN AND MODELING Unimorph, bimorph, and multimurph piezoelectric ac- tuators are used in many different applications as a low cost efficient means of converting electrical energy to mechanical energy. Although the total potential energy density remains the same for different multimorph ac- tuators of the same geometry, the more layers incorpo- rated into the multimorph, the lower the amplitude of the required voltage is. Certain bimorph designs however rely on a metallic spacer or vane separating the two rela- tively thin piezoelectric plates. This type of bimorph ac- tuator reduces the required electric field while maintain- ing a reasonable displacement and actuator force at a frac- tion of the cost of multimurph actuators. This is primar- ily due to the less complicated manufacturing process. Bimorphs are available in series and parallel configu- rations. We chose a parallel configuration (Figure 1(a)) since they deflect the same amount as the series for half of the series configuration’s applied voltage [5]. 3.1. Calculations and Piezoelectric Model Equation (1) presents the governing equation for oscil- lating flow through a mesh screen affixed to the top of the actuator that calculates the oscillation amplitude, δ, at frequency, f: ar P RA (1) where 2π f is the angular frequency, P is the mini- mum pressure amplitude expected. Ra = 0.6 cmH2O/L/s is the resistance of the actuating mesh screen and Ar = πr2 is the area of the circular oscillating mesh of radius of r = 2.45 cm. Taking dielectric losses, structural damping and inertia effects into account, a fixed-free cantilever bimorph ac- tuator’s tip deflection (δ), as described in [5], can be pre- dicted by Equation (2) as: d mC KV in F (2) where Vin is the applied voltage across the thickness of the bimorph, α is the electro-mechanical coupling, F is the external load perpendicular to the cantilever’s tip, m is the mass, Cd is the damping coefficient, and K is the stiffness. Figure 2 shows the electro-mechanical representa- tion of the Butterworth-Van-Dyke (BVD) [15] model of the piezoelectric actuator. The parallel capacitor, Cp represents the electrical side of the model. The me- chanical side represents a mass-spring-damperresonant system. Transforming Equation (2) into the frequency domain with no load applied for the moment gives the electro- mechanical transfer function (TFpiezo) of the piezo-elec- tric actuator: 2 piezo d TFs msCs K (3) m, K, Cd, and α where obtained by standard mechanical experiments and using analytical formulas as follows [16]. Briefly: To find m, we calculated and experimen- tally measured the effective mass of the cantilever and the mass on the tip needed to shift the bimorph resonance down to 6 Hz. At resonance, K was determined from 2 r Km where r is the resonant angular frequency. The displacement versus frequency data was produced from applying a chirp signal and recording the displace- ment using a non-contact type laser displacement sensor (AR 200, Acuity, Ortonville, MI). From the curve we obtained the damping ratio 2r where is the angular half-power bandwidth. The damping coeffi- cient was computed as 2CKm d. To find α, this data was least mean squared fit to the transfer func- tion (Equation (3)) with R2 = 0.97 (Ta ble 2). The move- Figure 2. Electro-mechanical representation of Butterworth- Van-Dyke (BVD) piezoelectric model. Copyright © 2013 SciRes. OPEN ACCESS 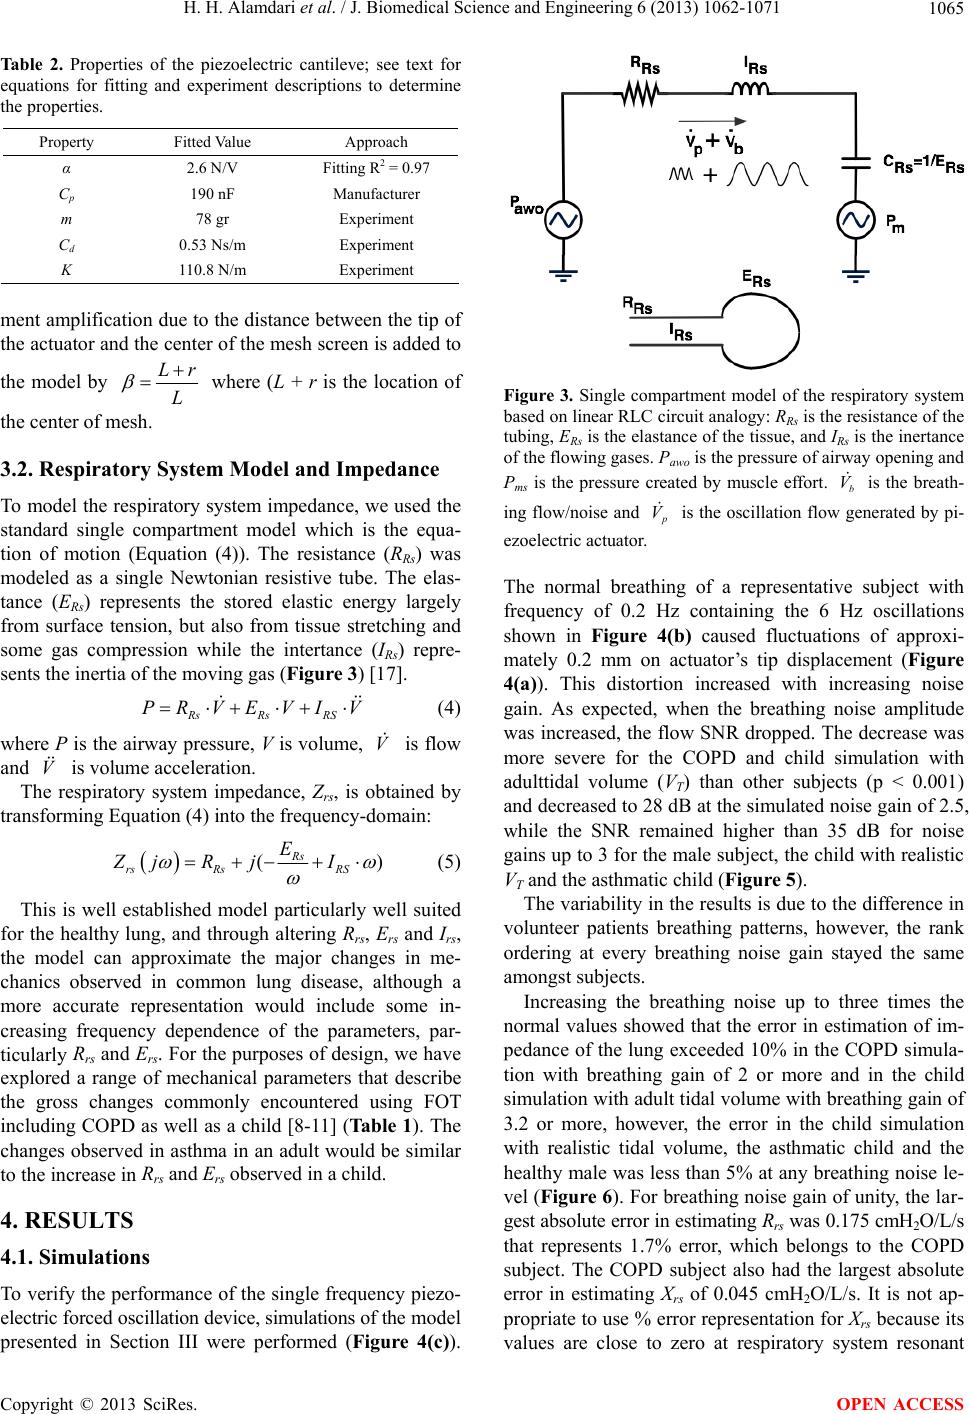 H. H. Alamdari et al. / J. Biomedical Science and Engineering 6 (2013) 1062-1071 1065 Table 2. Properties of the piezoelectric cantileve; see text for equations for fitting and experiment descriptions to determine the properties. Property Fitted Value Approach α 2.6 N/V Fitting R2 = 0.97 Cp 190 nF Manufacturer m 78 gr Experiment Cd 0.53 Ns/m Experiment K 110.8 N/m Experiment ment amplification due to the distance between the tip of the actuator and the center of the mesh screen is added to the model by Lr L where (L + r is the location of the center of mesh. 3.2. Respiratory System Model and Impedance To model the respiratory system impedance, we used the standard single compartment model which is the equa- tion of motion (Equation (4)). The resistance (RRs) was modeled as a single Newtonian resistive tube. The elas- tance (ERs) represents the stored elastic energy largely from surface tension, but also from tissue stretching and some gas compression while the intertance (IRs) repre- sents the inertia of the moving gas (Figure 3) [17]. RsRs RS PRVEVI V (4) where P is the airway pressure, V is volume, is flow and is volume acceleration. V V The respiratory system impedance, Zrs, is obtained by transforming Equation (4) into the frequency-domain: () Rs rs RsRS E ZjR jI (5) This is well established model particularly well suited for the healthy lung, and through altering Rrs, Ers and Irs, the model can approximate the major changes in me- chanics observed in common lung disease, although a more accurate representation would include some in- creasing frequency dependence of the parameters, par- ticularly Rrs and Ers. For the purposes of design, we have explored a range of mechanical parameters that describe the gross changes commonly encountered using FOT including COPD as well as a child [8-11] (Table 1). The changes observed in asthma in an adult would be similar to the increase in Rrs and Ers observed in a child. 4. RESULTS 4.1. Simulations To verify the performance of the single frequency piezo- electric forced oscillation device, simulations of the model presented in Section III were performed (Figure 4(c)). Figure 3. Single compartment model of the respiratory system based on linear RLC circuit analogy: RRs is the resistance of the tubing, ERs is the elastance of the tissue, and IRs is the inertance of the flowing gases. Pawo is the pressure of airway opening and Pms is the pressure created by muscle effort. is the breath- ing flow/noise and b V p V is the oscillation flow generated by pi- ezoelectric actuator. The normal breathing of a representative subject with frequency of 0.2 Hz containing the 6 Hz oscillations shown in Figure 4(b) caused fluctuations of approxi- mately 0.2 mm on actuator’s tip displacement (Figure 4(a)). This distortion increased with increasing noise gain. As expected, when the breathing noise amplitude was increased, the flow SNR dropped. The decrease was more severe for the COPD and child simulation with adulttidal volume (VT) than other subjects (p < 0.001) and decreased to 28 dB at the simulated noise gain of 2.5, while the SNR remained higher than 35 dB for noise gains up to 3 for the male subject, the child with realistic VT and the asthmatic child (Figure 5). The variability in the results is due to the difference in volunteer patients breathing patterns, however, the rank ordering at every breathing noise gain stayed the same amongst subjects. Increasing the breathing noise up to three times the normal values showed that the error in estimation of im- pedance of the lung exceeded 10% in the COPD simula- tion with breathing gain of 2 or more and in the child simulation with adult tidal volume with breathing gain of 3.2 or more, however, the error in the child simulation with realistic tidal volume, the asthmatic child and the healthy male was less than 5% at any breathing noise le- vel (Figure 6). For breathing noise gain of unity, the lar- gest absolute error in estimating Rrs was 0.175 cmH2O/L/s that represents 1.7% error, which belongs to the COPD subject. The COPD subject also had the largest absolute error in estimating Xrs of 0.045 cmH2O/L/s. It is not ap- propriate to use % error representation for Xrs because its values are close to zero at respiratory system resonant Copyright © 2013 SciRes. OPEN ACCESS 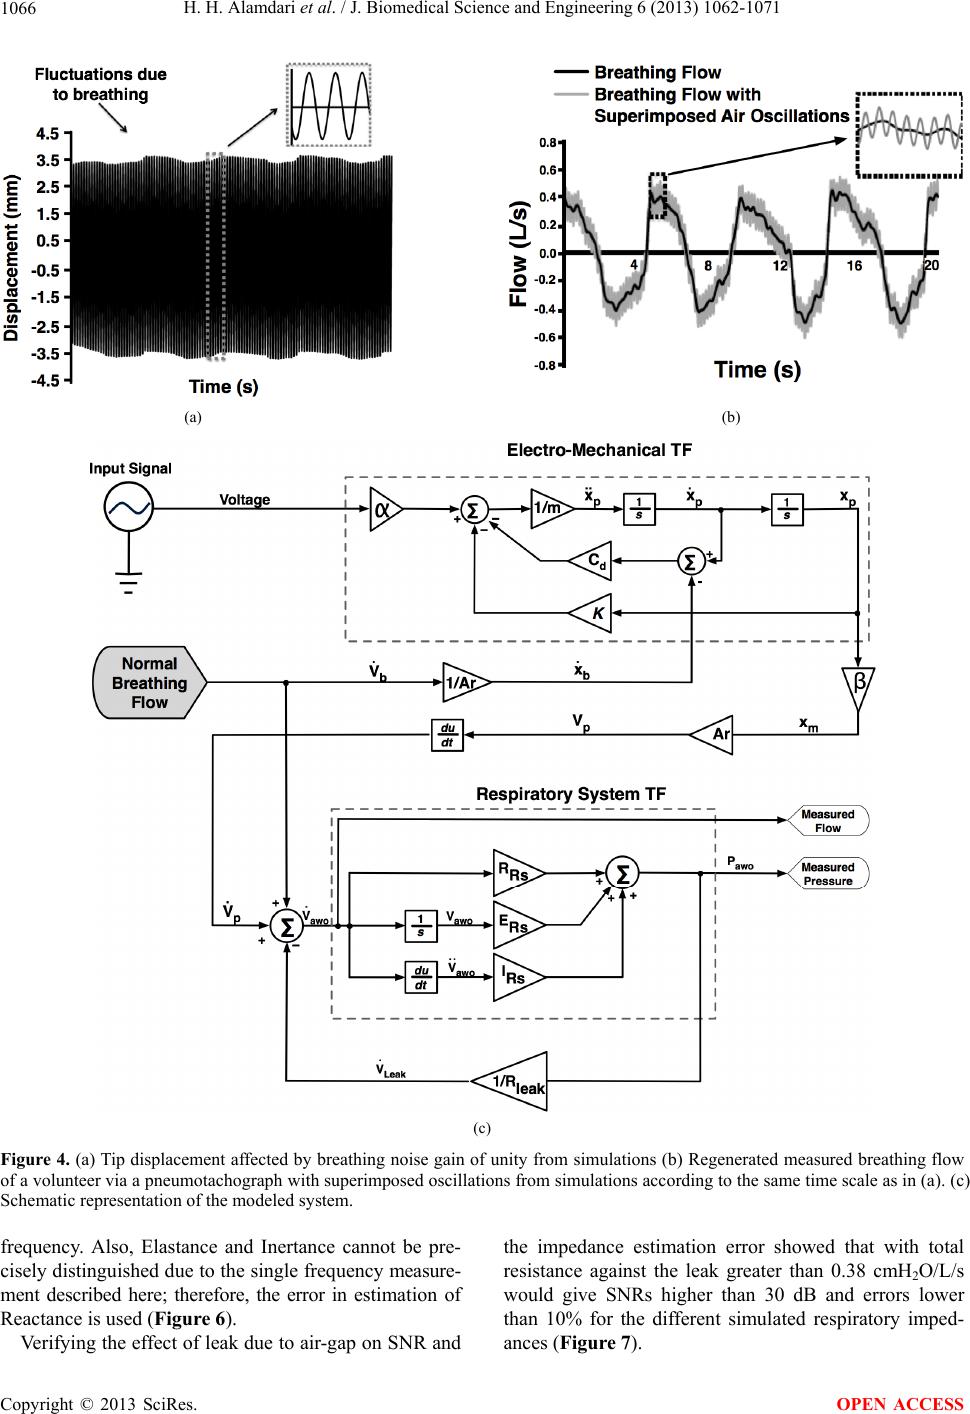 H. H. Alamdari et al. / J. Biomedical Science and Engineering 6 (2013) 1062-1071 Copyright © 2013 SciRes. 1066 (a) (b) (c) Figure 4. (a) Tip displacement affected by breathing noise gain of unity from simulations (b) Regenerated measured breathing flow of a volunteer via a pneumotachograph with superimposed oscillations from simulations according to the same time scale as in (a). (c) Schematic representation of the modeled system. frequency. Also, Elastance and Inertance cannot be pre- cisely distinguished due to the single frequency measure- ment described here; therefore, the error in estimation of Reactance is used (Figure 6). Verifying the effect of leak due to air-gap on SNR and the impedance estimation error showed that with total resistance against the leak greater than 0.38 cmH2O/L/s would give SNRs higher than 30 dB and errors lower than 10% for the different simulated respiratory imped- ances (Figure 7). OPEN ACCESS 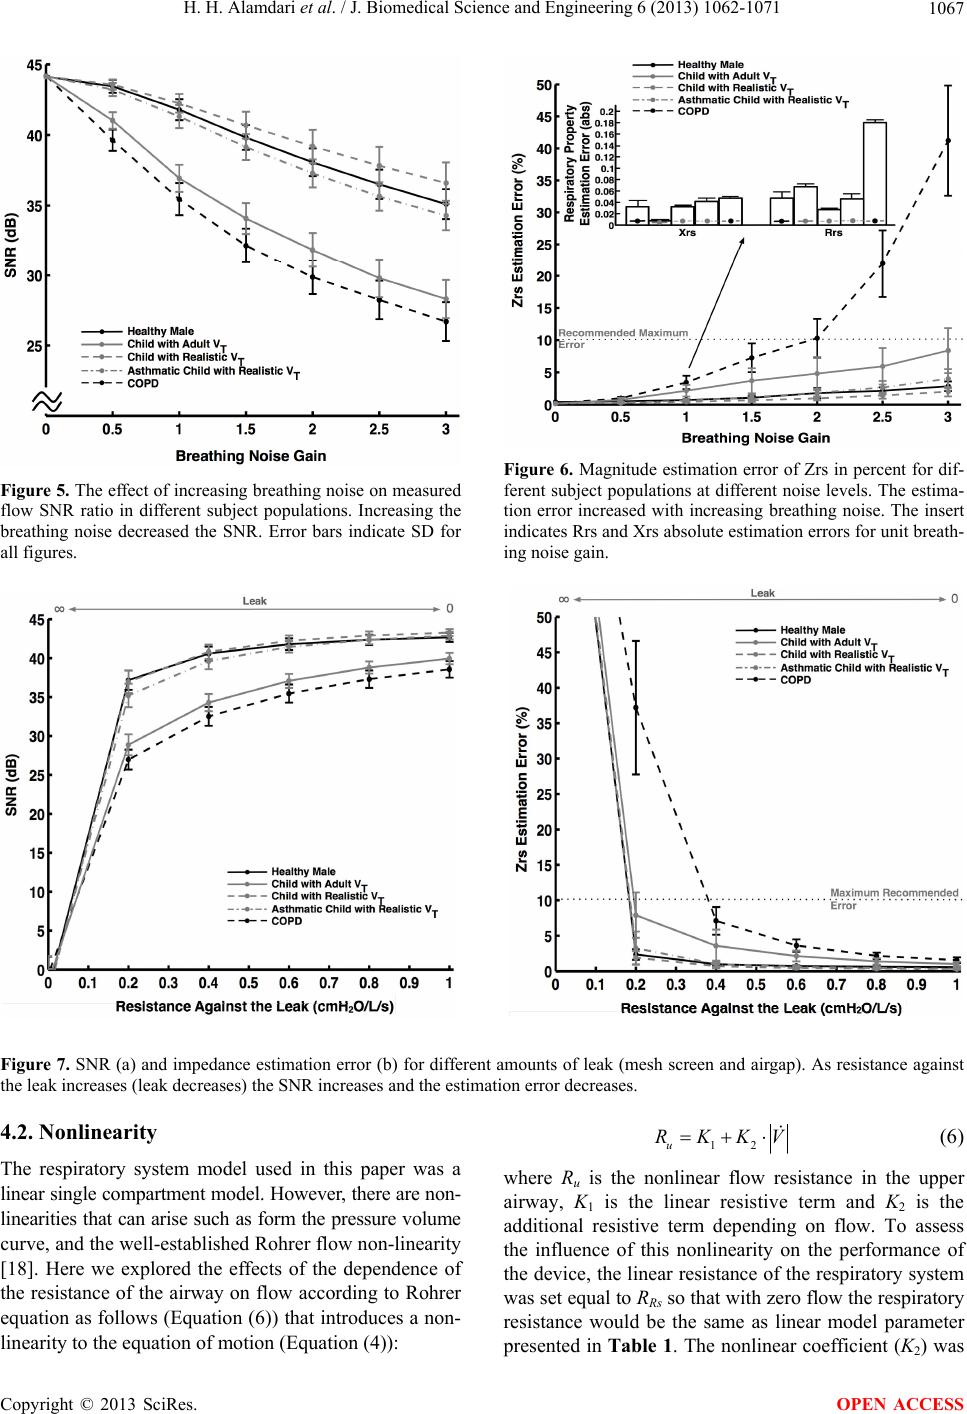 H. H. Alamdari et al. / J. Biomedical Science and Engineering 6 (2013) 1062-1071 1067 Figure 5. The effect of increasing breathing noise on measured flow SNR ratio in different subject populations. Increasing the breathing noise decreased the SNR. Error bars indicate SD for all figures. Figure 6. Magnitude estimation error of Zrs in percent for dif- ferent subject populations at different noise levels. The estima- tion error increased with increasing breathing noise. The insert indicates Rrs and Xrs absolute estimation errors for unit breath- ing noise gain. Figure 7. SNR (a) and impedance estimation error (b) for different amounts of leak (mesh screen and airgap). As resistance against the leak increases (leak decreases) the SNR increases and the estimation error decreases. 4.2. Nonlinearity The respiratory system model used in this paper was a linear single compartment model. However, there are non- linearities that can arise such as form the pressure volume curve, and the well-established Rohrer flow non-linearity [18]. Here we explored the effects of the dependence of the resistance of the airway on flow according to Rohrer equation as follows (Equation (6)) that introduces a non- linearity to the equation of motion (Equation (4)): 12u RKKV (6) where Ru is the nonlinear flow resistance in the upper airway, K1 is the linear resistive term and K2 is the additional resistive term depending on flow. To assess the influence of this nonlinearity on the performance of the device, the linear resistance of the respiratory system was set equal to RRs so that with zero flow the respiratory resistance would be the same as linear model parameter presented in Tabl e 1. The nonlinear coefficient (K2) was Copyright © 2013 SciRes. OPEN ACCESS 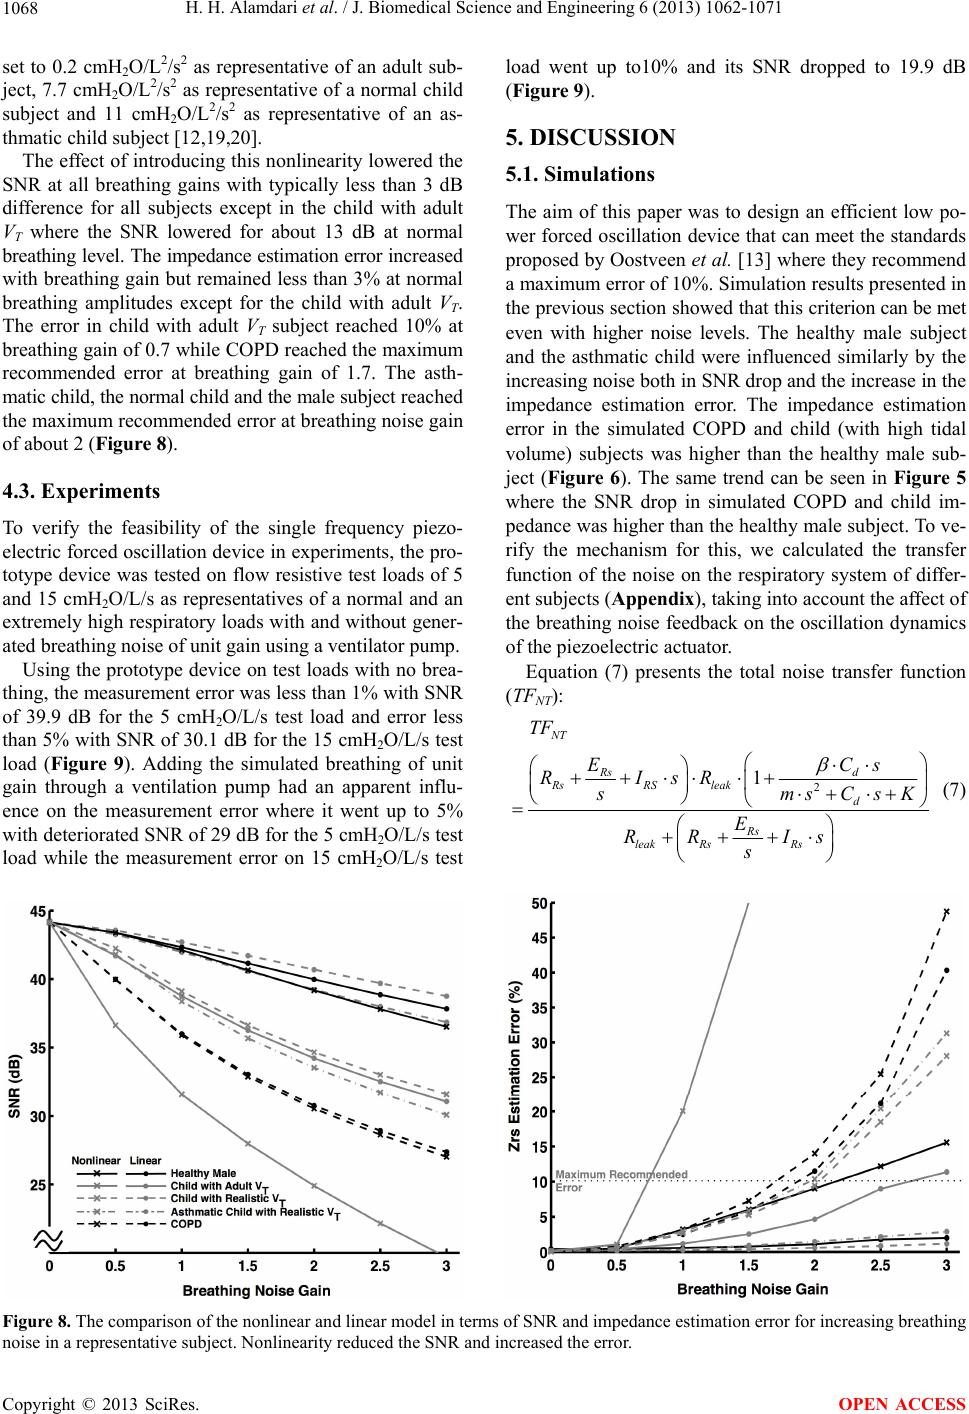 H. H. Alamdari et al. / J. Biomedical Science and Engineering 6 (2013) 1062-1071 1068 set to 0.2 cmH2O/L2/s2 as representative of an adult sub- ject, 7.7 cmH2O/L2/s2 as representative of a normal child subject and 11 cmH2O/L2/s2 as representative of an as- thmatic child subject [12,19,20]. The effect of introducing this nonlinearity lowered the SNR at all breathing gains with typically less than 3 dB difference for all subjects except in the child with adult VT where the SNR lowered for about 13 dB at normal breathing level. The impedance estimation error increased with breathing gain but remained less than 3% at normal breathing amplitudes except for the child with adult VT. The error in child with adult VT subject reached 10% at breathing gain of 0.7 while COPD reached the maximum recommended error at breathing gain of 1.7. The asth- matic child, the normal child and the male subject reached the maximum recommended error at breathing noise gain of about 2 (Figure 8). 4.3. Experiments To verify the feasibility of the single frequency piezo- electric forced oscillation device in experiments, the pro- totype device was tested on flow resistive test loads of 5 and 15 cmH2O/L/s as representatives of a normal and an extremely high respiratory loads with and without gener- ated breathing noise of unit gain using a ventilator pump. Using the prototype device on test loads with no brea- thing, the measurement error was less than 1% with SNR of 39.9 dB for the 5 cmH2O/L/s test load and error less than 5% with SNR of 30.1 dB for the 15 cmH2O/L/s test load (Figure 9). Adding the simulated breathing of unit gain through a ventilation pump had an apparent influ- ence on the measurement error where it went up to 5% with deteriorated SNR of 29 dB for the 5 cmH2O/L/s test load while the measurement error on 15 cmH2O/L/s test load went up to10% and its SNR dropped to 19.9 dB (Figure 9). 5. DISCUSSION 5.1. Simulations The aim of this paper was to design an efficient low po- wer forced oscillation device that can meet the standards proposed by Oostveen et al. [13] where they recommend a maximum error of 10%. Simulation results presented in the previous section showed that this criterion can be met even with higher noise levels. The healthy male subject and the asthmatic child were influenced similarly by the increasing noise both in SNR drop and the increase in the impedance estimation error. The impedance estimation error in the simulated COPD and child (with high tidal volume) subjects was higher than the healthy male sub- ject (Figure 6). The same trend can be seen in Figure 5 where the SNR drop in simulated COPD and child im- pedance was higher than the healthy male subject. To ve- rify the mechanism for this, we calculated the transfer function of the noise on the respiratory system of differ- ent subjects (Appendix), taking into account the affect of the breathing noise feedback on the oscillation dynamics of the piezoelectric actuator. Equation (7) presents the total noise transfer function (TFNT): 2 1 NT Rs d RsRS leak d Rs leak RsRs TF EC RIsR smsCs K E RR Is s s (7) Figure 8. The comparison of the nonlinear and linear model in terms of SNR and impedance estimation error for increasing breathing noise in a representative subject. Nonlinearity reduced the SNR and increased the error. Copyright © 2013 SciRes. OPEN ACCESS 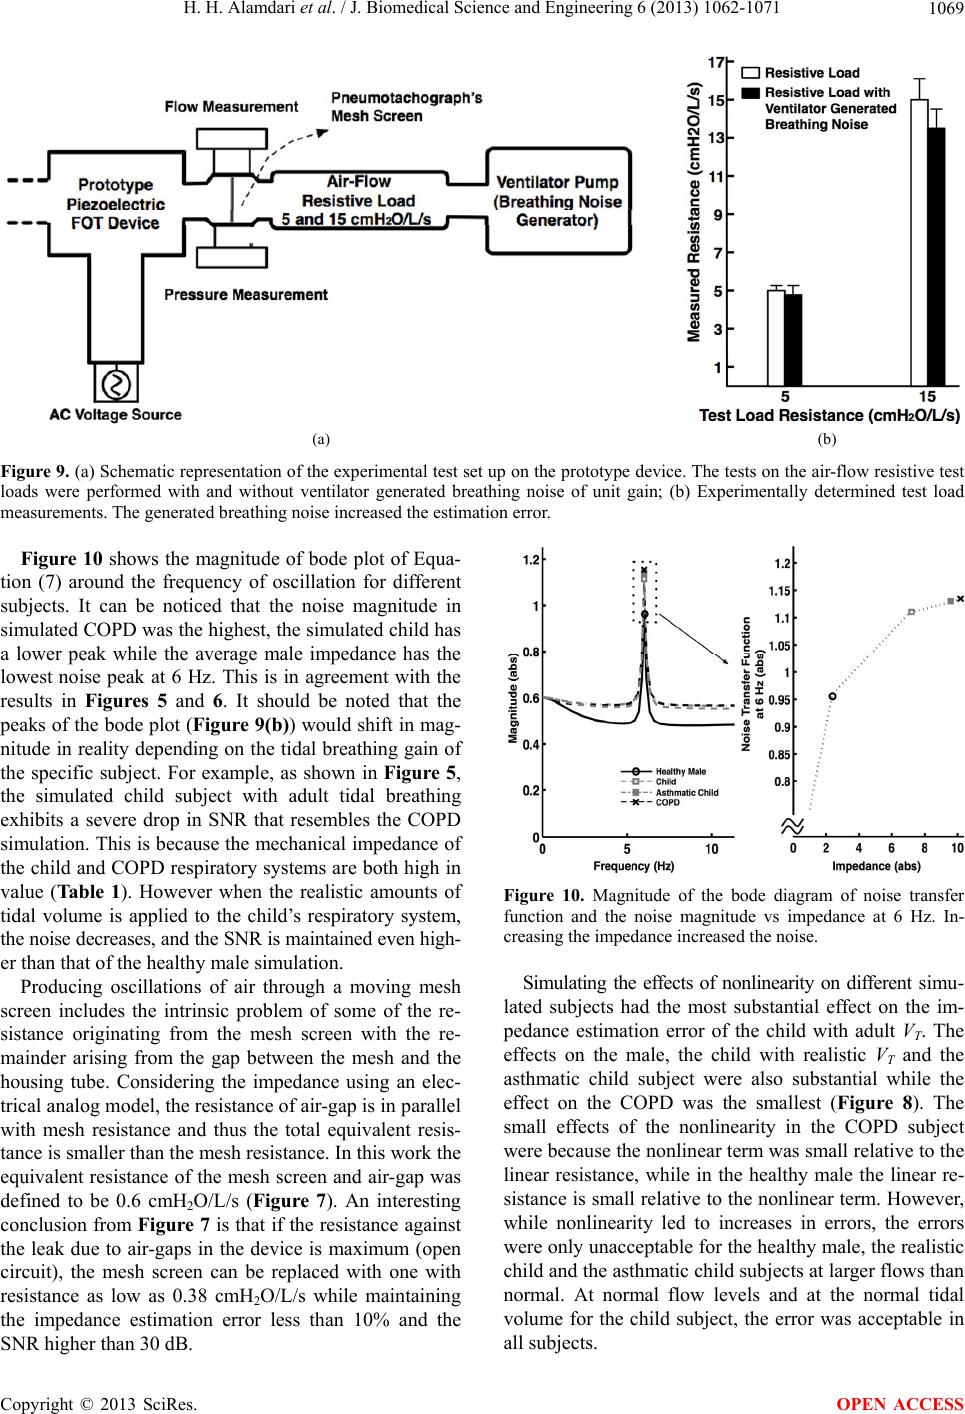 H. H. Alamdari et al. / J. Biomedical Science and Engineering 6 (2013) 1062-1071 1069 (a) (b) Figure 9. (a) Schematic representation of the experimental test set up on the prototype device. The tests on the air-flow resistive test loads were performed with and without ventilator generated breathing noise of unit gain; (b) Experimentally determined test load measurements. The generated breathing noise increased the estimation error. Figure 10 shows the magnitude of bode plot of Equa- tion (7) around the frequency of oscillation for different subjects. It can be noticed that the noise magnitude in simulated COPD was the highest, the simulated child has a lower peak while the average male impedance has the lowest noise peak at 6 Hz. This is in agreement with the results in Figures 5 and 6. It should be noted that the peaks of the bode plot (Figure 9(b)) would shift in mag- nitude in reality depending on the tidal breathing gain of the specific subject. For example, as shown in Figure 5, the simulated child subject with adult tidal breathing exhibits a severe drop in SNR that resembles the COPD simulation. This is because the mechanical impedance of the child and COPD respiratory systems are both high in value (Ta ble 1). However when the realistic amounts of tidal volume is applied to the child’s respiratory system, the noise decreases, and the SNR is maintained even high- er than that of the healthy male simulation. Producing oscillations of air through a moving mesh screen includes the intrinsic problem of some of the re- sistance originating from the mesh screen with the re- mainder arising from the gap between the mesh and the housing tube. Considering the impedance using an elec- trical analog model, the resistance of air-gap is in parallel with mesh resistance and thus the total equivalent resis- tance is smaller than the mesh resistance. In this work the equivalent resistance of the mesh screen and air-gap was defined to be 0.6 cmH2O/L/s (Figure 7). An interesting conclusion from Figure 7 is that if the resistance against the leak due to air-gaps in the device is maximum (open circuit), the mesh screen can be replaced with one with resistance as low as 0.38 cmH2O/L/s while maintaining the impedance estimation error less than 10% and the SNR higher than 30 dB. Figure 10. Magnitude of the bode diagram of noise transfer function and the noise magnitude vs impedance at 6 Hz. In- creasing the impedance increased the noise. Simulating the effects of nonlinearity on different simu- lated subjects had the most substantial effect on the im- pedance estimation error of the child with adult VT. The effects on the male, the child with realistic VT and the asthmatic child subject were also substantial while the effect on the COPD was the smallest (Figure 8). The small effects of the nonlinearity in the COPD subject were because the nonlinear term was small relative to the linear resistance, while in the healthy male the linear re- sistance is small relative to the nonlinear term. However, while nonlinearity led to increases in errors, the errors were only unacceptable for the healthy male, the realistic child and the asthmatic child subjects at larger flows than normal. At normal flow levels and at the normal tidal volume for the child subject, the error was acceptable in all subjects. Copyright © 2013 SciRes. OPEN ACCESS  H. H. Alamdari et al. / J. Biomedical Science and Engineering 6 (2013) 1062-1071 1070 5.2. Experiments The tests on the prototype device without breathing noise resulted in very low errors and high SNRs. As expected, after adding the breathing noise the SNR dropped and errors increased. However in the case of the 15 cmH2O/L/s test load which is higher than would be anticipated for adult subjects, but possible for children with airway ob- struction [13] the error reached the maximum recom- mended value (Figure 9(b)). Children fortunately have lower breathing noise, and thus this design is likely suit- able for a large range of subjects. These are for normal or nearly normal tidal volumes. However if measurements are to be made under larger ventilation conditions such as with exercise, the reduction in SNR would begin to cause larger errors in estimating impedance. If this is un- acceptable then larger oscillatory flows would be recom- mended using one or a combination of following techni- ques: Movement amplification techniques including me- chanical lever and/or using longer customized piezo- electric multimurphs and/or using multiple actuators at the same time for increasing the applicable force. Using an actuator with higher surface area to generate higher pressure oscillations. Reducing the amount of leak due to air-gaps. 6. CONCLUSION In this paper, for the first time, an oscillometry device was designed based on optimization in a simulation that included the device characteristics together with changes in subject impedance including perturbations from brea- thing. Although breathing noise reduced the SNR, the per- formance remained acceptable and demonstrated a useful design approach that led to the development of a feasible accurate lightweight portable single frequency FOT de- vice. Reducing the leak and improving the measurement accuracy of the transducers as well as modifications in the oscillating mesh and the actuator can improve the results from the prototype device. 7. ACKNOWLEDGEMENTS Hamed Hanafi and Lucas Posada were supported by the NSERC CREATE program at Dalhousie University, S. A. Bhatawadekar was supported by the NSERC. The authors thank Guy Drapeau at Thorasys Medical Systems for his great feedback especially for experiments. They also thank Andre Be- zanson for his help with piezoelectric actuators. REFERENCES [1] DuBois, A.B., Brody, A.W., Lewis, D.H., Burgess Jr., B.F. (1956) Oscillation mechanics of lungs and chest in man. Journal of Applied Physiology, 8, 587-594. [2] Dellacà, R.L., Pompilio, P.P., Walker, P.P., Duffy, N., Pe- dotti, A. and Calverley, P.M. (2009) Effect of bronchodi- lation on expiratory flow limitation and resting lung me- chanics in COPD. European Respiratory Journal, 33, 1329-1337. http://dx.doi.org/10.1183/09031936.00139608 [3] Morita, T. (2003) Miniature piezoelectric motors. Sensors and Actuators A, 103, 291-300. http://dx.doi.org/10.1016/S0924-4247(02)00405-3 [4] Uchino, K., Kato, K. and Tohda, M. (1988) Ultrasonic li- near motors using a multilayered piezoelectric actuator. Ferroelectrics, 87, 331-334. http://dx.doi.org/10.1080/00150198808201395 [5] Wang, Q.-M., Du, X.-H., Xu, B.M. and Eric Cross, L. (1999) Electromechanical coupling and output efficien- cy of piezoelectric bending actuators. IEEE Transactions on Ultrasonics, Ferroelectrics, and Frequency Control, 46, 638-646. http://dx.doi.org/10.1109/58.764850 [6] Cheng, H.-M., Ewe, M.T., Bashir, R. and Chiu, G.T.-C. (2001) Modeling and control of piezoelectric cantilever beam micro-mirror and micro-laser arrays to reduce im- age banding in electro photographic processes. Journal of Micromechanics and Microengineering, 11487-11498. [7] Goli, J., Smits, J.G. and Ballato, A. (1995) Dynamic bi- morph matrix of end-loaded bimorphs. IEEE Internatio- nal Frequency Control Symposium, 794-797. http://dx.doi.org/10.1109/FREQ.1995.484086 [8] Brown, N., Xuan, W., Salome, C., Berend, N., Hunter, M., Musk, A., James, A. and King, G. (2010) Reference equ- ations for respiratory system resistance and reactance in adults. Respiratory Physiology & Neurobiology, 172, 162-168. http://dx.doi.org/10.1016/j.resp.2010.05.013 [9] Navajas, D., Alcaraz, J., Peslin, R., Roca, J. and Farre, R. (2000) Evaluation of a method for assessing respiratory mechanics during noninvasive ventilation. European Re- spiratory Journal, 16, 704-709. http://dx.doi.org/10.1034/j.1399-3003.2000.16d23.x [10] Van Den Bergh, A. and Kerrebijn, K. (1985) Forced os- cillation technique. Reference values for resistance and reactance over a frequency spectrum of 2 - 26 Hz in heal- thy children aged 2.3 - 12.5 years. Bulletin of European Physiopathological Respiration, 21, 171-178. [11] Lall, C.A., Cheng, N., Hernandez, P., Pianosi, P.T., Dali, Z., Abouzied, A. and Maksym, G.N. (2007) Airway resis- tance variability and response to bronchodilator in chil- dren with asthma. European Respiratory Journal, 30, 260-268. http://dx.doi.org/10.1183/09031936.00064006 [12] Barbini, P., Cevenini, G. and Avanzolni, G. (2003) Non- linear mechanisms determining expiratory flow limitation in mechanical ventilation: A model-based interpretation. Annals of Biomedical Engineering, 31, 908-916. http://dx.doi.org/10.1114/1.1590665 [13] Oostveen, E., MacLeod, D., Lorino, H., Farre, R., Hantos, Z., Desager, K. and Marchal, F. (2003) On behalf of the ERS task force on respiratory impedance measurements: “The forced oscillation technique in clinical practice: Me- thodology, recommendations and future developments.” European Respiratory Journal, 22, 1026-1041. http://dx.doi.org/10.1183/09031936.03.00089403 Copyright © 2013 SciRes. OPEN ACCESS  H. H. Alamdari et al. / J. Biomedical Science and Engineering 6 (2013) 1062-1071 Copyright © 2013 SciRes. 1071 [14] Bhatawadekar, S.A., Leary, D., Chen, Y., Ohishi, J., Her- nandez, P., Brown, T., McParland, C. and Maksym, G.N. (2013) A study of artifacts and their removal during for- ced oscillation of the respiratory system. Annals of Bio- medical Engineering, Epub ahead of print. http://dx.doi.org/10.1007/s10439-012-0735-9 OPEN ACCESS [15] Van Dyke, K.S. (1928) The piezo-electric Resonator and its equivalent network. Proceedings of the IRE, 16, 742. [16] Inman, D. (2001) Engineering vibration. Prentice Hall, Upper Saddle River. [17] Jason H.T.B. (2009) Lung mechanics: An inverse model- ing approach. Cambridge University Press, Cambridge. http://dx.doi.org/10.1017/CBO9780511627156 [18] Rohrer, R. (1915) Der stroemungswiderstand in den men- schlichenatemwegen und der einfluss der unregelmaessi- genverzweigung des bronchialsystems auf den atmungs- verlauf in verschiedenenlungenbezirken. American Jour- nal of Physiology, 162, 225-229. http://dx.doi.org/10.1007/BF01681259 [19] Bouhuys, A. and Jonson, B. (1967) Alveolar pressure, air flow rate, and lung inflation in man. Journal of Applied Physiology, 22, 1086-1100. [20] Schweitzer, C., Chone, C. and Marchal, F. (2003) Influ- ence of data filtering on reliability of respiratory imped- ance and derived parameters in children. Pediatric Pul- monology, 36, 502-508. http://dx.doi.org/10.1002/ppul.10359 APPENDIX influence on oscillations of piezo actuator. Transforming Equation (4) into s-domain we have the transfer function of the respiratory system as below: The aim of this appendix is to calculate the total noise transfer function that appears in output pressure includ- ing the effect of breathing noise on the screen mesh. Rs Rs RsRS E TFRI s s (A.3) From Figure 4(c) we can write: 2 1 inPP bdP VKxxxC ms x (A.1) Therefore we can write (Figure 4(c)): awo bb NORs aw a P VVTFTFP R o (A.4) If we assume Vin = 0 and knowing that b b V x A r and Rearranging and using Equations (A.2) and (A.3), giv- es the total noise transfer function (TFNT) of: PP VxAr , with rearrangement we have: 2 d P NO bd Cs V TF VmsCs K (A.2) 1 Rs leakNO awo NT leak Rsb TF RTF P TF RTFV (A.5) Where TFNO is the transfer function of feedback noise |