Paper Menu >>
Journal Menu >>
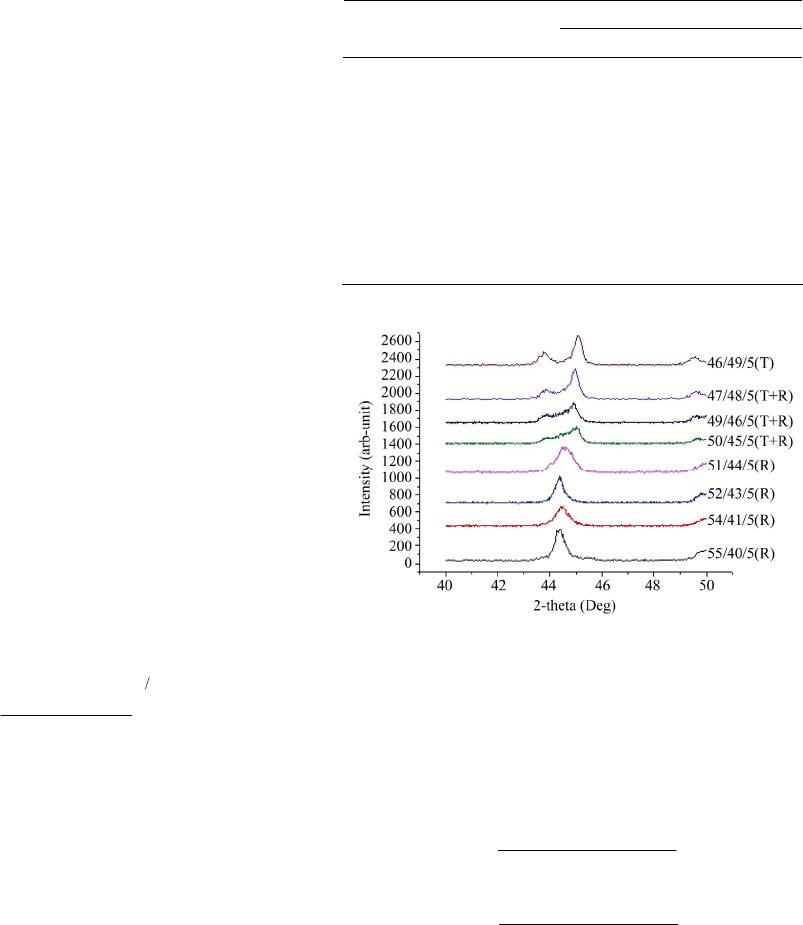
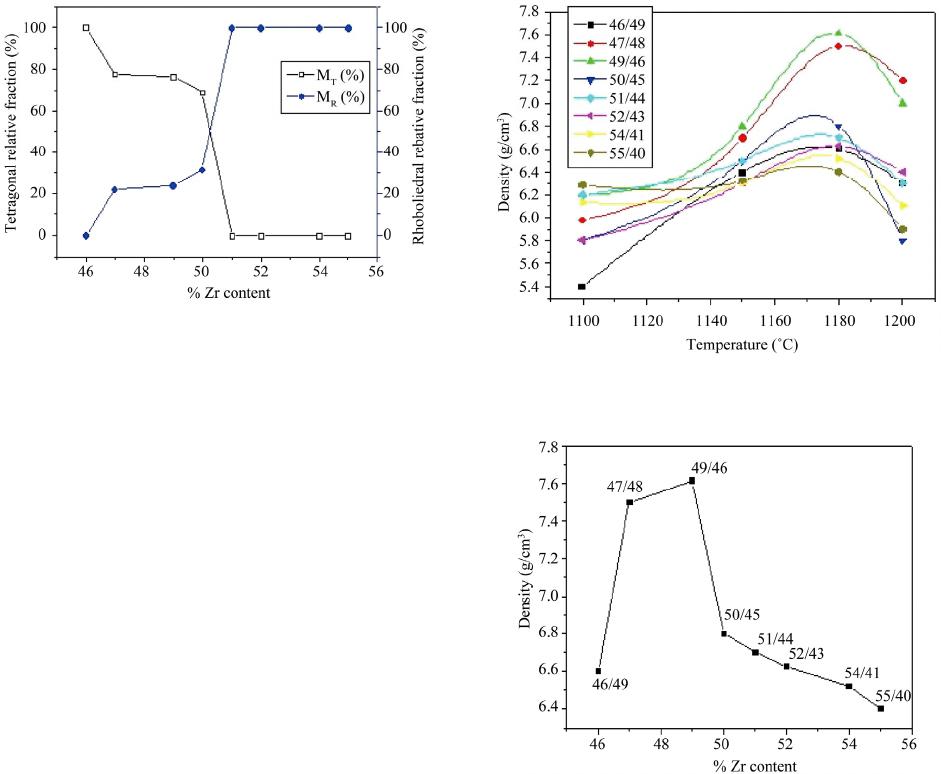
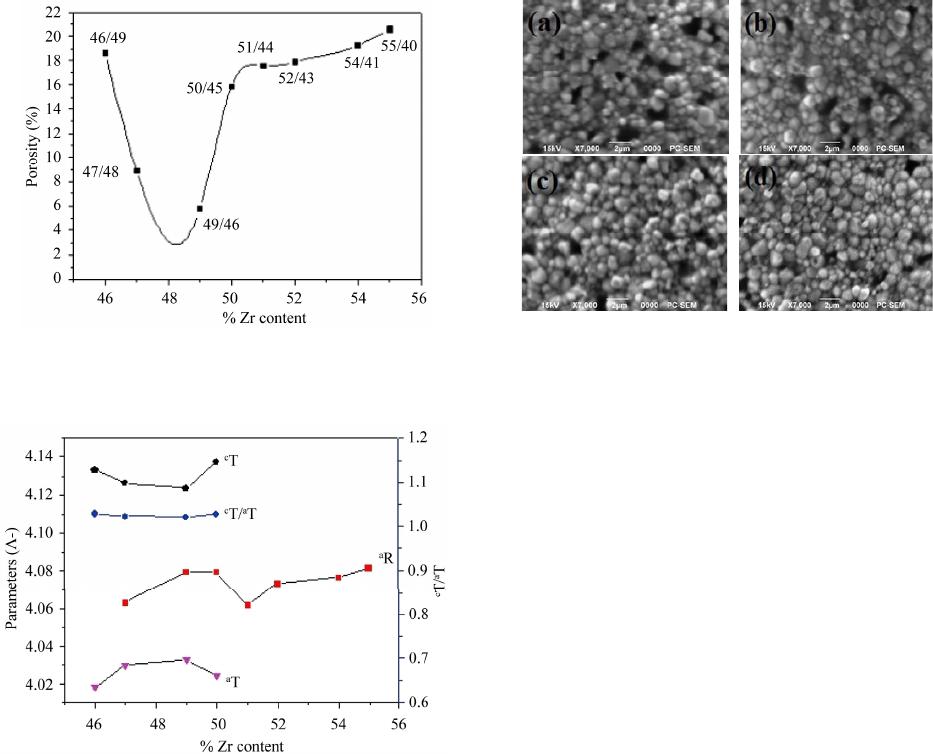
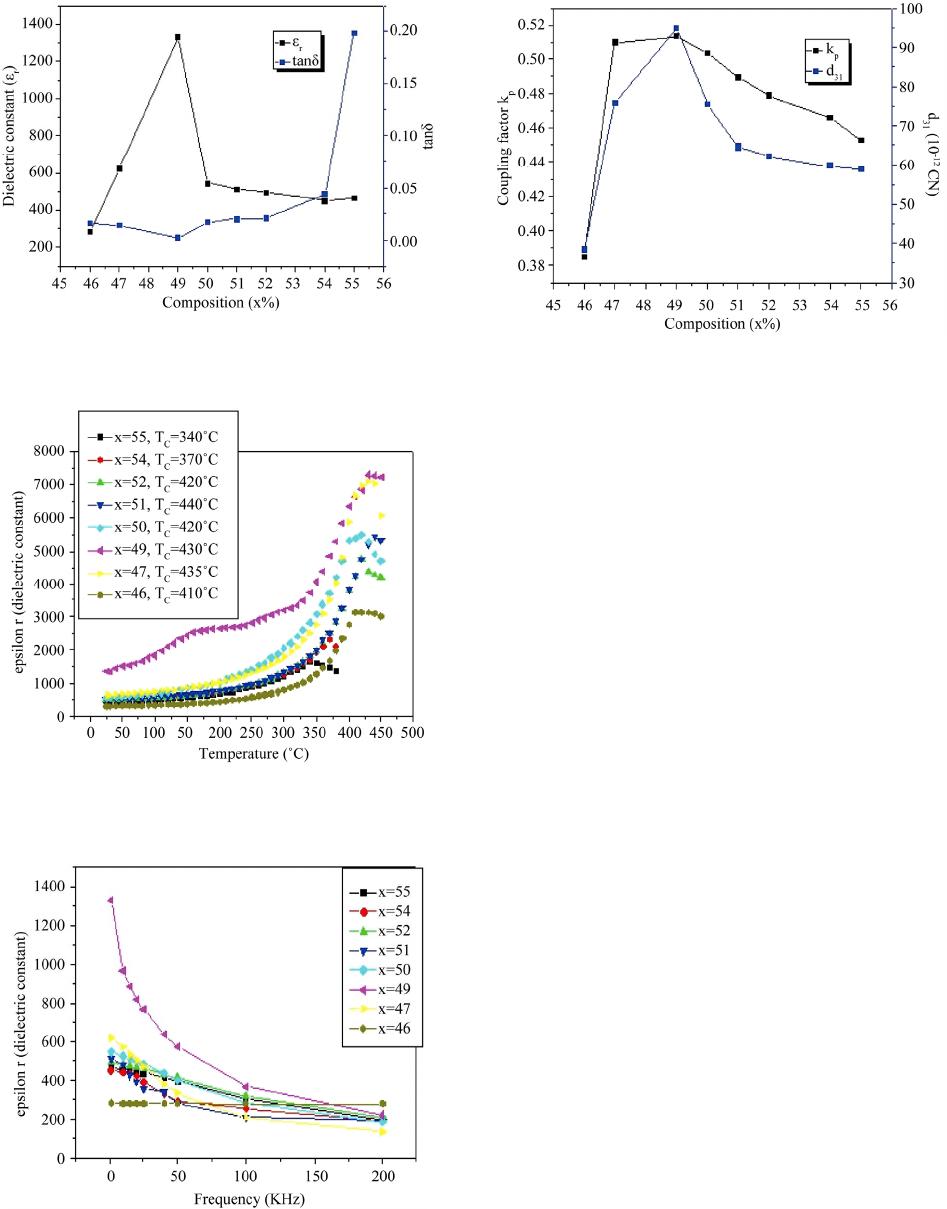
![]() Materials Sciences and Applications, 2013, 4, 723-729 Published Online November 2013 (http://www.scirp.org/journal/msa) http://dx.doi.org/10.4236/msa.2013.411091 Open Access MSA 723 Investigation on the Microstructure and Electrical Properties of the Compositionally Modified PZT Ceramics Prepared by Mixed-Oxide Method Malika Abba, Ahmed Boutarfaia, Zelikha Necira, Noura Abdessalem, Hayet Menasra, Abdelhek Meklid Laboratory of Applied Chemistry, Department of Science Matter, University of Biskra, Biskra, Algeria. Email: [email protected] Received August 17th, 2013; revised September 29th, 2013; accepted October 16th, 2013 Copyright © 2013 Malika Abba et al. This is an open access article distributed under the Creative Commons Attribution License, which permits unrestricted use, distribution, and reproduction in any medium, provided the original work is properly cited. ABSTRACT The structural and electrical properties of Pb[ZrxTi0.95−x(Mo1/3In2/3)0.05]O3 piezoelectric ceramics system with the com- position near the morphotropic phase boundary were investigated as a function of the Zr/Ti ratio. Studies were per- formed on the samples prepared by the conventional method of thermal synthesis of mixed oxides. The materials struc- ture was investigated by X-ray diffractometry to demonstrate the co-existence of the tetragonal and rhombohedral phases. In the present system, the MPB, in which the tetragonal and rhombohedral phases coexist, is in a composition range of 0.47 ≤ x ≤ 0.50. The lattice constants of the a and c axes for the samples were calculated from the XRD patterns. Microstructure of the sintered ceramics was observed by scanning electron microscopy (SEM) of free surfaces speci- mens. The relative permittivity, dielectric dissipation, piezoelectric coefficient and electromechanical coupling factor reach at maximum value x = 0.49 (εr = 7300.345 (at the Curie temperature), tanδ = 0.002050, d31 = 94.965 PC/N and kp = 0.513 and a Curie temperature of 430˚C). These properties are very promising for applications in ultrasonic motors. Keywords: Morphotropic Phase Boundary; Sintering Temperature; Zr/Ti Ratio 1. Introduction Lead zirconate titanate Pb(Zr,Ti)O3, a solid solution of perovskite ferroelectric PbTiO3 and anti-ferroelectric PbZrO3 with different Zr/Ti ratio, is an important mate- rial that is widely used in electronic sensors, actuators, resonators and filters [1-3]. The materials with a per- ovskite structure of general formula ABO3 (where A = mono or divalent ions, B = tri, tetra or pentavalent ions) have been found to be very useful and interesting for different solid-state devices [4-8]. By making suitable substitution at A and/or B-site of ABO3 structure, a large number of charge neutral or deficient compounds have been prepared [9-11] which have been found to be very suitable and useful for many industrial applications. In order to satisfy the requirements of practical appli- cations of ultrasonic motors, many ternary and quater- nary solid-solutions such as: Pb(Mn1/3Nb2/3)O3-PZT, Pb(Mn1/3Sb2/3)O3-PZT,Pb(Cd1/3Nb2/3)O3-PZT, Pb(Mn1/3Nb2/3)(Ni1/3Nb2/3)O3-PZT, have been synthesized by the modification or the substitution [12-18]. The influence of technological factors on the width of the co-existence region was investigated on the ternary system Pb[Zrx,Ti(0,95−x)(Mo1/3,In2/3)0.05]O3 by X-ray dif- fraction by varying the ratio Zr/Ti. The purpose of this work is to study the influence of sintering temperature on density, porosity and grain size on the ceramic in order to determine the width of co-existence of tetragonal and rhombohedral phases and the exact composition of the MPB rather than to determine the dielectric and the pie- zoelectric properties of these ceramics near the MPB in detail. 2. Experimental All of the specimens were prepared by the conventional ceramics technologie. The compositions of the Pb[Zrx,Ti(0.95−x)(Mo1/3,In2/3)0.05]O3 system werewith 46 ≤ x ≤ 55. The commercially available PbO, ZrO2, TiO2, MoO3 and In2O3, were used as the raw materials. Mixed oxides, after milling, were calcined at 800˚C for 2 h at heating and cooling rates of 2˚C/min. After calcinations, ![]() Investigation on the Microstructure and Electrical Properties of the Compositionally Modified PZT Ceramics Prepared by Mixed-Oxide Method 724 the ground and milled powders were pressed into disks 13 mm in diameter and about 1 mm in thickness. Pressed disks of 3PbO + 2ZrO2 placed in a capped crucible to pre- vent PbO evaporation during sintering. Four sintering con- ditions were selected to be used with both methods rang- ing 1000˚C, 1100˚C, 1150˚C, 1180˚C and 1200˚C for 2 h. The crystal structure of the samples was analyzed us- ing X-ray diffractometry (XRD; Siemens D500). The voltage and currents ratings used were 40 kV, 30 mA respectively, and CuKα radiation was used. The dif- fraction data were collected with X-ray scan speed of 0.1˚·min−1. The bulk density was measured using the Archimedes method. To investigate the electrical properties, the electrodes were made by applying a silver paste on the two major faces of the sintered disks followed by heat treatment at 750˚C for thirty minutes. The dielectric constant ε was calculated from the capacitance at a frequency of one KHz. It was measured at temperature ranging from 25˚C to 400˚C with a heating rate of one ˚C/minute by using an impedance analyzer (HP4192A, Heweltt-Packard). The piezoelectric samples firstly were being poled in a silicone oil bath at 120˚C by applying a d.c. field of thirty KV/cm for thirty minutes; and, then, were being cold under the same electric field. They were aged for twenty-four hours before testing. The electromechanical coupling factor Kp was deter- mined by the resonance and anti-resonance technique from the “Equation (1)” [19]. () 12 22 2 2.51 2 ar p a ff Kf ×− = (1) fa: anti-resonant frequency (Hz). fr: resonant frequency (Hz). 3. Results and Discussion 3.1. Phase Structure The sintered powders were examined by X-ray diffrac- tometry to ensure phase purity and to identify the phases. The phases of the samples were detected using XRD (at room temperature) for several compositions given in Ta- ble 1. It is reported that tetragonal, rhombohedral and T-R phases were identified by an analysis of the peaks 0 0 2 (tetragonal), 2 0 0 (tetragonal), 2 0 0 (rhombohedral)) in the 2 θ range 43˚ - 47˚. The splitting of (0 0 2) and (2 0 0) peaks indicates that they are the ferroelectric tetragonal phase (T), while the single (2 0 0) peak shows the rhombohedral phase (R) Figure 1 [20]. Triplet peaks indicate that the sample consists of a Table 1. Series of compositions and crystal structure. Crystal structure Sample 1000˚C 1100˚C 1150˚C 1180˚C Pb[Zr0.46Ti 0.49(Mo1/3In2/3)0.05]O3 T T T T Pb[Zr0.47Ti 0.48(Mo1/3In2/3)0.05]O3 T + R T T T + R Pb[Zr0.49Ti 0.46(Mo1/3In2/3)0.05]O3 T + R T + R T + RT + R Pb[Zr0.50Ti 0.45(Mo1/3In2/3)0.05]O3 T + R T + R T + RT + R Pb[Zr0.51Ti 0.44(Mo1/3In2/3)0.05]O3 T + R T + R T + RR Pb[Zr0.52Ti 0.43(Mo1/3In2/3)0.05]O3 T + R T + R T + RR Pb[ Zr0.54Ti 0.41(Mo1/3In2/3)0.05]O3T + R T + R R R Pb[Zr0.55Ti 0.40(Mo1/3In2/3)0.05]O3 R R R R T = Tetragonal; R = Rhombohedral; T-R = Tetragonal-Rhombohedral. Figure 1. The XRD patterns of Pb [Zrx,Ti(0.95−x)(Mo1/3,In2/3)0.05]O3 systemwith 0.46 ≤ x ≤ 0.55. mixture of tetragonal and rhombohedral phases. The multiple peak separation method was used to estimate the relative fraction of coexisting phases by which the rela- tive phase fraction MR and MT were then calculated using the following Equations (2) and (3) [21]: () () () () 200 200 002 200 R R RTT I MIII =++ (2) () () () () () 200 002 200 002 200 TT T RTT II MIII + ++ = (3) It is clear that, IR(200) is the integral intensity of the (200) reflection of the rhombohedral phase and IT(200), IT(002) are the integral intensities of the (200) and (002) reflections of the tetragonal phase, respectively. A transi- tion from tetragonal to rhombohedral phase is observed as Zr/Ti ratio increases. With increasing Zr/Ti ratio, tetragonal relative fraction decreases and rhombohedral relative fraction increases. At 1180˚C Figure 2, it is shown that the tetragonal structure can be formed up to xT > 0.46, while the rhom- bohedral structure becomes stabilized for xR < 0.51. However, at x = 0.46 - 0.51 tetragonal and rhombohedral Open Access MSA ![]() Investigation on the Microstructure and Electrical Properties of the Compositionally Modified PZT Ceramics Prepared by Mixed-Oxide Method 725 Figure 2. Variation of the relative content of the tetragonal and rhombohedral phases with different Zr% in the Pb[ZrxTi0,95−x(Mo1/3In2/3)0.05]O3 (for a sintering temperature about 1180˚C) [20]. phases coexist. The co-existence region is therefore quite narrow (Δx ≈ 0.05) and extends between xT and xR. The width Δx = xT − xR of the co-existence region from our work is close to that obtained by others [22,23]. The co- existence of tetragonal and rhombohedral phases has, therefore, to be attributed to the first order nature of the MPB, this is marked contrast to the proposition of Kake- gawa and al. [24,25] that the coexistence is invariably due to compositional fluctuations. The study of density is necessary to optimize the op- timum sintering temperature. The quality of the material increases with the increase of density and it increases with the increase of the sintering temperature [26]. The optimum temperature for sintering is determined from the pattern density as a function of sintering temperature d = f(T). So, the maximum density is the product of bet- ter quality electrical (low dielectric loss). Figure 3 gath- ers the curves of the density of all samples depending on the sintering temperature. A similar shape for all curves is that: the density is minimal for a sintering temperature T = 1000˚C, it begins to grow until it reaches a maximum value at a sintering temperature T = 1180˚C. Then, it decreases at the sintering temperature T = 1200˚C which means that the optimum temperature for sintering is 1180˚C. The increased density means fewer and pore size, so the volume of the cell decreases and consequently the structure becomes more compact. The optimum sintering temperature depends on several factors such as the addition of impurities, the rate of heating, time of thermal treatment and protecting atmos- phere. Changes in the density of different samples of Pb[ZrxTi0,95−x(Mo1/3In2/3)0.05]O3 sintered at 1180˚C de- pending on the rate of Zr is shown in Figure 4. The shape of the curve shows that the density increases with the increase of Zr concentration until a maximum Figure 3. Effect of sintering temperature on density for Pb[ZrxTi0,95−x(Mo1/3In2/3)0.05]O3. Figure 4. Evolution of density as a function of the concen- tration of Zr% [20]. value of 7.61g/cm3 (94.18% of theoretical density) at Zr = 49% (sample No. 3) and then it decreases [20]. Figure 5 shows the variation of the porosity for dif- ferent samples depending on the concentration of Zr% and the sintering temperature of 1180˚C, noting that the porosity decreases until itreaches the minimum value p = 5.81% for Zr = 0.49 (sample No. 3) and then it increases. The parameters of the lattice were determined from the triplets (200) by using a nonlinear least squares method [27]. The aR—parameter of the rhombohedral phase and the aT—parameter, cT—parameter, and the tetragonality (cT/aT) of the tetragonal phase of Pb[ZrxTi0,95−x(Mo1/3In2/3)0.05]O3 ceramics are plotted as a function of the ratio of Zr/Ti in Figure 6. The results showed that the parameters of the lattice of the tetra- gonalphase changed when the ratio of Zr/Ti was modi- fied. While the value of the aT parameter increased, the one of cT parameter decreased and the aR parameter of Open Access MSA ![]() Investigation on the Microstructure and Electrical Properties of the Compositionally Modified PZT Ceramics Prepared by Mixed-Oxide Method 726 Figure 5. The variation of porosity as a function of the con- centration of Zr% for Pb [ZrxTi0.95−x(Mo1/3In2/3)0.05]O3 (for a sintering temperature about 1180˚C) [20]. Figure 6. The parameters of the lattice of Pb[ZrxTi0,95−x(Mo1/3In2/3)0.05]O3 ceramics as a function of composition(for a sintering temperature about 1180˚C) [20]. the rhombohedral phase increased. The resulting values of the parameters of the lattice of the tetragonal phase showed that the cT/aT axial ratio is decreased as aT it is increased and cT is decreased. The values of the parame- ters of the lattice were revealed to be practically the same as those which previously studied [28,29]. Figure 7 gives the SEM micrographs of free surfaces of the specimens sintered at 1000˚C - 1180˚C for 2 h. From these images, small crystallites with large pores for specimens sintered at 1000˚C Figure 7(a) were noticed. As the sintering temperature increased, the grain grew and the average grain size increased slightly. Whereas, the number and the size of the pores is decreased. The grain size exponentially increased with the increase of temperature and this can be well explained by the phe- nomenological kinetic grain grow equation [30]. The average grain size is 1.15 µm at temperature 1000˚C which increases to 1.56 µm at temperature 1180˚C [20]. Figure 7. SEM micrographs for Pb[Zr0.50Ti0.45(Mo1/3,In2/3)0.05]O3 ceramics sintered at (a) 1000˚C, (b) 1100˚C (c) 1150˚C and (d) 1180˚C. 3.2. Dielectric and Piezoelectric Properties The dielectric properties at room temperature are plotted as a function of the Zr/Ti ratio in Figure 8. The ε in- crease with the increase of Zr/Ti ratio. It achieves a maximum value of 1331.955 only when x = 0.49 and then it decreases significantly as the Zr/Ti ratio increases further. The tanδ shows an inverse trend and reaches the minimum value of 0.00205 when x = 0.49. The temperature dependence of the dielectric constant for Pb[ZrxTi0.95−x(Mo1/3In2/3)0.05]O 3 ternary ceramics at 1 KHz is shown in Figure 9. It is observed in all the com- positions as the temperature increase, the value of dielec- tric constant increases and passes through a maximum (at TC) and then decreases. The Curie temperature increased from 340˚C to 440˚C in our choosing composition. The maximum dielectric constant at MPB (x = 0.49) is about 7300.345. The variation in dielectric constant with frequency for Pb[ZrxTi0.95−x(Mo1/3In2/3)0.05]O3 ternary ceramics is shown in Figure 10. The plots show that the dielectric constant decreases with an increase in frequency, showing disper- sion in lower frequency rang. It attains a constant value and remains independent of frequency. Thereafter, all the samples reveal dispersion due to Maxwell-Wagner [31, 32] type interfacial polarization in agreement with Koop’s phenomenological theory [33]. The high value of dielec- tric constant observed at lower frequencies can be ex- plained on the basis of space charge polarization due to heterogeneous in structure like impurities, porosity and grain structure [34]. The electromechanical coupling factor (kp) and the piezoelectric coefficient (d31) are shown in Figure 11. These properties were also strongly influenced by the composition of the specimen. The highest d31 of 94.965 pC/N and Kp of 0.513 were observed for the composition of x = 0.49. Considering that the fact of this composition Open Access MSA ![]() Investigation on the Microstructure and Electrical Properties of the Compositionally Modified PZT Ceramics Prepared by Mixed-Oxide Method 727 Figure 8. The dielectric constant ε and the loss tangent (at room temperature, 1 KHz) for Pb[ZrxTi0,95−x(Mo1/3In2/3)0.05]O3 ceramics sintered at 1180˚C. Figure 9. Temperature dependence of the dielectric con- stant for Pb[ZrxTi0.95−x(Mo1/3In2/3)0.05]O3 ceramics sintered at 1180˚C (1 KHz). Figure 10. Variation of dielectric constant with frequen- cy for Pb[ZrxTi0,95−x(Mo1/3In2/3)0.05]O3 ceramics sintered at 1180˚C. Figure 11. Variation of Kp and d31 for Pb[ZrxTi0.95−x(Mo1/3In2/3)0.05]O3 ceramics sintered at 1180˚C. corresponds to the MPB and the maximum piezoelectric properties observed for this polycrystalline composition are reasonable. When the PZT content was varied away from the MPB, both the d31 and kp value decreased asymmetrically. In the rhombohedral side, both the d31 and kp value were decreased much more rapidly. 4. Conclusions In this study, ceramics in the Pb[ZrxTi0.95−x(Mo1/3In2/3)0.05]O3 system (with 0.46 ≤ x ≤ 0.55) were successfully prepared by a solid-state mixed- oxide technique. The co-existence region was investi- gated by X-ray diffraction. The study of the morpho- tropic phase boundary has established that the phase transition from tetragonal to rhombohedral symmetry takes place at x = 0.49 and the width of the phase bound- ary that has been found to be in the range of 0.47 ≤ x ≤ 0.50 at 1180˚C. The lattice parameters aT and cT of the tetragonal struc- ture and aR of the rhombohedral structure were found to change with composition. The effect of the sintering temperature on the density and grain size has been inves- tigated. It was demonstrated that the grain size and the density increased with the increase of the sintering tem- perature. The optimum sintering temperature (1180˚C) corresponds to the maximum density. So, the minimum value of porosity is also corresponds to the better quality product. The electrical and piezoelectric properties exhibit a compositional dependence. The samples showing the co- existence of morphotropic phase boundary (MPB) ex- hibit good properties. The results indicate that although this kind of ceramics displays good properties, further study is needed to improve their stabilities of the ceramics in order to be utilized in various temperature environ- ments. Open Access MSA ![]() Investigation on the Microstructure and Electrical Properties of the Compositionally Modified PZT Ceramics Prepared by Mixed-Oxide Method 728 REFERENCES [1] T. Ezaki, S. Manuspiya, P. Moses, K. Uchino and V. Caraz, “Piezoelectric Transformers for a High Power Module,” Journal of Materials Technology, Vol. 79, No. 19, 2004, pp. 79-82. [2] B. Jaffe, W. R. Cook and H. Jaffe, “Piezoelectric Ceram- ics,” Academic Press, New York, 1971. [3] K. Uchino, “Piezoelectric Actuators 2008: Key Factors for Commercialization,” Advanced Materials Research, Vol. 55-57, 2008, pp. 1-9. [4] J. Valasek, “Piezoelectric and Allied Phenomena in Ro- chelle Salt,” Physical Review, Vol. 17, No. 4, 1921, pp. 475-481. [5] B. Wul, L. M. Goldman and C. R. Acad Sci, URSS, Vol. 46, 1945, p. 123. [6] S. Pilgrim, M. Audrey, E. Sutherland and E. R. Winzer, “Diffuseness as a Useful Parameter for Relaxer Cera- mics,” Journal of the American Ceramic Society, Vol. 73, No. 10, 1990, pp. 3122-3125. [7] S. Miga and K. Wojcik, “Investigation of the Diffuse Phase Transition in PLZT X/65/35 Ceramics, X = 7 - 10,” Ferroelectrics, Vol. 100, No. 1, 1989, pp. 167-173. [8] K. L. Yadav, R. N. P. Choudhary and T. K. Chaki, “Struc- tural, SEM and Dielectric Properties of PLZT,” Journal of Materials Science, Vol. 27, No. 19, 1992, pp. 5244- 5246. [9] G. H. Heartling, “PLZT Electroopic Materials and Appli- cations,” Ferroelectrics, Vol. 75, 1987, pp. 25-55. [10] L. Ramji, S. C. Sharma and D. Rajiv, “Piezoelectric Char- acteristics of Spray-Dried PZT Ceramics Modified by Is- ovalent, Supervalent and Subvalent Substitutions,” Fer- roelectrics, Vol. 100, 1989, pp. 43-55. [11] G. H. Heartling, “Piezoelectric and Electrooptic Cera- mics,” In: R. C. Buchanan, Ed., Ceramics Materials for Electronics, Marcel Dekker, New York, 1991, pp. 139- 225. [12] H. I. Chae, Y. S. Shin, K. J. Lim, H. D. Bae and D. W. Shin, “Vibration Level Dependence of Piezoelectric Con- stant in PT-PZ-PCN System Ceramic,” Proceedings of the 4th Internationnal Conference on Properties of Ap- plied Dielectrics and Materials, Brisbane, 3-8 July 1994, pp. 17-20. [13] L. Wu, C. K. Liang and C. F. Shieu, “Piezoelectric Prop- erties of (Pb, Sr) (Zr, Ti, Mn, Zn, Nb)O3 Piezoelectric Ceramic,” Journal of Materials Science, Vol. 26, 1991, pp. 4439-4444. [14] J. S. Kim, S. J. Kim, H. J. Kim, D. C. Lee and K. Uchino, “Piezoelectric and Dielectric Properties of Fe2O3-Doped 0.57Pb(Sc1/2Nb1/2)O 3-0.43PbTiO3 Ceramic Materials,” Ja- panese Journal of Applied Physics, Vol. 38, 1999, pp. 1433-1437. [15] D. J. Lee, S. S. Kwon, S. H. Jeong, K. J. Lim, S. G. Park, H. H. Kim and T. Y. Lim, “The Piezoelectric Characteris- tics of PZ-PT-PMS Ceramics with Addition of CeO2 for Large Displacement Application,” Proceedings of the IEEE International Conference on Conduction and Break- down in Solid Dielectric, Vlisterris, 22-25 June 1998, pp. 381-384. [16] X. H. Zhu and Z. Y. Meng, “The Influence of the Mor- photropic Phase Boundary on the Dielectric and Piezo- electric Properties of the PNN-PZ-PT Ternary System,” Journal of Materials Science, Vol. 31, 1996, pp. 2171- 2175. [17] X. B. Guo, H. Y. Chen and Z. Y. Meng, The American Ceramic Society 103rd Annual Meeting, Indianapolis, 2000. [18] S. Tashiro, M. Ikehiro and H. Igarashi, “Influence of Tem- perature Rise and Vibration Level on Electromechanical Properties of High-Power Piezoelectric Ceramics,” Japa- nese Journal of Applied Physics, Vol. 36, 1997, pp. 3004- 3009. [19] IEEE Standard on Piezoelectricity, “IEEE Standard 176- 1978,” Institute of Electrical and Electronic Engineers, New York, 1978. [20] M. Abba, Z. Necira, N. Abdessalem and A. Bouterfaia, “Contribution to the Study of the Coexistence of Phases Tetragonal-Rhombohedral in Ceramic type PZT and Gen- eral Form: Pb[ZrxTi0,95-x(Mo1/3In2/3)0.05]O3,” EPJ Web of Conferences, Vol. 29, 2012. [21] G. H. Haerding and C. E. Land, Soc, Vol. 45, 1974, pp. 1-11. [22] T. Kala, “Study of the Influence of Manganese and Lan- thanum Oxides on the Band Structure of Pb(Zr, Ti)O3,” Physica Status Solidi (a), Vol. 73, 1982, pp. 573-578. [23] K. Kakegawa and J. Mohri, “A Compositional Fluctua- tion and Properties of Pb(Zr,Ti)O3,” Solid State Commu- nicationgs, Vol. 24, No. 11, 1977, pp. 769-772. [24] K. Kakegawa, J. Mohri, X. Shrasaki and K. Takahaashi, “Sluggish Pansition between Tetragonal and Rhombo- Hedral Phases of Pb(Zr,Ti)O3,” Journal of the American Ceramic Society, Vol. 65, 1982, pp. 515-519. [25] W. Hammer and M. J. Hoffmann, “Detailed X-Ray Dif- fraction Analyses and Correlation of Microstructural and Electromechanical Properties of La-Doped PZT Cera- mics,” Journal of Electroceramics, Vol. 2, 1998, pp. 75- 84. [26] B. Jaff, W. R. Cook and H. Jaff, “Piezoelectric Cera- mics,”Acadimic Press, London, 1971. [27] B. D. Cullity, “Elements of X-Ray Diffraction,” Addison- Wesley Publishing Company, Inc., 1978. [28] A. Boutarfaia, “Investigation of Co-Existence Region in Lead Zirconate Titanate Solid Solutions: X-Ray Diffrac- tion Studies,” Ceramics International, Vol. 26, No. 6, 2000, pp. 583-587. [29] A. Boutarfaia, “Study of Solid State Reaction and the Morphotropic Phase Boundary in Pb(Zr,Ti)O3-Pb(Fe1/5, Ni1/5,Sb3/5)O3 Ceramics,” Ceramics International, Vol. 27, No. 1, 2001, pp. 91-97. http://dx.doi.org/10.1016/S0272-8842(00)00047-X [30] T. Senda and R. C. Bradt, “Grain Growth in Sintered ZnO and ZnO-Bi2O3 Ceramics,” Journal of the American Ce- ramic Society, Vol. 73, 1990, pp. 106-114. [31] J. C. Maxwell, “Electricity and Magnetism,” Oxford Uni- Open Access MSA Investigation on the Microstructure and Electrical Properties of the Compositionally Modified PZT Ceramics Prepared by Mixed-Oxide Method Open Access MSA 729 versity Press, London, 1973. [32] K. W. Wagner, Annals of Physics, Vol. 40, 1993, p. 818. [33] C. G. Koops, “On the Dispersion of Resistivity and Di- electric Constant of Some Semiconductors at Audiofre- quencies,” Physical Review, Vol. 83, 1951, pp. 121-124. [34] S. Upadhyay and D. Omprakash, “Effect of Composition on Dielectric and Electrical Properties of the Sr1−xLaxTi1−xCoxO3 System,” Bulletin of Materials Sci- ence, Vol. 19, 1996, pp. 513-525. |