

Paper Menu >>
Journal Menu >>
 Energy and Power E ngineering, 2013, 5, 1449-1455 doi:10.4236/epe.2013.54B275 Published Online July 2013 (http://www.scirp.org/journal/epe) Copyright © 2013 S ciRes. EPE Equivalent for Electromagnetic Transient Calculation in Power System with Multiple Transmission Line Paweł Sowa, Katarzyna Łuszcz Silesian University of Technology, Electrical Faculty, Bolesława Krzywoustego 2, 44-100 Gliwice, Poland Email: pawel.sowa@polsl.pl, [email protected] Received April, 2013 ABSTRACT The results of searching o f equivalent for electro magnetic transient calcula tion in power system with the big number of transmission lines are shown. Brief information on the proper transmission line model is given. Comparison of results of simulation in real and reduced system is presented taking into consideration three methods of identification. Some example are examined for different number of transmission lines in reduced system and co nsequentl y the re co mme nda- tion are given for sea rching of equivalents of s ys tems with many lines. Keywords: Electromagnetic T r ansients; Equivalents; Tra nsmission Line Representation 1. Introduction For a large complex system the full representation for transient electromagnetic analysis is not necessary or practicable. The main interest during the study of dy- namic phenomena in power system is directed to the waveform occurring only in certain parts of the system. Very often, this is defined as the internal syste m, and t he remaining part is referred to as an external keyboard. Internal networks are modeled with an accurate repre- sentation of all the properties that are important in the analysis of the p henomenon. The external s ystem can be mapped on the basis of reduced structure or can be re- placed by equivalent defined on the basis of one of the available methods in the time or frequency domain. The network models are replacement parts, corres- ponding to the reduced power of the system. Very often there are mistakes, involving the creation of a model too careful or too radical for its simpli fication. There is no generalized criterion by which it can be determined in advance the structure of the reduced equiva lent cir cuit for systems in which t he stud y o f ele c- tromagnetic transients will be made. Despite many years of research, as yet, the universal equivalent was not found that would faithfully reproduce the behavior of the power syst em during these eve nts. Of course, the most reliable analytical results can be obtained from measurements in a real power system. Unfortunately, in the case of the study of electromagnetic transient phenomena, which usually are the result of faults, conducting measurements is due to economic, technical and organizational reasons very rare. These measurements are carried out in two ways: • Carried out at various points in the system, eg at protection location, during short-circuit i n the line • Measuring devices are connected to the selected node and recording waveform during faults (for which "waiting"). In the first case, the choice of specific situation (the type and location of fault) is possible, but safety consid- erations require the introduction of a number of restric- tions in order to avoid the possible consequences of the development of the faults. Limitations cause disconnec- tion of the system, some of the load off, carrying out tests on specified dates, etc. In the second case, the recording of the actual events in the original system without restrictions is possible. However there are “accidental faults”, which recorded even within a fe w years, are not sufficient for a compre- hensive analysis. Computer simulations have the advantage that it is possible their multi variability forcing different types of disturbances in the power system anywhere, without any risk to its future work. Recently, most studies were performed in systems to replace a large part of a complex system using simple impedance calculated on the basis of short-circuit power of these systems. This approach is acceptable only for very simplified analysis of transients. The biggest prob- lem in such cases is to determine - based usually on the expe riment, how is t he part o f the s ystem wh ich mus t be modeled in detail and which is the remaining part must be replaced by equivalent. 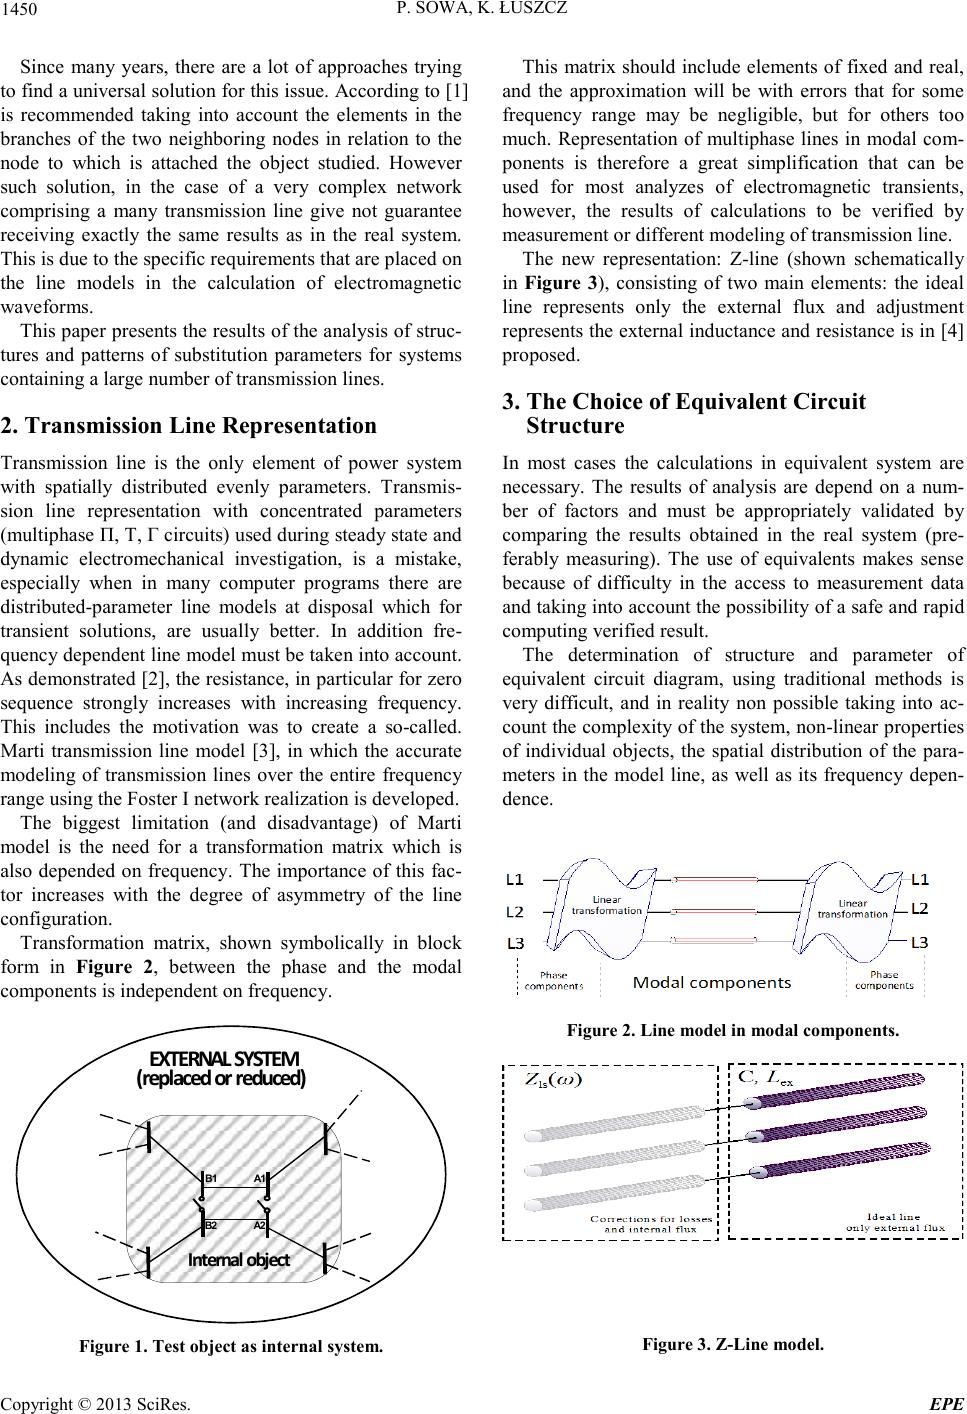 P. SOWA, K. ŁUSZCZ Copyright © 2013 S ciRes. EPE 1450 Since many years, there are a lot of approaches trying to find a universal solutio n for this issue. Accordin g to [1] is recommended taking into account the elements in the branches of the two neighboring nodes in relation to the node to which is attached the object studied. However such solution, in the case of a very complex network comprising a many transmission line give not guarantee receiving exactly the same results as in the real system. This is due to the specific requirements that are placed on the line models in the calculation of electromagnetic waveforms. Thi s pape r pre sents the r esul ts of t he anal ysis o f str uc- tures and patterns of substitution parameters for systems containing a large number of transmi ssio n lines. 2. Transmission Line Representation Transmission line is the only element of power system with spatially distributed evenly parameters. Transmis- sion line representation with concentrated parameters (multiphase Π, T, Γ circuits) used during steady state and dynamic electromechanical investigation, is a mistake, especially when in many computer programs there are distributed-parameter line models at disposal which for transient solutions, are usually better. In addition fre- quency dependent line model must be taken into account. As demonstrated [2 ], the resistance, in particular for zero sequence strongly increases with increasing frequency. This includes the motivation was to create a so-called. Marti transmission line model [3], in which the accurate modeling of transmission lines over the entire frequency range using the Foster I network realization is developed. The biggest limitation (and disadvantage) of Marti model is the need for a transformation matrix which is also depended on frequency. The importance of this fac- tor increases with the degree of asymmetry of the line configuration. Transformation matrix, shown symbolically in block form in Figure 2, between the phase and the modal components is independent on frequency. A1 A2 B1 B2 Internal object EXTERNAL SYSTEM (replaced or reduced) Figure 1 . Test object as internal system. This matrix should include elements of fixed and real, and the approximation will be with errors that for some frequency range may be negligible, but for others too much. Representation of multiphase lines in modal com- ponents is therefore a great simplification that can be used for most analyzes of electromagnetic transients, however, the results of calculations to be verified by measurement or different modeling of transmission line. The new representation: Z-line (shown schematically in Figure 3), consisting of two main elements: the ideal line represents only the external flux and adjustment represents the external inductance and resistance is in [4] proposed. 3. The Choice of Equivalent Circuit Structu re In most cases the calculations in equivalent system are necessary. The results of analysis are depend on a num- ber of factors and must be appropriately validated by comparing the results obtained in the real system (pre- ferably measuring). The use of equivalents makes sense because of difficulty in the access to measurement data and ta king i nto acc ount t he p ossib ilit y of a safe and rapid computing verified result. The determination of structure and parameter of equivalent circuit diagram, using traditional methods is very difficult, and in reality non possible taking into ac- count t he co mplexit y of the sys tem, no n-linear properties of individual objects, the spatial distribution of the para- meters in the model line, as well as its frequency depen- dence. Figure 2 . Line model in mod al components. Figure 3 . Z-Lin e mod e l.  P. SOWA, K. ŁUSZCZ Copyright © 2013 S ciRes. EPE 1451 In many studies of electromagnetic phenomena as- sumes a “double standard” during computer simulations. The test object (e.g. transmission line) representation takes into account all possible requirements, but the re- maining system is reduced to a simple structure consist- ing of few eleme nts. A classic example is the diagram shown in Figure 4. Transmission line model as the test object is supplied from both sides systems, which are represented by lumped parameters R, L. The irrationality of such ap- proach is the fact that to the same node, which is con- nected to the test line, may be attached other transmis- sion lines, of which the parameters have the same impor- tance as the test object. The question is: why the “object” line is modeled with distributed, frequency depended parameters, but the other lines are modeled with the help of lumped parameters R and L. Elements of equivalents in Figure 4 are determined on the basis of short-circuit power system (calculation of reactance) and the estimated time constant (dete rmin a- tion of resistance). Among supporter of such simplification is the simple idea that systems characterized by high power short cir- cuit do not substantially affect the electromagnetic waveforms - espe ciall y the hi gher fr equenc y co mpone nts, which quickly disappear and therefore do not play a ma- jor role. Very interesting is the proposal to CIGRE [5], a sim- ple equivalent circuit (Figure 5), which may reflect the impact of adjacent lines connected to the common node of the test object. Additional parallel system provides impedance Zs, the value of which is determined by the ratio of wave impedance Zf and the number of transmis- sion lines n operating in the system that is being re- placed. ~ ~ R zs1 L zs2 R zs2 L zs1 EQUIVALENT 1EQUIVALENT 2 Transmission line model Figure 4. Simply representation of system during simula- tion. ~ ~ R zs1 X zs2 R zs2 X zs1 EQUIVALENT 1EQUIVALENT 2 Z v1 = Z f/n 1 Z v1 = Z f/n 2 Transmission line model Figure 5. Equivalent of systems with multiple transmission lines. The search for optimal equivalent circuit for electro- magnetic waveform is the most difficult task, due to the fact that there are components of high (but also low) fre- quency and the periodic component. For this reason, a replacement system must take into consideration fre- quency-dependent parameters. The search for alternative structures is possible patterns in the time and frequency domain. Mostly the method in the frequency domain is preferred. In such case, the external system is replaced by an equivalent, consisting of elements of R, L, C, whose frequency response is the same as the original system. The methods developed in the time domain these ele- ments play not important role in the equivalent. In some publications the combination of modeling in the ti me and freq ue ncy d o main ha s be en. Suc h a sol ution - the hybrid system proposed in [8], where a replacement of external system is defined in the frequency domain, and the anal ysis of the test object in the time domain. 4. Search for Structures For the analysis of searching for structures of equivalent the real system was selected and the network topology was chosen similar to 400 kV Polish transmission sys- tem. The investigation were started in simple system as shown in Figure 4 and the single phase to ground fault was simulated at the end of lines with a length of 100 km but the cur rent wa s measured at the begi nning of the line. In Figures 6 and 7 shows the comparison of the cal- culated transient current at the beginning of the line to the L1 phase, the short-circuit phase (L1 + e) at the end of the l ine. As can be seen the introduction of a parallel branch in equivalent circuit reduces the error calculated from the difference in waveforms of the real system and simpli- fied. The calculations were performed using MicroTran S P K BE A JV Z System SPM System E Sys tem BJSy st em A M Sy st em VZ ~ ~ R zs1 L zs2 R zs2 L zs1 EQUIVALENT 1EQUIVALENT 2 Transmission line model i[A] Figure 6. Current waveforms in the system without taking into account the number of lines in external system.  P. SOWA, K. ŁUSZCZ Copyright © 2013 S ciRes. EPE 1452 S P K B E A JV Z System SPM System ESystem B JSystem AZ M ~ ~ R zs1 Lzs2 Lzs2 Lzs1 EQUIVALENT 1EQUIVALENT 2 Zv1 = Zf/n Zv1 = Zf/n Tra nsmis s i on li ne model i[A] Figure 7. Current waveforms in the system taking into ac- count the l ine of n = 10 in external system. [6], and for the equivalent circuit a different number of transmission lines simplified was assumed. The best re- sults are obtained for n = 10, which corresponds to a real system connected to the line taking into account the 5 adjacent nodes. 5. Parameter Identification of Equivalent Circuit Regardless of how is determined equivalent circuit structure (in the time or frequency domain, by reduction of the original), it is always necessary to identify the pa- rameters of components which are par t of the st ruct ure. The choice of identification method - based on litera- ture reviews is very difficult because the examples have been shown for the well-defined problems associated with adapted for this purpose simulation programs. In practice, the universal methods of identification, which would be accurate enough for all solved the prob- lem has not been developed so far. All of the existing methods have advantages and disadvantages, many dif- ferent criteria are used, such as: possible convergence of numerical solutions, the number of iterations required computation time as well as the number of induced ob- jective function. In Netomac-program [7] there are three optimization methods: least squares, quasi-Newton and Powell. The search for the minimum of the objective function using the least squares method is generally numerically stable, but it req uires a long calc ulation time. I n addition, in case of large number of identified parameters, may arise similar linear relationship, which can cause non- convergence of the solution. Therefore the similar gra- dient method was implemented: instrumental variable and maximum likelihood, which are applied particularly in the regulation technology. For this re ason, the so-called “quasi-Newton” group of methods were introduced, where during simulation the numerical calculation of second derivative of objective function was avoid. Instead, they are looking for the ap- proximation of the second derivative matrix inversion (metric matrix). Quasi-Newton method cannot be directly applied to solving problems in the power system without appropri- ate modificatio ns and a dditions. There are many tech nic- al problems that cannot be ignored and which impose limitations of this method, and in some cases prevent its use. In Netomac-program the additional methods are taken to eliminate all the disadvantages of “Newto n- like”-methods (see Table 1). Among proposed in the literature so-called coupled optimization methods that do not require the calculation of derivatives, there is a group called: “gradientless” methods, based on the criterion of Powell [8], but very often the combination of the original and the modified method of Powell is used. Many additional modifications have been forced, as the quasi-Newton method; the re- strictions resulting fro m the imposed legal ranges identi- fied parameters. Table 1. Remedies for er r ors of "Newton-like" methods use d in Netomac program. REMEDIES GENERAL NETOMAC CRITER ION DOES NOT PROVIDE: search function with a minimum of restric- tions Stop changing par ameters on their limits i n each iteration use of the procedure for deter- mining of the new search direction until th e convergence of solutions values of parameters with different ran ge Scaling parameter s at t he begin ning of the ca l culation adaptive scaling impact of the time-step on convergence solu- tion 1) determining any change in the objective function, 2) dete r m ination bas e d on the va lue of the obj ec tive functi on Search procedure using interpolation rounding error during determination of the positive definiteness of metric matrix constant examination of positive definiteness of the matrix The introduction of vector correct ion problem s dur ing calculat i o n of search direction of partial derivatives procedures to avoid th e impact of rounding and t runcation errors 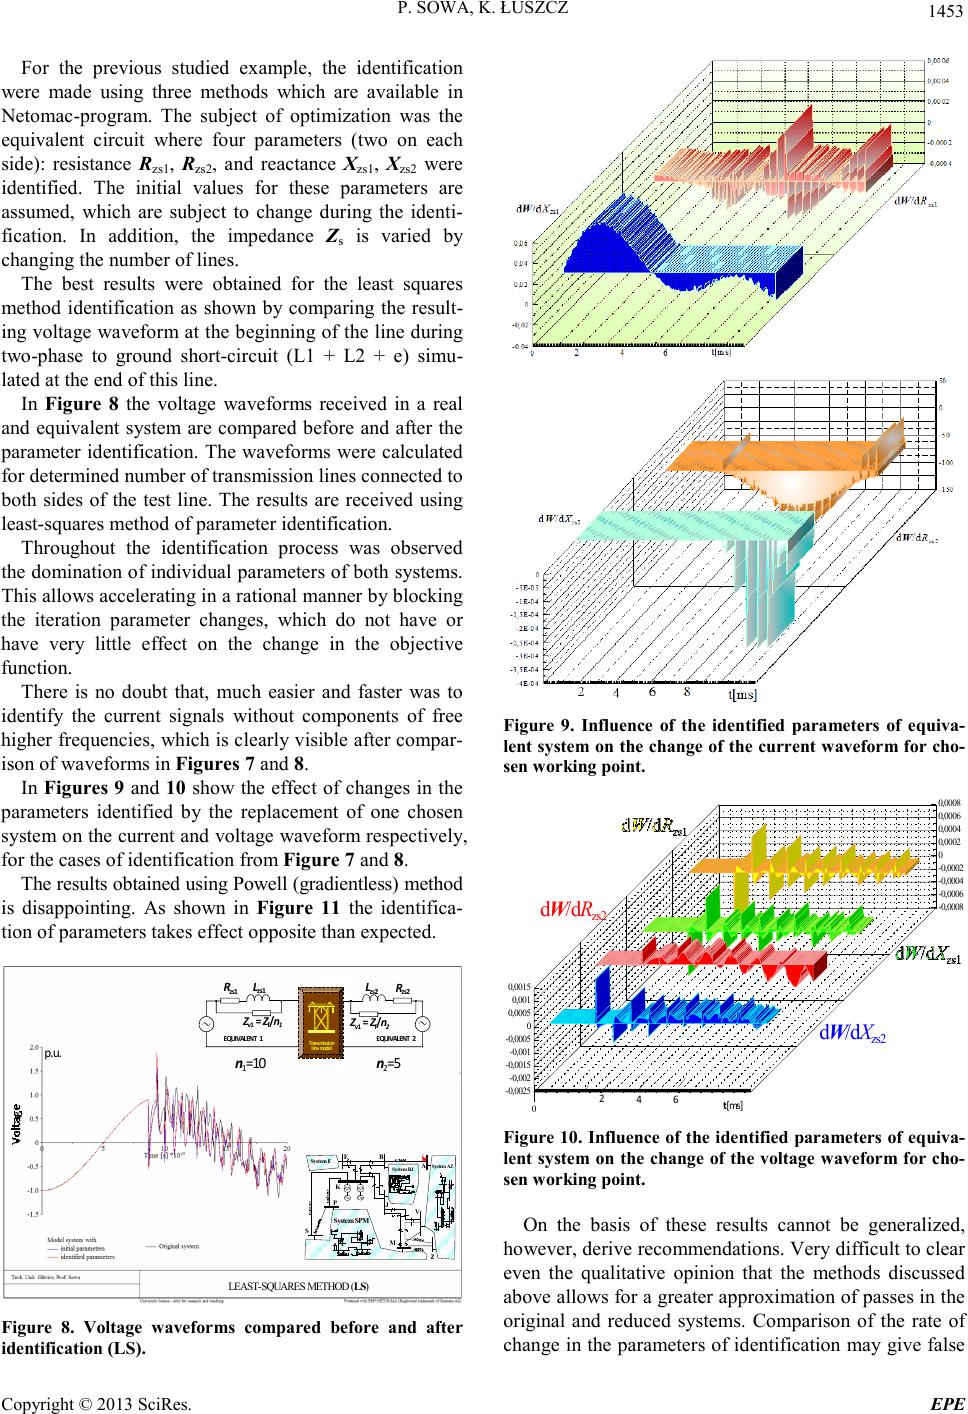 P. SOWA, K. ŁUSZCZ Copyright © 2013 S ciRes. EPE 1453 For the previous studied example, the identification were made using three methods which are available in Netomac-program. The subject of optimization was the equivalent circuit where four parameters (two on each side): resistance Rzs1, Rzs2, and reactance Xzs1, Xzs2 were identified. The initial values for these parameters are assumed, which are subject to change during the identi- fication. In addition, the impedance Zs is varied by chan ging t he number of line s . The best results were obtained for the least squares method identification as shown by comparing the result- ing vo ltage wa vefor m at t he begin ning of t he line dur ing t wo-phase to ground short-circuit (L1 + L2 + e) simu- lated at the end o f t his line. In Figure 8 the voltage waveforms received in a real and equivalent system are compared before and after the parameter identification. The waveforms were calculated for determined number of transmission lines connected to both sides of the test line. The results are received using least-squares method of parameter identification. Throughout the identification process was observed the domination o f individual parameters of both systems. This allo ws accelerating in a rational manner by blocking the iteration parameter changes, which do not have or have very little effect on the change in the objective function. There is no doubt that, much easier and faster was to identify the current signals without components of free higher frequenc ies, which is c learly visible a fter compar- ison of wave forms in Figures 7 and 8. In Figures 9 and 10 s how the effect of changes in the parameters identified by the replacement of one chosen syste m on the curre nt and vo ltage wave form re specti vel y, for the cases of identification from Figure 7 and 8. The results obtained using Powell (gradientless) met ho d is disappointing. As shown in Figure 11 the identifica- tion of parameters takes effect op p o site than expected. S P K B E A JV Z System SPM System E System BJSystem AZ M LEAST-SQUAR ES METHOD (LS) ~ ~ R zs1 L zs2 R zs2 L zs1 EQUIVALENT 1EQUIVALENT 2 Z v1 = Z f /n 1 Z v1 = Z f /n 2 Transmission li ne model n 1 =10 n 2 =5 p.u. Figure 8. Voltage waveforms compared before and after identification (LS). Figure 9. Influence of the identified parameters of equiva- lent syste m on the chang e of the curr ent w aveform for cho- sen wor king poi nt. 0 -0,0025 -0,002 -0,0015 -0,001 -0,0005 0 0,0005 0,001 0,0015 -0,0008 -0,0006 -0,0004 -0,0002 0 0,0002 0,0004 0,0006 0,0008 246t[ms] d W /dRzs2 d W /dXzs2 Figure 10. Influe nce of t he iden tified paramet ers of e quiva- lent system on the change of the voltage waveform for cho- sen wor king poi nt. On the basis of these results cannot be generalized, however, derive recommendations. Very difficult to clear even the qualitative opinion that the methods discussed above allows for a greater approximation of passes in the original and reduced systems. Comparison of the rate of change in the parameters of identification may give false 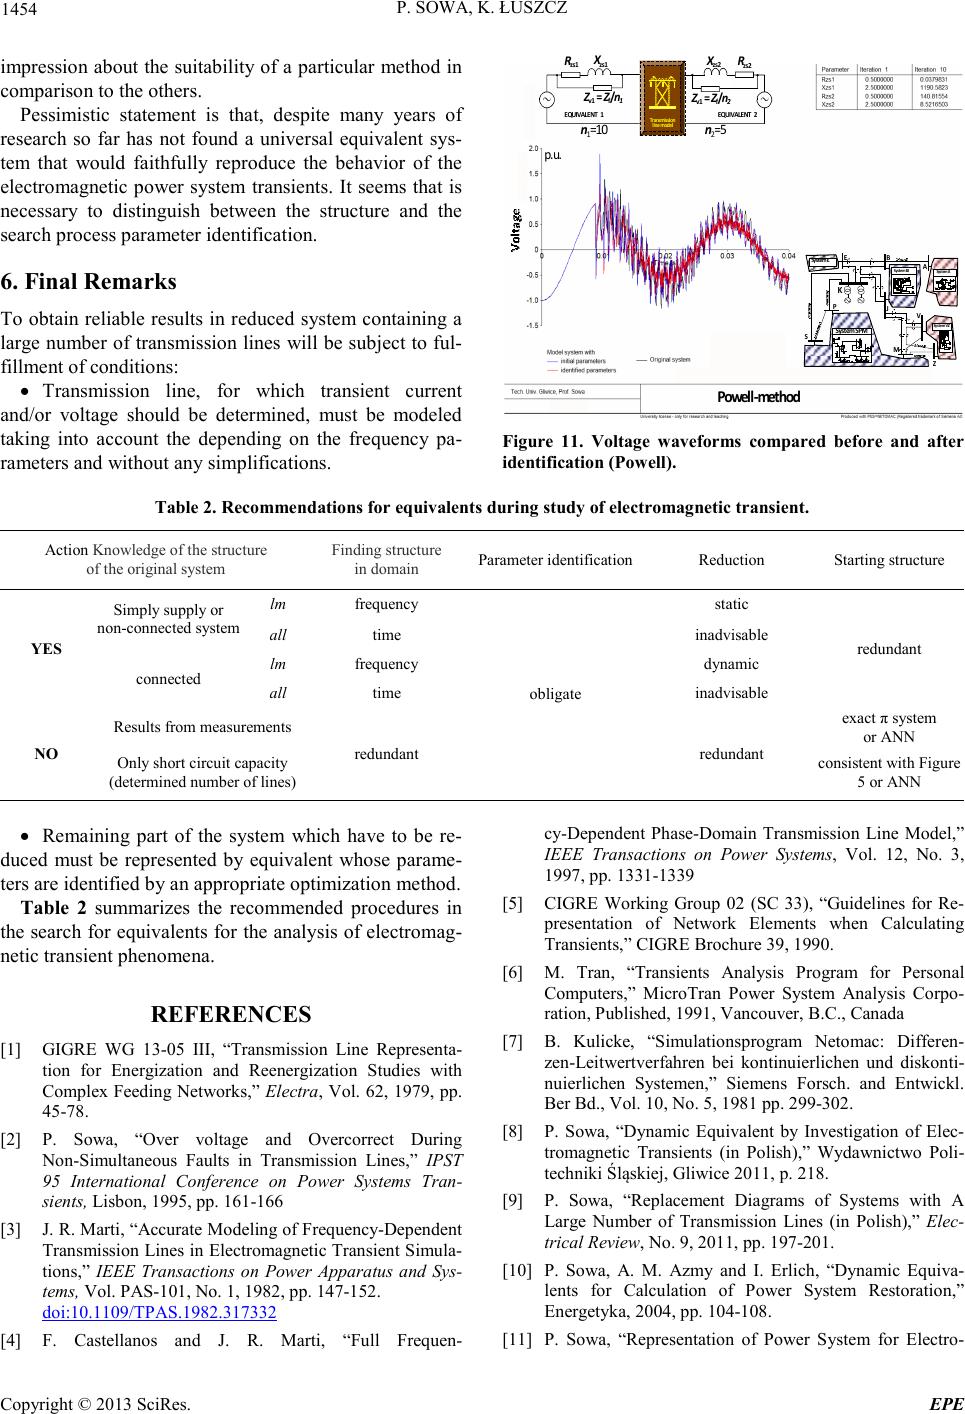 P. SOWA, K. ŁUSZCZ Copyright © 2013 S ciRes. EPE 1454 impression ab out the suitab ility of a particular method in comparison to the others. Pessimistic statement is that, despite many years of research so far has not found a universal equivalent sys- tem that would faithfully reproduce the behavior of the electromagnetic power system transients. It seems that is necessary to distinguish between the structure and the search process parameter identification. 6. Final Remarks To obtain reliable results in reduced system containing a large number o f transmission lines will be subject to f ul- fillment of conditions: • Trans mission line, for which transient current and/or voltage should be determined, must be modeled taking into account the depending on the frequency pa- rameters and withou t a ny simplifications. S P K BE A JV Z System SPM System E Sy st em B JSy st em A M Sy st em V Z ~ ~ R zs1 X zs2 R zs2 X zs1 EQUIVALENT 1EQUIVALENT 2 Z v1 = Z f /n 1 Z v1 = Z f /n 2 Transmission line model Powell- method p.u. n 1 =10 n 2 =5 Figure 11. Voltage waveforms compared before and after identification (Powell). Table 2. Recommendations for e quivalents during study of electromagnetic t ransient. Action Knowledge of the structure of the original system Finding structure in doma in Parameter identification Reducti on Starting struc ture YES Simply supply or non-connected system lm frequency obligate static redundant all time inadvisable connected lm frequency dynamic all time inadvisable NO Results f rom mea surements redundant redundant exact π system or ANN Only short circuit capacity (determined number of lines) consistent with Figure 5 or AN N • Remaining part of the system which have to be re- duced must be represented by equivalent whose parame- ters are ide ntified by an appropriate optimization method. Table 2 summarizes the recommended procedures in the search for equivalents for the analysis of electromag- netic t ransient phenomena . REFERENCES [1] GIGRE WG 13-05 III, “Transmission Line Representa- tion for Energization and Reenergization Studies with Complex Feeding Networks,” Electra, Vol. 62, 1979, pp. 45-78. [2] P. Sowa, “Over voltage and Overcorrect During Non-Simultaneous Faults in Transmission Lines,” IPST 95 International Conference on Power Systems Tran- sients, Lisbon, 1 99 5, pp. 161-166 [3] J. R. Marti, “Accurate Modeling of F requency-Dependent Transmission Lines in Electromagnetic Transient Simula- tions,” IEEE Transactions on Power Apparatus and Sys- tems, Vol. PAS-101, No. 1, 1982, pp. 147-152. doi:10.1109/TPAS.1982.317332 [4] F. Castellanos and J. R. Marti, “Full Frequen- cy-Dependent Phase-Domain Transmission Line Model,” IEEE Transactions on Power Systems, Vol. 12, No. 3, 1997, pp . 1331-1339 [5] CIGRE Working Group 02 (SC 33), “Guidelines for Re- presentation of Network Elements when Calculating Transien t s,” CIGRE Brochure 39, 1990. [6] M. Tran, “Transients Analysis Program for Personal Computers,” MicroTran Power System Analysis Corpo- ration, Published, 1991, Vancouver, B.C., Canada [7] B. Kulicke, “Simulationsprogram Netomac: Differen- zen-Leitwertverfahren bei kontinuierlichen und diskonti- nuierlichen Systemen,” Siemens Forsch. and Entwickl. Ber Bd., Vol. 10, No. 5, 1981 pp. 299-302. [8] P. Sowa, “Dynamic Equivalent by Investigation of Elec- tromagnetic Transients (in Polish),” Wydawnictwo Poli- techniki Śląskiej, Gliwice 2011, p. 218. [9] P. Sowa, “Replacement Diagrams of Systems with A Large Number of Transmission Lines (in Polish),” Elec- trical Review, No. 9, 2011, pp. 197-201. [10] P. Sowa, A. M. Azmy and I. Erlich, “Dynamic Equiva- lents for Calculation of Power System Restoration,” Energetyka, 2004, pp. 104-108. [11] P. Sowa, “Representation of Power System for Electro-  P. SOWA, K. ŁUSZCZ Copyright © 2013 S ciRes. EPE 1455 magnetic Transient Calculation,” Proceedings of World Acad emy of Scien ce, Engi neering & Technology, Vol. 30, 2008, pp . 223-226. [12] M. Kielbon and P. Sowa, “Electromagnetic Transient Components Induced by Faults in the Different Coupled Transmission Line,” Proceedings of the International Conference on Power Systems Transients, 1999, pp. 169-72. [13] A. Semlyen and M. R. Irava ni, “Frequenc y Domai n Modeling of External Systems in an Elec- tro-Magnetic Transients Program,” IEEE Transac- tions on Power Systems, Vol. 8, No. 2, 1993, pp. 527-533.doi:10.1109/59.260831 |