

Paper Menu >>
Journal Menu >>
 Energy and Power E ngineering, 2013, 5, 1367-1371 doi:10.4236/epe.2013.54B259 Published Online July 2013 (http://www.scirp.org/journal/epe) Copyright © 2013 S ciRes. EPE Analytical F ramework for Market-oriented DSR Flexibility Integration and Management Shi You, Junjie Hu, Kai Heussen, Chunyu Zhang Department of Electrical Engineering, Technical University of Denmark, Lyngby, Denmark Email: [email protected], {junhu, kh, chzh}@elektro.dtu.dk Received March, 2013 ABSTRACT Integr atio n and manage ment o f the fle xibil ity of D ema nd Side Resour ces (DS R) in to da y’s ener gy syste ms p lays a sig- nificant role in building up a sustainable society. However, the challenges of understanding, predicating and handling the uncertainties associated this subj ect to a great extent hamper its develop ment. In this paper, an analytical framework based on a multi-portfolio setup in presence of a deregulated power market is proposed to address such challenges by adopting the thinking in modern portfolio theory (MPT). A Numerical example that targets on analyzing the risk and return fo r vario us flexibility pric ing strategies are presented to illustrate some features of the framework. Keywords: Analytical Framework; Distribute d Energy Res ources; Flexiblity; Deregulate d Power Market; Mor den Portfolio Theory; Risk and Return 1. Introduction Demand side resource (DSR) refers to the geographically distributed modular power generation, consumption and energy storage systems which are located on the demand side and have the capability of altering their genera- tion/consumption pattern. The capability of DSR, also referred as flexibility, has been considered as perpetual resources with significant value of both technical and economic prospects for reducing energy consumption, improving energy efficiency, facilitating the integration of stochastic renewable, deferring the expansion of pow- er ne tworks and securi ng the po wer syste m op erati on via ancillary services’ provision, e tc . [1,2] Conventional demand response (DR) programs are normally organized by utilities, and can be split in two categories. The first group requires a fast and reliable response from DR programs, so that the DSRs are re- motely controlled by the utilities in a master-slave man- ner under bilateral agreements. These programs primarily target on medium to large size commercial and industrial DSRs and they are typically limited to interruptible DR services. A second group of DR programs is aimed at modifying the consumption of a large number of small- scale DSRs by means of economic incentives. These so called dynamic tariff programs include e.g. hourly real time pricing (RTP) and time-of-use tariffs (TOU) but also capacity pricing are used to shift consumption pat- terns and achieve better system economics with ‘dynam- ics’ in the scale of hours to years [3]. Along with the anticipated increase in penetration of DSR in the distrib ution syste ms, both the util ities and the emerging non-utility entities, e.g. Virtual Power Plants (VPPs), DSR aggre gators, intent on exploiti ng the added value of DSR flexibility [4,5]. By coordinating a fast respo nse fr o m the se lo w cost small-scale DSRs by means of various advanced control strategies, the aggregated DSR flexibility could be treated the same as other de- mand/generation resources in the context of a deregu- lated electricity market. However, integrating the DSR flexibility into the power system operation through the present deregulated market setup is challenged by a number of uncertain factors, such as • the wide range of DSR technologies with varying flexibility options; • the diversity of aggression-oriented control strate- gies with few comparisons among them due to the flex- ibility of control architectures and the vaguely defined evaluation criteria , etc.; • the multiple-choice of market products (e.g. ancil- lary services) with different risk-return spectrum and requirements. Using Denmark as a test field, several ongoing projects, e.g. iPower1, Flexpower2 and EcogridEU3, are working on understanding, predicating and handling the uncertainties associated with market-oriented DSR flex- ibility integration and management. In these projects, 1http://www.ipower-net.dk/ 2FlexP ower homepage hosted by Ea Energianalyse 3http://www.eu-ecogrid.net/  S. YOU ET AL. Copyright © 2013 S ciRes. EPE 1368 solutions are investigated from technical, economic and social perspectives, where the interests of different stakeholder s, i.e. Transmission Syste m Operato rs (TSOs), Distributio n Syste m Operators (DSO s), Balance Respon- sible Parties (BRPs, here to be considered mostly equiv- alent to ‘aggregators’) and DSR owners, are balanced in the context of the Nordic power market. In this paper, an analytical framework based on a mul- ti-portfolio setup is proposed to address such challenges by adopting the thinking in modern portfolio theory (MPT). Such a multi-portfolio framework is to analyze the risk and return for different portfolio mixes from both economic and technical perspectives. This paper is orga- nized as follows. First, a brief interpretation of this ana- lytical framework is provided in Section II. Section III presents the relevant techniques for constructing the mul- ti-portfolio setup. A numerical example that targets on analyzing the risk and return for different flexibility pricing strategies is presented in Section IV to illustrate some features of the framework, while Section V dis- cusses the chanc es and challe nges o f furt her development of this framework and conc ludes. 2. A Multi-portfolio Analitical Framework for DSR Flexibility Management and Integration A multi-portfolio based analytical framework for DSR flexibility management and integration is illustrated in Figure 1. Different stakeholders mentioned earlier can establish their interest-oriented portfolios by the use of experimental or model-based setups; meanwhile the cor- responding risk-return performance indicators can be identified or even created to satisfy the stakeholder’s individual interest. Different techniques for portfolio analysis, e.g. MPT, can be applied to performing the re- levant analysis, and the analytical results will be fed back to the stakeholders who need to decide on if further ac- tions, e.g. reconfiguring portfolio setups, alternating the performance indicators, are required. Maintain & improve portfolio setups Perform portoflio analysis Indeficiation of risk- return performance indicators stakeholders Interest-oriented multi- portfolio establishment Figure 1. Multi-portofolio based analytical framework for DSR flexibility management and integration. In general, portfolio analysis is applied to financial portfolios which are combinations of various financial products such as bonds, equities, indexes, funds, and securities. It involves quantifying the expected financial returns for different portfolios and the associated risk which is often expressed as volatility of returns. For its application to DSR flexibility management and integra- tion, new mea sure s of r isk a n d return can be defined. For instance, when a B RP with a given DSR por tfolio would like to provide frequency control ancillary services and are in doubt with the optimal combination of its control strategies, in addition to using the economic metrics, the risk associated with control performance could also be taken into account. For another example, if the local energy suppliers would like to investigate a portfolio with different electricity pricing methods, e.g. fixed-price (FP), time of use (TOU), real time price (RTP), the risk and return on customer satisfaction might also be consi- dered. In Figure 2, an illustrative example with a three- portfolio analytical setup is presented. In this setup, the uncertainties of market-oriented DSR flexibility man- agement and integration are treated in three closely re- lated po rtfolios, wherein D SR flexibilit y, control stra tegy and market-based flexibility service are grouped sepa- rately. Each portfolio can be seen as a combination of weighted assets those belong to the corresponding port- folio category, so that the return of a portfolio is the weighted combination of the assets’ returns. By changing the percentage of one/several asset in a portfolio, the peculiar risk associated with these assets and returns as- sociated with them can be characterized and analyzed in different ways. In rest of the paper, analysis and discus- sion related to using this analytical framework to facili- tate market-based DSR flexibility management and inte- gration will b e r e fer r e d to this three-portfolio setup. DSR (1)DSR (n) Control strategy (1) Control strategy (n) Portfolio of individual DSR flexibility Portfolio of control strategies for flexiblity aggregation Portfolio of market-based flexiblity products Product (1)Product (n) Figure 2. A three-portofolio establishment for DSR flexibil-  S. YOU ET AL. Copyright © 2013 S ciRes. EPE 1369 ity management and integration. It is wort hwhile to note that, t his three-portfolio -based analytical setup only illustrates a conceptual example of the generic analytical framewor k. Portfolios of ICT solu- tions, etc., can also be included. The process of investi- gating the variability of portfolio setups and the asso- ciated risk-return is analogous to the process of modeling a constrained multi-objective optimization problem and finding its optimal solutions, wherein exogenous and endogenous variables as well as different objectives have to be selected, characterized and regulated with care. 3. Establishing the Multi-portfolio Setup 3.1. Por t folio o f DSR Fl ex ib l ity The quantitative flexibility of a DSR, i.e. when and how much can its generation/consumption pattern be alter- nated, is deter mined by its local c ontrol system. In ma ny cases, this decision making process needs to consider exogenous inputs (e.g. knowledge of global and local environment) and endogenous inputs (e.g. knowledge of the DSR plant dynamics and physical constraints), as well the loca l objectives (e .g. utilit y maximization or cost minimization). The generic formulation of DSR flexibil- ity is hereby expressed, as in (1). * (,)argmax() .. () xqtux st x = Φ (1) where (,)xqt stands for the flexibility of a DSR device describing its output of active power q at time t; () ux stands for the DSR owner’s utility; () xΦ stands for all necessary constraints. This generic expression is more applicable to model- ing the flexibility of an indivi dual DSR; mean while it can be used to derive the optimal generation/consumption schedule for a certain period. When aggregated flexibili- ty over a certain amount of DSR is to be modeled, statis- tical techniques, e.g. Monte Carlo method, can be applied based on direct observations of individual DSR. It is important for the modelers to recognize the cross-time feature of DSR flexibilit y, particularl y for the DSRs with deferrable characteristics, e.g. electric vehicles, thermal storages. In other words, the DSR flexibility is not al- ways time invariant. 3.2. Portfolio of Control-strategies A control strate gy is a set of specific measures identified and implemented to achieve the control objective. For an aggregation-oriented control strategy, it is consisted of a set of important features such as control patterns (e.g. open-loop vs. close-loop), control structures (e.g. centra- lized vs. decentralized) and control algorithms (e.g. model-predictive control vs. standard PID control), which need to be carefully designed and integrated in a control s ystem architecture. One conceptual way for classifying different aggrega- tion-oriented control strategies is given in [6], wherein the two categories, namely “direct control” and “indirect control” are thoroughly introduced. The former alludes to a conventional control approach which requires DSR state information to compute reference trajectories for the DSR consumption to follow. T he latter approach is often associated with broadcasting of incentive signals (prices) with an update frequency of e.g. 5 minutes to the DSRs. Compared to the hourly dynamic tariffs, this update fre- quency is fast, and falls into the time range of generator ramps, for example. This way of classification is in line with the common- ly-understood way for classifying and modeling the con- trollabilit y of DSR, i.e. price-re sponsive a nd controllable (price signal free) as depicted in Table 1; me a nwhile, the systematical structuring for “directness” and “indirect- ness” could particularly support the active demand side management by combining the control engineering do- main with the value-oriented deliberation and addressing the integration and valuation of mixed po rtfolios of direct and indirect control as well as the further analysis of co-existence of such control-solutions with respect to overall control architecture of the power system. 3.3. Portfolio of Market Products The needs which can exploit the DSR flexibility for achieving the objectives of different stakeholders are many and they vary in requirements on volume, location, time and reliability, etc. In a liberalized market, ideally these system needs are transformed into different market products which will influence the way of flexibility inte- gration and management. For the needs relating to achieving the reliable, secure and efficient operation of electric power systems, although the market-based setups vary across countries [7], many of them have already been reflected in existing market products such as Table 1 . A brief overvi ew of eamples & te chniques for c on- trol strat egies modeling. Price-signal free Price-signal enabled Double-sided auc tion (coordination) Single-sided auction (incentive) Deterministic Conventional control, e.g. load shedding Market clearing on the ba s is of bids and offers Pricing schemes, e.g. TOU, RTP Probabilistic Aggregated TCLs a controlled by freq./temp. s et-points Game theory enabled stochastic modeling Homeostatic utility control  S. YOU ET AL. Copyright © 2013 S ciRes. EPE 1370 • Capacity products for DSOs and TSOs to ensure the resource adequacy. • Emergency products for DSOs and TSOs to han- dle emergency situations. • Ancillary service products for TSOs including frequency regulation, voltage control, short cir- cuit capacity, manual reserve, black-start, etc. • Service products for DSOs, e.g. peak shaving, voltage control, congestion management, etc. • Energy balancing products for BRPs to maintain their balanci ng responsibilitie s. Techniques for modeling and analyzing the economic performance for the electrical po wer market and its asso- ciated products based on observed market behavior have been extensively developed and implemented [8].However, in addition to investigating the economic performance of different products, it is also important to analyze the technical requirements for each market product in order to find appropriate portfolio mappings among DSR flexibility, control strategies and the market products. 4. Numerical Example In this section, a numerical example of peak load reduc- tion is presented to illustrate some features of the pro- posed analytical framework. Data of residential loads and wholesale electricity prices used in this example are pro- vided by the Danish DSO and the Danish TSO respec- tively, corresponding to the observations in 2011. Assuming in one 0.4 kV radial distribution feeder, 42 Danish single-family households constitute the electrical load of this feeder. Local DSO would li ke to investigate, comparing with the current FP scheme, how much can other different pricing schemes affect the maximum loading over the feeder system and thereby conducts the following study. The 42 households load profiles are modeled based on their previo us pe rfor mance, wher ein an a nnual cons ump- tion of 4000 kWh per household was observed under FP. Assumption about the flexibility of each household is made, i.e. the price elasticity is set as -1 while the maxi- mum flexibility of each household at each hour can be ±30% of the corresponding hourly load under FP. Regar din g the varie ty o f pr ici ng sche mes , as i n Figure 3, the hourly wholesale electricity spot is assigned as RTP; FP is assumed to be the annual average of RTP; while TOU is comprised of three periods: peak (7-9 and 17-19), shoulder (4-6, 10-16 and 20-21) and off-peak (1-3 and 22-24). For calculating the TOU, the electricity price of each period is derived by averaging the spot prices over all those hours t belong to that period cate- gor y over the year. After simulating different pricing schemes, the re- sulted daily peak load over the year under different con- text is derived as in Figure 4. Compared with the exist- ing FP, TOU to some extent lowers the daily peak while RTP intro duces b oth lo wer and hig he r p e ak va lue s d ue to the demand side e la sticity. To further analyze the three pricing schemes consti- tuted control strategy portfolio, an efficient frontier (i.e. the blue curved line) is plotted as in Fig ure 5. The con- cept of efficie nt frontiers was introduced in 1952 by No- bel Prize winner Harry Markowitz as part of the Capital Asset Pricing Model (CAPM) for portfolio theory[9].A key finding of the concep t was the benefit of diversifica- tion as depicted in Figure 5 by the random portfolio asset combinations given in red dots, while the principle shows that combing several stocks into a portfolio can decrease the overall risk below that of any individual stock while still attaining a comparable return. The efficient frontier therefore gives the lowest level of risk needed to achieve a given expected rate of return or the 1510 15 20 1510 15 20 24 0.04 0.045 0.05 0.055 0.06 0.065 0.07 0.075 T ime of day (hour ) Electricity pr ice ( eur o/ kWh) RTP FP TO U Figure 3 . Different pricing shcemes i n two consecutive days. 050100 150200 250 300 350400 10 15 20 25 30 35 40 45 50 55 60 N umber o f day Daily peak of e lect r ical load(kWh) R TP FP TOU Figure 4. Daily peak load over the year under different pricing s chemes. 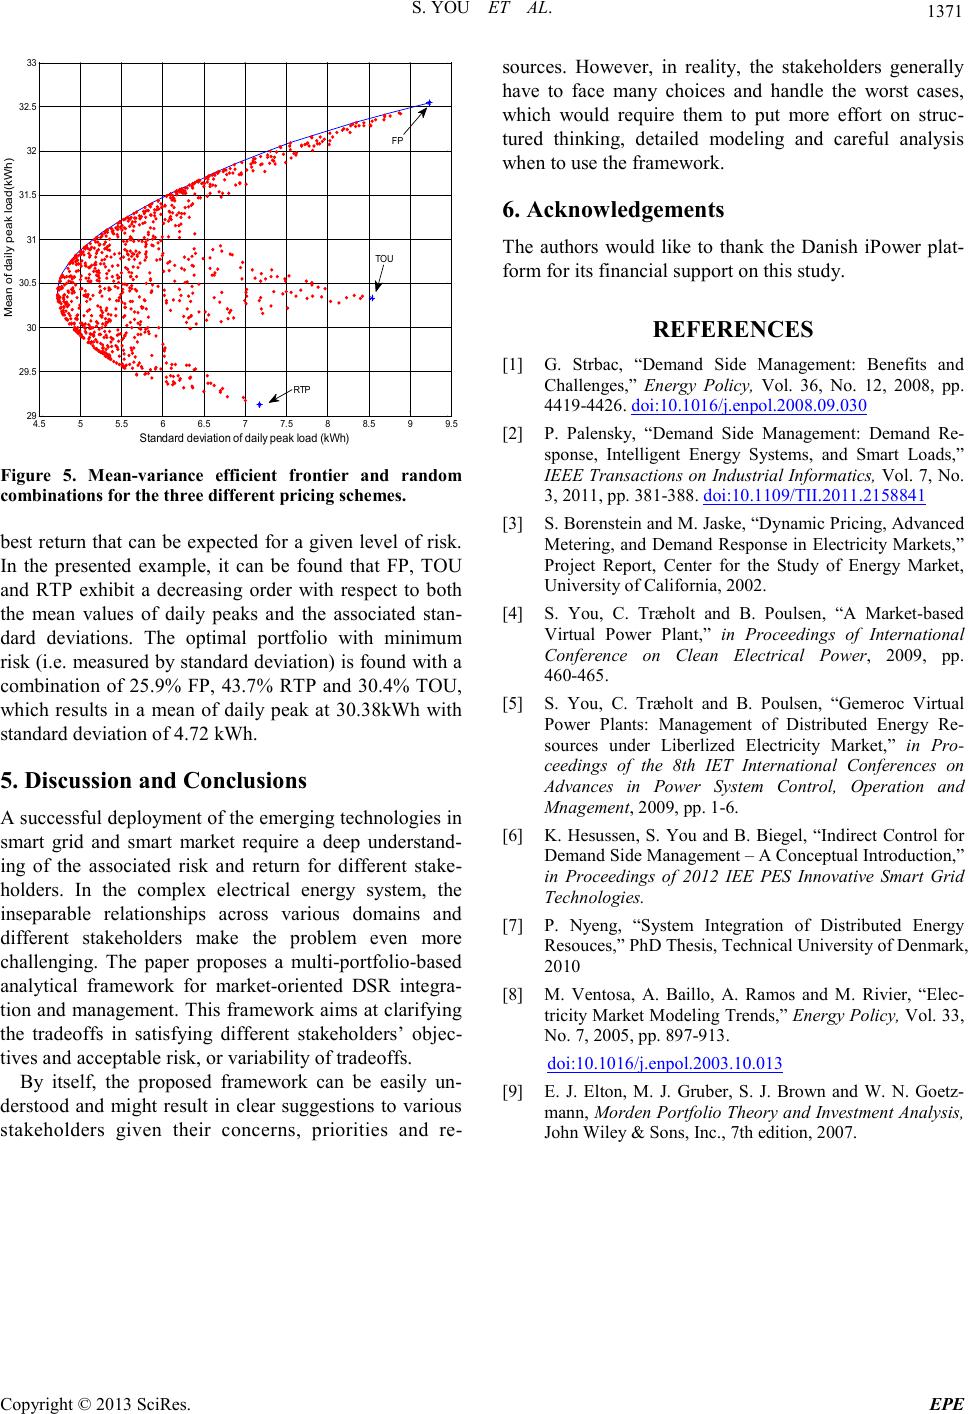 S. YOU ET AL. Copyright © 2013 S ciRes. EPE 1371 4.5 55.5 66.5 77.5 88.5 99.5 29 29.5 30 30.5 31 31.5 32 32.5 33 Stand ar d deviation of d ail y pea k load (kW h) Mean of daily peak load( kW h) FP RTP TO U Figure 5. Mean-variance efficient frontier and random combinations for the three different pricing schemes. best return that can be expected for a given level of risk. In the presented example, it can be found that FP, TOU and RTP exhibit a decreasing order with respect to both the mean values of daily peaks and the associated stan- dard deviations. The optimal portfolio with minimum risk (i.e. measured by standard deviation) is found with a combination of 25.9% FP, 43.7% RTP and 30.4% TOU, which results in a mean of daily peak at 30.38kWh with standard deviation of 4.72 kWh. 5. Discussion and Conclusions A successful deployment of the emerging technologies in smart grid and smart market require a deep understand- ing of the associated risk and return for different stake- holders. In the complex electrical energy system, the inseparable relationships across various domains and different stakeholders make the problem even more challenging. The paper proposes a multi-por tfolio-based analytical framework for market-oriented DSR integra- tion a nd mana gement. T his fra me wor k aims at cl arifyi ng the tradeoffs in satisfying different stakeholders’ objec- tives and acceptable risk, or variability of tradeoffs. By itself, the proposed framework can be easily un- derstood and might result in clear suggestions to various stakeholders given their concerns, priorities and re- sources. However, in reality, the stakeholders generally have to face many choices and handle the worst cases, which would require them to put more effort on struc- tured thinking, detailed modeling and careful analysis whe n to use the frame work. 6. Acknowled gements The authors would like to thank the Danish iPower plat- form for its financial support on thi s study. REFERENCES [1] G. Strbac, “Demand Side Management: Benefits and Challenges,” Energy Policy, Vol. 36, No. 12, 2008, pp. 4419-4426. doi:10.1016/j.enpol.2008.09.030 [2] P. Palensky, “Demand Side Management: Demand Re- sponse, Intelligent Energy Systems, and Smart Loads,” IEEE Transactions on Industrial Informatics, Vol. 7, No. 3, 2011, pp. 381-388. doi:10.1109/TII.2011.2158841 [3] S. Bo rens tein and M. Jaske, “D yn amic Pricing, Advanced Metering, and Demand Response in Electricity Markets,” Project Report, Center for the Study of Energy Market, University of California, 2002. [4] S. You, C. Træholt and B. Poulsen, “A Market-based Virtual Power Plant,” in Proceedings of International Conference on Clean Electrical Power, 2009, pp. 460-465. [5] S. You, C. Træholt and B. Poulsen, “Gemeroc Virtual Power Plants: Management of Distributed Energy Re- sources under Liberlized Electricity Market,” in Pro- ceedings of the 8th IET International Conferences on Advances in Power System Control, Operation and Mnagement, 2009, pp. 1-6. [6] K. Hesussen, S. You and B. Biegel, “Indirect Control for Demand Side Management – A Conceptual Introduction,” in Proceedings of 2012 IEE PES Innovative Smart Grid Technologies. [7] P. Nyeng, “System Integration of Distributed Energy Resouces, ” PhD Thesis, Technical University of Denmark, 2010 [8] M. Ventosa, A. Baillo, A. Ramos and M. Rivier, “Elec- tricity Market Modeling Trends,” E nergy Policy, Vol. 33, No. 7, 2005, pp. 897-913. doi:10.1016/j.enpol.2003.10.013 [9] E. J. Elton, M. J. Gruber, S. J. Brown and W. N. Goetz- mann, Morden Portfolio Theory and Investment Analysis, John Wiley & Sons, Inc., 7th edition, 2007. |