

Paper Menu >>
Journal Menu >>
 Open Journal of Geology, 2013, 3, 397-403 Published Online November 2013 (http://www.scirp.org/journal/ojg) http://dx.doi.org/10.4236/ojg.2013.37045 Open Access OJG Application of Soft Computing Methods in Predicting Evapotranspiration Afshin Honarbakhsh1, Mostafa Moradi Dashtpagerdi2*, Hassan Vagharfard3 1Faculty of Natural Resources and Earth Sciences, University of Shahrekord, Shahrekord, Iran 2Graduated Watershed Management, Organization of Natural Resources and Watershed Management, Karoon Watershed Management Office (KWMO), Shahrekord, Iran 3Faculty of Natural Resources, Hormozgan University, Bandarabbas, Iran Email: *[email protected] Received May 21, 2013; revised June 20, 2013; accepted June 28, 2013 Copyright © 2013 Afshin Honarbakhsh et al. This is an open access article distributed under the Creative Commons Attribution Li- cense, which permits unrestricted use, distribution, and reproduction in any medium, provided the original work is properly cited. ABSTRACT Exact prediction of evapotranspiration is necessary for study, design and management of irrigation systems. In this re- search, the suitability of soft computing approaches namely, fuzzy rule base, fuzzy regression and artificial neural net- works for estimation of daily evapotranspiration has been examined and the results are compared to real data measured by lysimeter on the basis of reference crop (grass). Using daily climatic data from Haji Abad station in Hormozgan, west of Iran, including maximum and minimum temperatures, maximum and minimum relative humidities, wind sp eed and sunny hours, evapotranspiration was predicted by soft computing methods. The predicted evapotranspiration values from fuzzy rule base, fuzzy linear regression and artificial neural networks show root mean square error (RMSE) of 0.75, 0.79 and 0.81 mm/day and coefficient of determination of (R2) of 0.90, 0.87 and 0.85, respectively. Therefore, fuzzy rule base approach was found to be the most appropriate method employed for estimating evapotranspiration. Keywords: Evapotranspiration; Fuzzy Rule Base; Fuzzy Regression; Artificial Neural Network 1. Introduction Evapotranspiration is one of the most important factors in agriculture and the hydrological cycle that can be in- fluenced by global warming and climatic changes [1]. The process of evapotranspiration (ET) is an important part of the water cycle and exactly estimating the value of ET is necessary for designing irrigation systems and water resources management. Accurate estimation of ET is crucial in agriculture. This is due to the fact that its over-estimation causes waste of valuable water resources and its underestimation leads to the plant moisture stress and decrease in the crop yield. Prediction methods de- veloped over the past few decades range from simple ones such as Blany-Criddle to complex ones which use physical processes like Penman compound method [2]. Penman approach used parameters such as dynamic of evaporation, intensity of net radiations and surface aero- dynamic characteristics. Montieth et al. (1965) later im- proved this method by considering the plant daily resis- tance and Penman-Montieth equation [3]. Several re- searchers studied validation of these equations [4,5]. Jenson et al. (1990) compared results of twenty of such methods with the results of lysimeters in 11 stations lo- cated in different parts of the world with various climates and concluded that in all climates the Penman-Montieth method gave the best results [6]. In recent years, soft computing methods including fuzzy rule base model (FRBM), artificial neural Networks (ANN) and also a combination of them have been employed for estimating ET. Burton et al. (2000) used ANNs and estimated daily evaporation from pan evaporation by 2044 data gathered from various places all over the world from 1992 to 1996 [7]. Input data were precipitation, temperature, relative humidity, solar irradiance and wind speed. Compared with multiple linear regressions methods such as the one proposed by Priestley-Taylor (1972), ANN provided the minimum error of 1.11 mm/day in ET estimation [8]. Odhiambo et al. (2001) compared the results from FRBM with those of Penman-Montieth [9] and Sha- yannejad et al. (2007 ) used Fuzzy linear regression (FLR) for ET estimation in Hamadan, Iran and demonstrated *Corresponding a uthor. 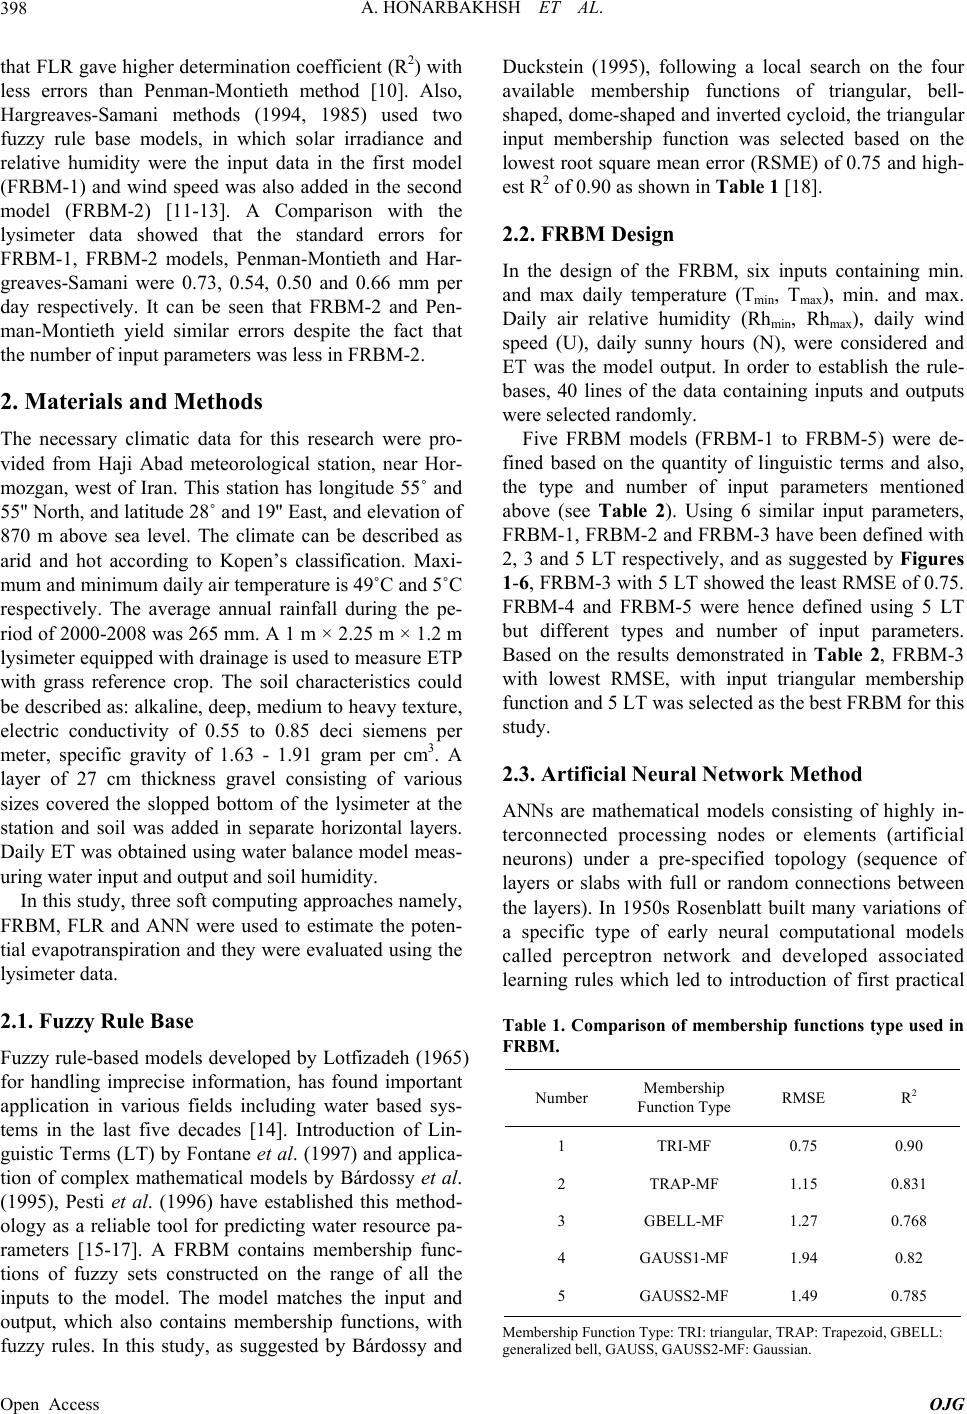 A. HONARBAKHSH ET AL. 398 that FLR gave higher determination coefficient (R2) with less errors than Penman-Montieth method [10]. Also, Hargreaves-Samani methods (1994, 1985) used two fuzzy rule base models, in which solar irradiance and relative humidity were the input data in the first model (FRBM-1) and wind speed was also added in the second model (FRBM-2) [11-13]. A Comparison with the lysimeter data showed that the standard errors for FRBM-1, FRBM-2 models, Penman-Montieth and Har- greaves-Samani were 0.73, 0.54, 0.50 and 0.66 mm per day respectively. It can be seen that FRBM-2 and Pen- man-Montieth yield similar errors despite the fact that the number of input parameters was less in FRBM-2. 2. Materials and Methods The necessary climatic data for this research were pro- vided from Haji Abad meteorological station, near Hor- mozgan, west of Iran. This station has longitude 55˚ and 55'' Nort h, and latitude 28˚ and 19'' East, and elev ation of 870 m above sea level. The climate can be described as arid and hot according to Kopen’s classification. Maxi- mum and minimum daily air temperature is 49˚C and 5˚C respectively. The average annual rainfall during the pe- riod of 2000-2008 was 265 mm. A 1 m × 2.25 m × 1.2 m lysimeter equipped with drainage is used to measure ETP with grass reference crop. The soil characteristics could be described as: alkaline, deep, medium to heavy texture, electric conductivity of 0.55 to 0.85 deci siemens per meter, specific gravity of 1.63 - 1.91 gram per cm3. A layer of 27 cm thickness gravel consisting of various sizes covered the slopped bottom of the lysimeter at the station and soil was added in separate horizontal layers. Daily ET was obtained using water balance model meas- uring water input and output and soil humidity. In this study, three soft computing approaches namely, FRBM, FLR and ANN were used to estimate the poten- tial evapotranspiration and they were evaluated using the lysimeter data. 2.1. Fuzzy Rule Base Fuzzy rule-based models developed by Lotfizadeh (1965) for handling imprecise information, has found important application in various fields including water based sys- tems in the last five decades [14]. Introduction of Lin- guistic Terms (LT) by Fontane et al. (1997) and applica- tion of complex mathematical models by Bárdossy et al. (1995), Pesti et al. (1996) have established this method- ology as a reliable tool for predicting water resource pa- rameters [15-17]. A FRBM contains membership func- tions of fuzzy sets constructed on the range of all the inputs to the model. The model matches the input and output, which also contains membership functions, with fuzzy rules. In this study, as suggested by Bárdossy and Duckstein (1995), following a local search on the four available membership functions of triangular, bell- shaped, dome-shaped and inverted cycloid, the triangular input membership function was selected based on the lowest root square mean error (RSME) of 0.75 and high- est R2 of 0.90 as shown in Tabl e 1 [18]. 2.2. FRBM Design In the design of the FRBM, six inputs containing min. and max daily temperature (Tmin, Tma x), min. and max. Daily air relative humidity (Rhmin, Rhmax), daily wind speed (U), daily sunny hours (N), were considered and ET was the model output. In order to establish the rule- bases, 40 lines of the data containing inputs and outputs were selected randomly. Five FRBM models (FRBM-1 to FRBM-5) were de- fined based on the quantity of linguistic terms and also, the type and number of input parameters mentioned above (see Table 2). Using 6 similar input parameters, FRBM-1, FRBM-2 and FRBM-3 have been defined with 2, 3 and 5 LT respectively, and as suggested by Figures 1-6, FRBM-3 with 5 LT showed the least RMSE of 0.75. FRBM-4 and FRBM-5 were hence defined using 5 LT but different types and number of input parameters. Based on the results demonstrated in Table 2, FRBM-3 with lowest RMSE, with input triangular membership function and 5 LT was selected as the best FRBM for this study. 2.3. Artificial Neural Network Method ANNs are mathematical models consisting of highly in- terconnected processing nodes or elements (artificial neurons) under a pre-specified topology (sequence of layers or slabs with full or random connections between the layers). In 1950s Rosenblatt built many variations of a specific type of early neural computational models called perceptron network and developed associated learning rules which led to introduction of first practical Table 1. Comparison of membership functions type used in FRBM. Number Membership Function Type RMSE R2 1 TRI-MF 0.75 0.90 2 TRAP-MF 1.15 0.831 3 GBELL-MF 1.27 0.768 4 GAUSS1-MF 1.94 0.82 5 GAUSS2-MF 1.49 0.785 Membership Function Type: TRI: triangular, TRAP: Trapezoid, GBELL: generaliz ed bell, GAUSS, GAUSS2-MF: Gaussian. Open Access OJG 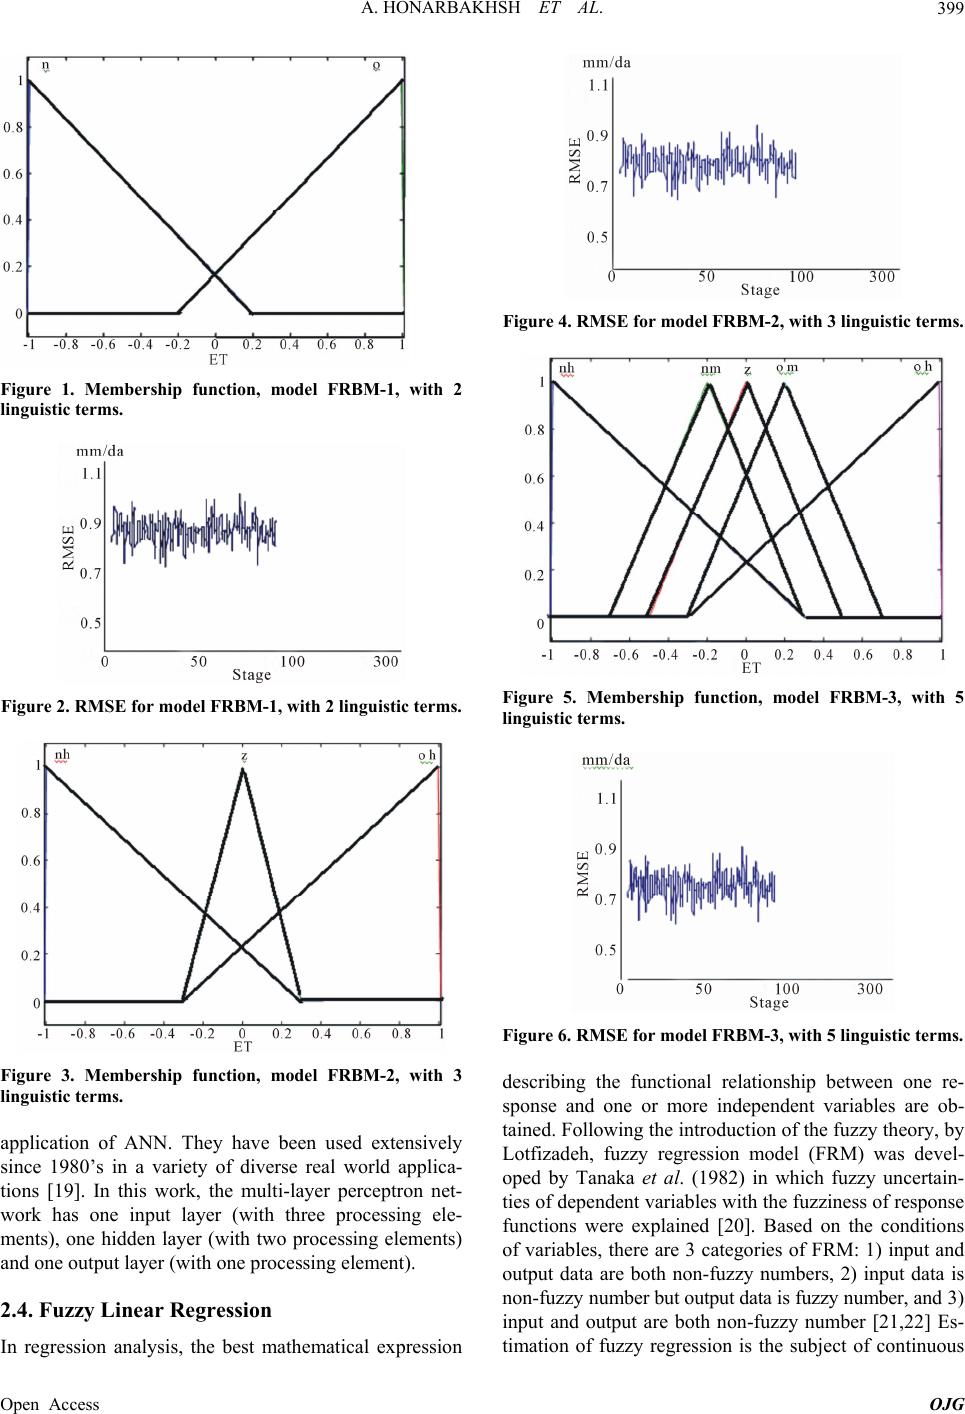 A. HONARBAKHSH ET AL. 399 Figure 1. Membership function, model FRBM-1, with 2 linguistic terms. Figure 2. RMSE for model FRBM-1, with 2 linguistic terms. Figure 3. Membership function, model FRBM-2, with 3 linguistic terms. application of ANN. They have been used extensively since 1980’s in a variety of diverse real world applica- tions [19]. In this work, the multi-layer perceptron net- work has one input layer (with three processing ele- ments), one hidden layer (with two processing elements) and one output layer (with one processing element). 2.4. Fuzzy Linear Regression In regression analysis, the best mathematical expression Figure 4. RMSE for model FRBM-2, with 3 linguistic terms. Figure 5. Membership function, model FRBM-3, with 5 linguistic terms. Figure 6. RMSE for model FRBM-3, with 5 linguistic terms. describing the functional relationship between one re- sponse and one or more independent variables are ob- tained. Following the introduction of the fuzzy theory, by Lotfizadeh, fuzzy regression model (FRM) was devel- oped by Tanaka et al. (1982) in which fuzzy uncertain- ties of dependent variables with the fuzziness of response functions were explained [20]. Based on the conditions of variables, there are 3 categories of FRM: 1) input and output data are both non-fuzzy numbers, 2) input data is non - f uzzy nu mber but output data is fuzzy number, and 3) input and output are both non-fuzzy number [21,22] Es- timation of fuzzy regression is the subject of continuous Open Access OJG 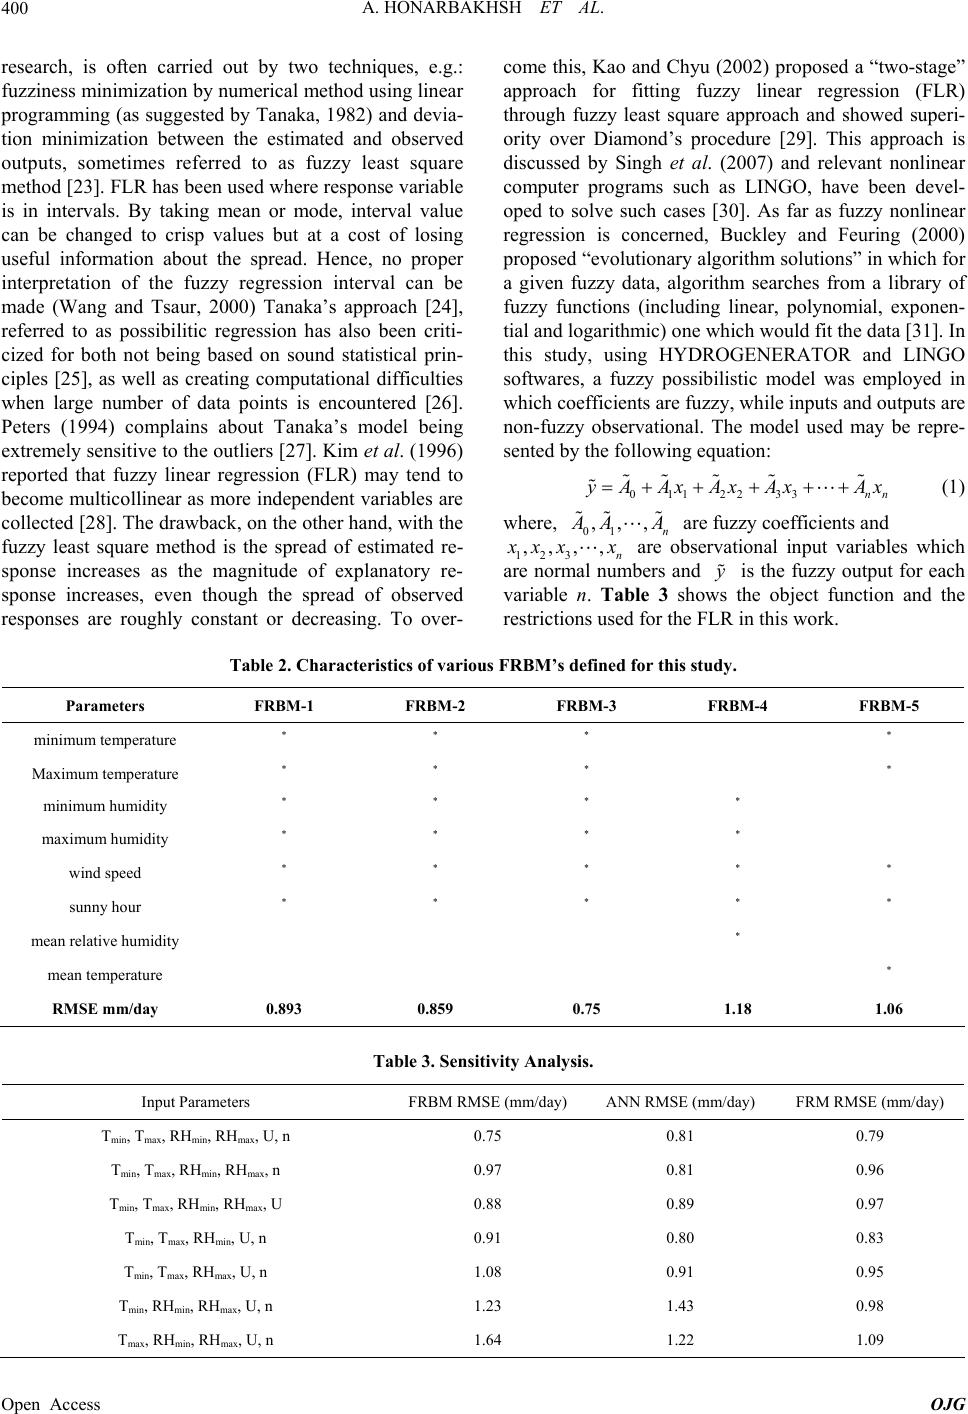 A. HONARBAKHSH ET AL. Open Access OJG 400 come this, Kao and Chyu (200 2) proposed a “two-stage” approach for fitting fuzzy linear regression (FLR) through fuzzy least square approach and showed superi- ority over Diamond’s procedure [29]. This approach is discussed by Singh et al. (2007) and relevant nonlinear computer programs such as LINGO, have been devel- oped to solve such cases [30]. As far as fuzzy nonlinear regression is concerned, Buckley and Feuring (2000) proposed “evolutionary algorithm solutions” in which for a given fuzzy data, algorithm searches from a library of fuzzy functions (including linear, polynomial, exponen- tial and logarithmic) one which would fit the data [31]. In this study, using HYDROGENERATOR and LINGO softwares, a fuzzy possibilistic model was employed in which coefficients are fuzzy, while inputs and outputs are non-fuzzy observational. The model used may be repre- sented by the following equation: research, is often carried out by two techniques, e.g.: fuzziness minimization by numerical method using linear programming (as suggested by Tanaka, 1982) and devia- tion minimization between the estimated and observed outputs, sometimes referred to as fuzzy least square method [23]. FLR has been used where response variable is in intervals. By taking mean or mode, interval value can be changed to crisp values but at a cost of losing useful information about the spread. Hence, no proper interpretation of the fuzzy regression interval can be made (Wang and Tsaur, 2000) Tanaka’s approach [24], referred to as possibilitic regression has also been criti- cized for both not being based on sound statistical prin- ciples [25], as well as creating computational difficulties when large number of data points is encountered [26]. Peters (1994) complains about Tanaka’s model being extremely sensitive to the outliers [27]. Kim et al. (199 6) reported that fuzzy linear regression (FLR) may tend to become multicollinear as more independ ent variables are collected [28]. The drawback, on the other hand, with the fuzzy least square method is the spread of estimated re- sponse increases as the magnitude of explanatory re- sponse increases, even though the spread of observed responses are roughly constant or decreasing. To over- 0112233nn y AAxAxAxAx (1) where, 01 ,,, n A AA ,, n are fuzzy coefficients and 123 ,, x xx x are observational input variables which are normal numbers and y is the fuzzy output for each variable n. Table 3 shows the object function and the restrictions used for the FLR in this work. Table 2. Characteristics of various FRBM’s de fined for this study. Parameters FRBM-1 FRBM-2 FRBM-3 FRBM-4 FRBM-5 minimum temperature * * * * Maximum temperature * * * * minimum humidity * * * * maximum humidity * * * * wind speed * * * * * sunny hour * * * * * mean relative humidity * mean temperature * RMSE mm/day 0.893 0.859 0.75 1.18 1.06 Table 3. Sensitivity Analysis. Input Parameters FRBM RMSE (mm/day) ANN RMSE (mm/day) FRM RMSE (mm/day) Tmin, Tmax, RHmin , RHmax, U, n 0.75 0.81 0.79 Tmin, Tmax, RHmin , RHmax, n 0.97 0.81 0.96 Tmin, Tmax, RHmin , RHmax, U 0.88 0.89 0.97 Tmin, Tmax, RHmin , U, n 0.91 0.80 0.83 Tmin, Tmax, RHmax , U, n 1.08 0.91 0.95 Tmin, RHmin, RHma x, U, n 1.23 1.43 0.98 Tmax, RHmin, RHmax, U, n 1.64 1.22 1.09 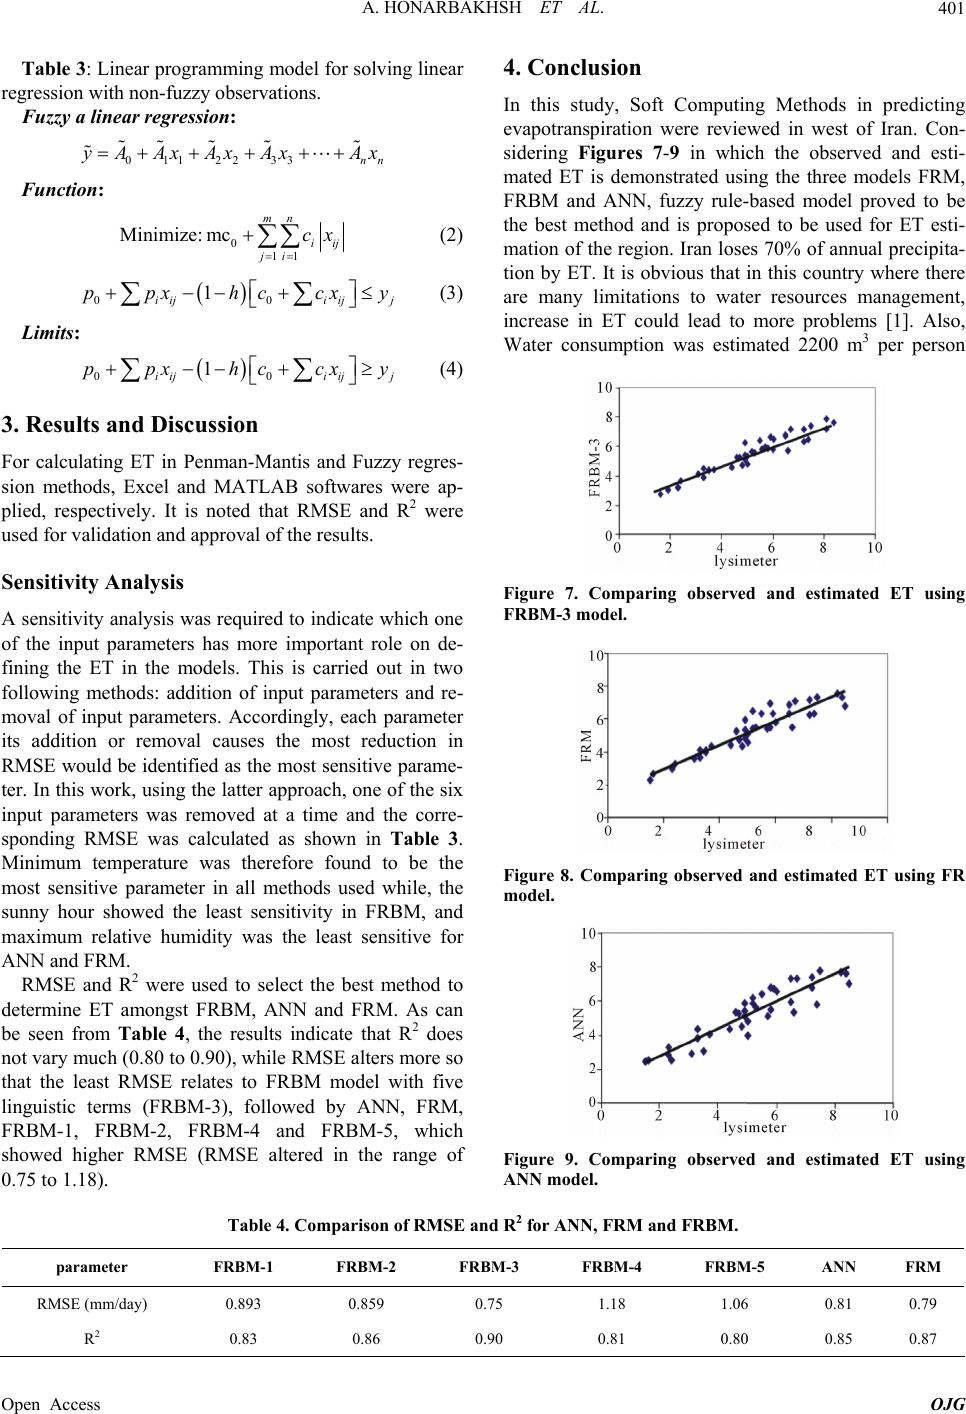 A. HONARBAKHSH ET AL. 401 Table 3: Liodel for solving linear near programming m regression with non-fuzzy observations. Fuzzy a linear regression: 0112233nn y AAxAx Ax Ax Function: 011 Minimize: mcmn iij ji cx (2) y (3) Limits: y (4) 3. Results and Discussion antis and Fuzzy regres- as required to indicate which one ft Computing Methods in predicting 00 1 iijiij j ppx hccx 00 1 iijiij j ppx hccx For calculating ET in Penman-M sion methods, Excel and MATLAB softwares were ap- plied, respectively. It is noted that RMSE and R2 were used for validation and approval of the results. Sensitivity Analysis A sensitivity analysis w of the input parameters has more important role on de- fining the ET in the models. This is carried out in two following methods: addition of input parameters and re- moval of input parameters. Accordingly, each parameter its addition or removal causes the most reduction in RMSE would be identified as the most sensitive parame- ter. In this work, using the latter approach, one of the six input parameters was removed at a time and the corre- sponding RMSE was calculated as shown in Tab le 3. Minimum temperature was therefore found to be the most sensitive parameter in all methods used while, the sunny hour showed the least sensitivity in FRBM, and maximum relative humidity was the least sensitive for ANN and FRM. RMSE and R2 were used to select the best method to determine ET amongst FRBM, ANN and FRM. As can be seen from Table 4, the results indicate that R2 does not vary much (0.80 to 0.90), while RMSE alters more so that the least RMSE relates to FRBM model with five linguistic terms (FRBM-3), followed by ANN, FRM, FRBM-1, FRBM-2, FRBM-4 and FRBM-5, which showed higher RMSE (RMSE altered in the range of 0.75 to 1.18). 4. Conclusion In this study, So evapotranspiration were reviewed in west of Iran. Con- sidering Figures 7-9 in which the observed and esti- mated ET is demonstrated using the three models FRM, FRBM and ANN, fuzzy rule-based model proved to be the best method and is proposed to be used for ET esti- mation of the region. Ir an loses 70% of annu al precipita- tion by ET. It is obvious that in this country where there are many limitations to water resources management, increase in ET could lead to more problems [1]. Also, Water consumption was estimated 2200 m3 per person Figure 7. Comparing observed and estimated ET using FRBM-3 model. Figure 8. Comparing observed and estimated ET using FR model. Figure 9. Comparing observed and estimated ET using Table 4. Comparison of RMSE andRM and FRBM. parameter F-5 ANN FRM ANN model. R2 for ANN, F RBM-1 FRBM-2 FRBM-3 FRBM-4 FRBM RMy) SE (mm/da 0.893 0.859 0.75 1.18 1.06 0.81 0.79 R2 0.83 0.86 0.90 0.81 0.80 0.85 0.87 Open Access OJG 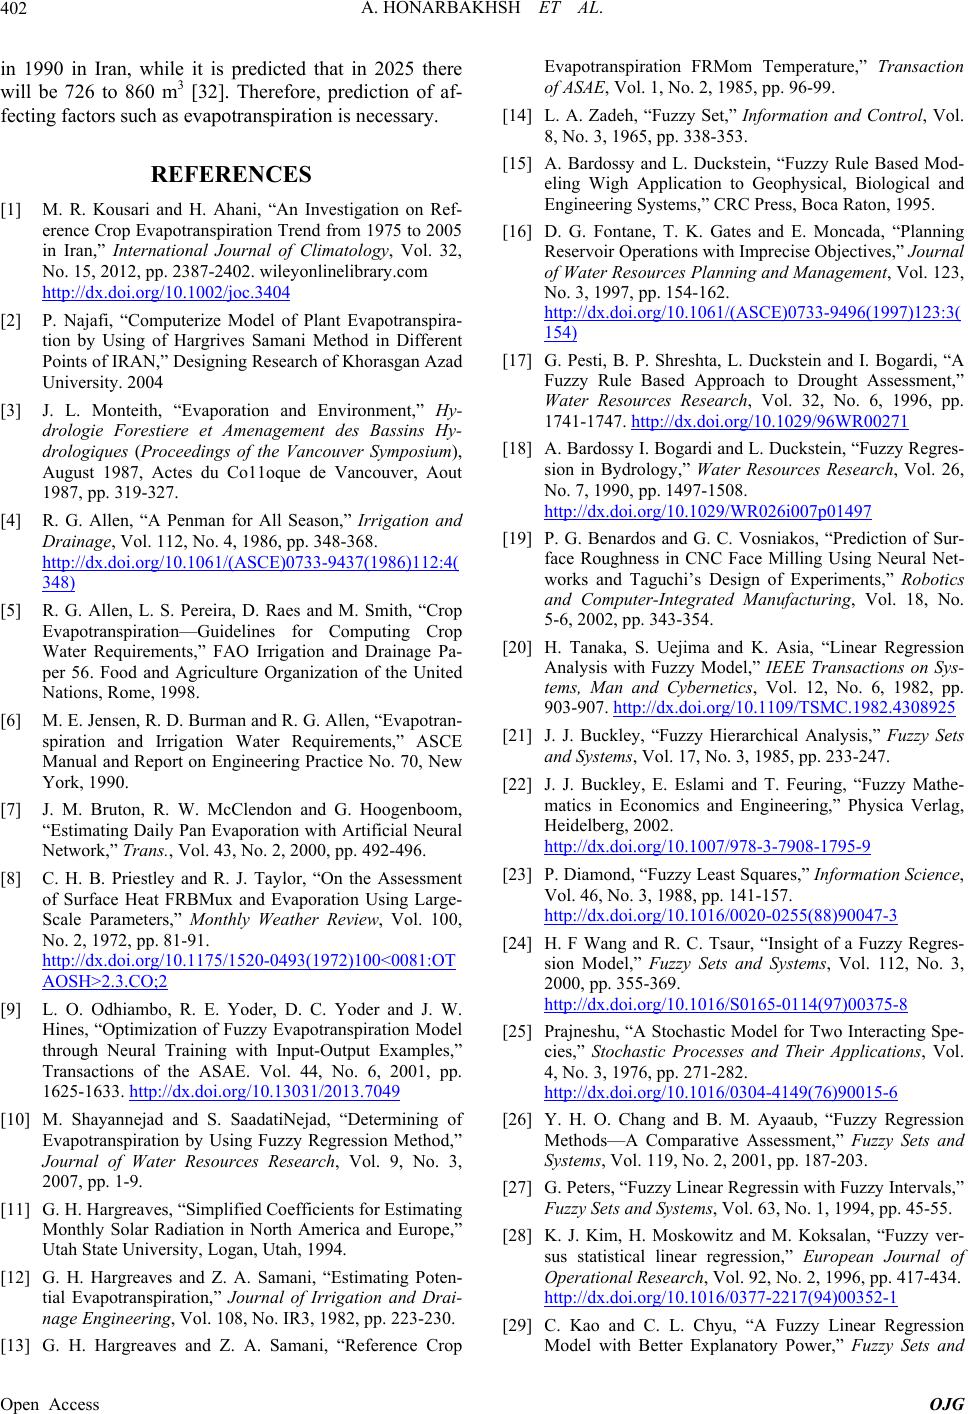 A. HONARBAKHSH ET AL. 402 in 1hile it isicted that25 there will be 726 to 860 m3 [32]. Therefore, prediction of af- cting fac such as evappiration isssary. [1] M. R. Kousari and H. Ahani, “An Investigation on Ref- erence Crop Efrom 1975 to 2005 in Iran,” Inter matology, Vol. 32, 990 in Iran, w pred in 20 fe torsotrans nece REFERENCES vapotranspiration Trend national Journal of Cli No. 15, 2012, pp. 2387-2402. wileyonlinelibrary.com http://dx.doi.org/10.1002/joc.3404 [2] P. Najafi, “Computerize Model of Plant Evapotranspira- tion by Using of Hargrives Samani Method in Differen Points of IRAN,” Designing Researt ch of Khorasgan Azad eedings of the Vancouver Symposium), 061/(ASCE)0733-9437(1986)112:4( University. 2004 [3] J. L. Monteith, “Evaporation and Environment,” Hy- drologie Forestiere et Amenagement des Bassins Hy- drologiques (Proc August 1987, Actes du Co11oque de Vancouver, Aout 1987, pp. 319-327. [4] R. G. Allen, “A Penman for All Season,” Irrigation and Drainage, Vol. 112, No. 4, 1986, pp. 348-368. http://dx.doi.org/10.1 348) [5] R. G. Allen, L. S. Pereira, D. Raes and M. Smit Evapotranspiration—Guidelines for Computing Crop Water h, “ Requirements,” FAO Irrigation and Drainage Pa- Engineering Practice No. 70, New ans., Vol. 43, No. 2, 2000, pp. 492-496. Crop per 56. Food and Agriculture Organization of the United Nations, Rome, 1998. [6] M. E. Jensen, R. D. Burman and R. G. Allen, “Evapotran- spiration and Irrigation Water Requirements,” ASCE Manual and Report on York, 1990. [7] J. M. Bruton, R. W. McClendon and G. Hoogenboom, “Estimating Daily Pan Evaporation with Artificial Neural Network,” Tr [8] C. H. B. Priestley and R. J. Taylor, “On the Assessment of Surface Heat FRBMux and Evaporation Using Large- Scale Parameters,” Monthly Weather Review, Vol. 100, No. 2, 1972, pp. 81-91. http://dx.doi.org/10.1175/1520-0493(1972)100<0081:OT AOSH>2.3.CO;2 [9] L. O. Odhiambo, R. E. Hines, “Optimization of Fuzzy Evapotranspiration Model through Neural T Yoder, D. C. Yoder and J. W. raining with Input-Output Examples,” Transactions of the ASAE. Vol. 44, No. 6, 2001, pp. 1625-1633. http://dx.doi.org/10.13031/2013.7049 [10] M. Shayannejad and S. SaadatiNejad, “Determining of Evapotranspiration by Using Fuzzy Regression Method,” Journal of Water Resources Research, Vol. 9, No. 3, ersity, Logan, Utah, 1994. [13] G. H. Hargreaves and Z. A. Samani, “Reference Crop Evapoiration FRTemper” Tra on of ASAE, 1985, pp. 96-99. 4] L. A. Z, “Fuzzy Seformatio Contol. ives,” Journal 2007, pp. 1-9. [11] G. H. Hargreaves, “Simplified Coefficients for Estimating Monthly Solar Radiation in North America and Europe,” Utah State Univ [12] G. H. Hargreaves and Z. A. Samani, “Estimating Poten- tial Evapotranspiration,” Journal of Irrigation and Drai- nage Engineering, Vol. 108, No. IR3, 1982, pp. 223-230. transp , Vol. 1, No. 2Mom ature,nsacti [1 adeh t,” Inn androl, V 8, No. 3, 1965, pp. 338-353. [15] A. Bardossy and L. Duckstein, “Fuzzy Rule Based Mod- eling Wigh Application to Geophysical, Biological and Engineering Systems,” CRC Press, Boca Raton, 1995. [16] D. G. Fontane, T. K. Gates and E. Moncada, “Planning Reservoir Operations with Imprecise Object of Water Resources Planning and Management, Vol. 123, No. 3, 1997, pp. 154-162. http://dx.doi.org/10.1061/(ASCE)0733-9496(1997)123:3( 154) [17] G. Pesti, B. P. Shreshta, L. Duckstein and I. Bogardi, “A Fuzzy Rule Based Approach to Drought Assessment,” Water Resources Research, Vol. 32, No. 6, 1996, pp. 1741-1747. http://dx.doi.org/10.1029/96WR00271 [18] A. Bardossy I. Bogardi and sion in Bydrology,” Water Resources Research, Vol. 26, No. 7, L. Duckstein, “Fuzzy Regres- 1990, pp. 1497-1508. http://dx.doi.org/10.1029/WR026i007p01497 [19] P. G. Benardos and G. C. Vosniakos, “Prediction of Sur- face Roughness in CNC Face Milling Using Neural Net- works and Taguchi’s Design of Experiments,” Robotics Asia, “Linear Regression ons on Sys- and Computer-Integrated Manufacturing, Vol. 18, No. 5-6, 2002, pp. 343-354. [20] H. Tanaka, S. Uejima and K. Analysis with Fuzzy Model,” IEEE Transacti tems, Man and Cybernetics, Vol. 12, No. 6, 1982, pp. 903-907. http://dx.doi.org/10.1109/TSMC.1982.4308925 [21] J. J. Buckley, “Fuzzy Hierarchical Analysis,” Fuzzy Sets and Systems, Vol. 17, No. 3, 1985, pp. 233-247. [22] J. J. Buckley, E. Eslami and T. Feuring, “Fuzzy Mathe- matics in Economics and Engineering,” Physica Verlag, Heidelberg, 2002. http://dx.doi.org/10.1007/978-3-7908-1795-9 [23] P. Diamond, “Fuzzy Least Squares,” Information Science, Vol. 46, No. 3, 1988, pp. 141-157. http://dx.doi.org/10.1016/0020-0255(88)90047-3 5-8 [24] H. F Wang and R. C. Tsaur, “Insight of a Fuzzy Regres- sion Model,” Fuzzy Sets and Systems, Vol. 112, No. 3, 2000, pp. 355-369. http://dx.doi.org/10.1016/S0165-0114(97)0037 ir Applications, Vol. [25] Prajneshu, “A Stochastic Model for Two Interacting Spe- cies,” Stochastic Processes and The 4, No. 3, 1976, pp. 271-282. http://dx.doi.org/10.1016/0304-4149(76)90015-6 [26] Y. H. O. Chang and B. M. Ayaaub, “Fuzzy Regression Methods—A Comparative Assessment,” Fuzzy Sets and Systems, Vol. 119, No. 2, 2001, pp. 187-203. [27] G. Peters, “Fuzzy Li near Re gressi n wit h Fuzzy Inte rvals, ” Fuzzy Sets and Systems, Vol. 63, No. 1, 1994, pp. 45-55. [28] K. J. Kim, H. Moskowitz and sus statistical linear regression,” European Journal of M. Koksalan, “Fuzzy ver- Operational Research, Vol. 92, No. 2, 1996, pp. 417-434. http://dx.doi.org/10.1016/0377-2217(94)00352-1 [29] C. Kao and C. L. Chyu, “A Fuzzy Linear Regression Model with Better Explanatory Power,” Fuzzy Sets and Open Access OJG  A. HONARBAKHSH ET AL. 403 Systems, Vol. 126, No. 3, 2002, pp. 401-09. http://dx.doi.org/10.1016/S0165-0114(01)00069-0 [30] R. K. Singh, Prajneshu and H. Ghosh, “A TWO-Stage Fizzy Least Squares Procedure for Fitting von Bertalanffy Growth Model,” 2007. [31] J. J. Buckey and T. Feuring, “Universal Approximators for Fuzzy Functions,” Fuzzy Set and Systems, Vol. 113, No. 3, 2000, pp. 411-415. [32] A. A. Alesheikh, M. J. Soltani, N. Nouri and M. Khalil- zadeh, “Land Assessment for Flood Spreading Site Selec- tion Using Geospatial Information System,” International Journal of Environmental Science and Technology, Vol. 5, No. 4, 2008, pp. 455-462. http://dx.doi.org/10.1007/BF03326041 Open Access OJG |