

Paper Menu >>
Journal Menu >>
 Psychology 2011. Vol. 2, No. 1, 49-52 Copyright © 2011 SciRes. DOI:10.4236/psych.2011.21008 Strong Words or Moderate Words: A Comparison of the Reliability and Validity of Responses on Attitude Scales Bruce B. Frey, Lisa M. Edwards Department of Psychology and Research in Education School of Education University of Kansas, Lawrence, Kansas, USA; Department of Counselor Education and Counseling Psychology, Marquette University, Milwaukee, USA. Email: [email protected] Received July 1st, 2010; revised November 28th, 2010; accepted December 10th, 2010. A common assumption in attitude measurement is that items should be composed of strongly worded statements. The presumed benefit of strongly worded statements is that they produce more reliable and valid scores than statements with moderate or weak wording. This study tested this assumption using commonly accepted criteria for reliability and validity. Two forms of attitude scales were created - a strongly worded form and a moderately worded form - measuring two attitude objects - attitude towards animal experimentation and attitude towards going to the movies. Different formats were randomly administered to samples of graduate students. There was no superiority found for strongly worded statements over moderately worded statements. The only statistically significant difference was found between one pair of validity coefficients (r = 0.69; r = 0.15; Z = 2.60, p ≤ 0.01) and that was in the direction opposite from expected, favoring moderately worded items over strongly worded items (total scores correlated with a general behavioral item). Keywords: Attitude Scales, Reliabilty, Validity Introduction Teachers of psychological measurement, as well as authors of textbooks in these areas, often make recommendations as to the type of wording that is best when composing items for atti- tude scales (Fink, 1995; Fowler, 1995; Leedy, 1997; Mangione, 1995; Shuman & Presser, 1981). One rule-of-thumb that seems to have arisen is that attitude scales made of strongly worded statements - “I love”, “I hate”, “always” - will produce more reliable and valid scores than scales made of moderately worded statements - “I like”, “I dislike”, “sometimes”. Posi- tions taken in the literature which suggest that strongly-worded statements are best include advice to use precise wording and avoid potentially vague adverbs (Bourque & Fielder, 1995), recommendations to choose adverbs that have agreed upon meaning (Best & Kahn, 1989), and suggestions to use clearly favorable or clearly unfavorable wording (Henerson, Morris, & Fitz-Gibbon, 1987). In our experience, it is sometimes assumed that strongly worded statements will elicit more valid or reliable responses. This is certainly not an unreasonable assumption. Along with textbook authors and instructors providing guidelines consistent with this assumption, common sense supports this view as well. Some reasonable beliefs which support the assumption include: 1. Strong statements are more easily understood. At the least, there is greater agreement across respondents as to the meaning of strong statements. We all may agree on what “I hate exercise” means, but not agree about what “I dislike exercise” means. 2. There is more clarity about what specific answer options like “strongly agree” mean when responding to a strong statement than when responding to a moderate statement. For example, what does it mean to strongly agree that you “sort of like cotton candy?” Furthermore, imagine that you love cotton candy. Should you strongly disagree with the statement? Moderately disagree? Moderately agree? Strongly agree? 3. Strongly worded statements more easily “awaken” pre- viously unperceived feelings. 4. Strong statements create greater variability in responses and greater variability promotes higher reliability. Regardless of the implicit or explicit hypotheses as to why wording makes a difference, few studies have tested the basic assumption that the strength of wording in attitude statements does, in practice, make a difference. We were able to locate studies examining the psychometric effects of negative or posi- tive wording in stems or answer options (Barnette, 2000; Her- che & Engelland, 1996; Schmitt & Stuits, 1985; Wong, Rind- fleisch, & Burroughs, 2003), as well as the effects of Likert or Thurstone or other scaling methods (Roberts, Laughlin & Wedell, 1999; Seiler & Hough, 1970). No studies, however, were found that tested the particular view that strongly worded attitude statements are superior. The present study explores whether the strength of attitude statements affects the reliability or validity of the scores on attitude scales. Attitude Measurement The most common methods of measuring attitude require that subjects agree or disagree with statements that reflect a  B. B. FREY ET AL. 50 particular attitude. A summing of those responses produces a total score which is meant to reflect an attitude. Historically, two formats - one proposed by Likert (1932) and one proposed by Thurstone (1928) have been most commonly used. Among more recent developments is Andrich’s “unfolding” perspective (Andrich, 1996; Andrich & Styles, 1998) which addresses the typically poor relationship between measured attitude and be- havior, and other theoretical validity problems, by considering whether traditional attitude measurement methods do a poor job of precisely placing individuals on an attitude continuum. As the two most popular procedures, Likert and Thurstone methods have often been compared (Roberts, Laughlin & We- dell, 1999; Ferguson, 1941) and a summary of their strengths and weaknesses has found that the Likert method tends to be more reliable and can efficiently produce reliable scores using fewer items (Seiler & Hough, 1970). For these reasons, and, undoubtedly, because it requires fewer steps to develop scales, Likert is an extremely common attitude measurement format, and, consequently, was the format chosen for this study. In our experience, the Likert-type structure for attitude measurement is ubiquitous and the predominate approach. Reliability Classical test theory presents reliability as a function of the proportion of true score variance to observed score variance (Crocker & Algina, 1986). A variety of numbers can be calcu- lated which represent reliability of scores. When scales are intended to measure a single dimension, internal consistency in responses across items, as reflected by an index such as Cron- bach’s coefficient alpha, is an appropriate measure of reliability (Cronbach, 1951). Because Likert-type scales are meant to reflect a single dimension (Likert, 1932), coefficient alphas of two Likert scales can be compared in order to test hypotheses that one scale is more reliable than the other. An additional indicator of reliability, both theoretically and in calculating statistics to represent reliability, is the overall variability of the scores from a scale. Though it does not provide a scaled index of reliability, greater variability increases the likelihood of ob- served scores matching true scores (its theoretical benefit), and often results in larger coefficient alphas and correlations (its empirical benefit). Variance, then, can be compared between two similar scales as an additional indication of which scale is more reliable. Validity The validity of unidimensional attitude scales can be tested through a variety of methods. One way to produce construct evidence of validity for such scales’ scores is to correlate scores on the scale in question with scores on some other attitude scale designed to measure the same or similar attitude. One could also compare professed attitude with some behavior which might reasonably be expected to result from the attitude. The former method usually results in a stronger relationship than the latter, but both are typically acceptable as sources of validity evidence for attitude scales. Though neither method is enough to establish validity for an attitude scale, the present study at- tempts only to compare these correlations to see if there is any evidence that one scale is “more valid” than another, not estab- lish the independent validity of the scales’ scores. Because these procedures are commonly used in published research and taught in measurement courses as evidence of validity, they were cho- sen for the study as appropriate methods for comparison. Methods Participants The subjects were 65 schools of education graduate students at a large Midwestern university who were 60% female with a mean age of 30. The judges used during the item categorization process were an additional 20 graduate students from the school. Procedures Two sets of 33 attitude statements were created. One set re- flected attitude towards a light-hearted topic, “Going to the Movies”. The other set reflected attitude towards a more serious topic, “Medical Experiments on Animals”. These two topics were chosen because they represent two common uses of atti- tude scaling in social sciences - research on controversial issues and measurement of consumer or participant preferences. Statements were written to include a variety of attitude strengths and directions. Two scales were produced for each of the two topics. One scale on each topic measured attitude by using strongly worded items while the other scale used moderately worded items. To identify items which were “strongly worded” and items which were “moderately worded”, the Thurstone method was used (Thurstone, 1928). The Thurstone methodology was used here only to identify which items were strongly worded and which were moderately worded. All the attitude measures that were eventually produced followed Likert scaling and scoring methods. The Thurstone procedure provides all statements to a group of judges. Judges sort items into different piles, or pro- vide ratings, based on the statements’ perceived attitude strength and direction. An 11-point scale is used. The strongest negative statements receive 1’s and the strongest positive statements receive 11’s. Statements perceived as neutral are given a 6. Judges are asked to imagine equal intervals between their ratings and may place as many statements as they wish under any rating. Judges are asked to ignore their own personal feelings towards the attitude object and rate items only based on their interpretation of the attitudinal strength of the wording. Each item’s “pile” or rating is averaged across judges and this provides a measure of strength for each item. For each topic, the “strong” form was composed of the 10 items with strength ratings closest to 1 or 11, and the “moder- ate” form was composed of the ten items with ratings closest to 4 or 8. The items for all scales and their Thurstone ratings are presented in Table 1. Answer options for the statements were presented Likert-style with 5 options, ranging from 1 = strongly disagree to 5 = strongly agree. In order to compare validity, some potentially convergent data had to be created. Two additional items were added to each form: A 9-point answer option statement of general positive or negative attitude towards the attitude object and a behavioral item asking, depending on the object, how often the respondent had gone to the movies in the last year or how often the re- spondent had expressed an opinion against animal experimenta- tion in the last year. 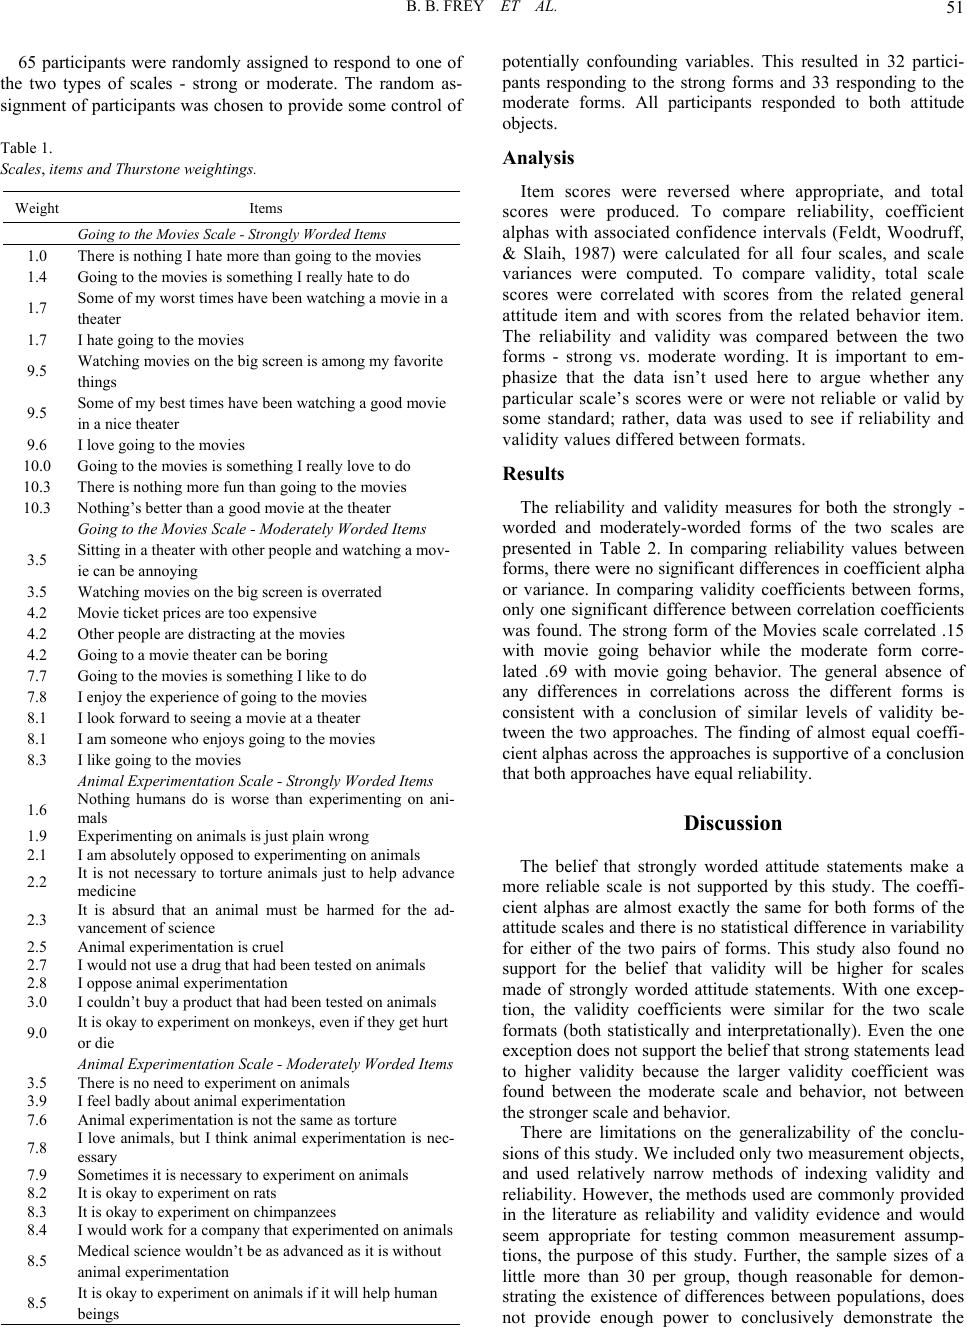 B. B. FREY ET AL. 51 65 participants were randomly assigned to respond to one of the two types of scales - strong or moderate. The random as- signment of participants was chosen to provide some control of Table 1. Scales, items and Thurstone weightings. Weight Items Going to the Movies Scale - Strongly Worded Items 1.0 There is nothing I hate more than going to the movies 1.4 Going to the movies is something I really hate to do 1.7 Some of my worst times have been watching a movie in a theater 1.7 I hate going to the movies 9.5 Watching movies on the big screen is among my favorite things 9.5 Some of my best times have been watching a good movie in a nice theater 9.6 I love going to the movies 10.0 Going to the movies is something I really love to do 10.3 There is nothing more fun than going to the movies 10.3 Nothing’s better than a good movie at the theater Going to the Movies Scale - Moderately Worded Items 3.5 Sitting in a theater with other people and watching a mov- ie can be annoying 3.5 Watching movies on the big screen is overrated 4.2 Movie ticket prices are too expensive 4.2 Other people are distracting at the movies 4.2 Going to a movie theater can be boring 7.7 Going to the movies is something I like to do 7.8 I enjoy the experience of going to the movies 8.1 I look forward to seeing a movie at a theater 8.1 I am someone who enjoys going to the movies 8.3 I like going to the movies Animal Experimentation Scale - Strongly Worded Items 1.6 Nothing humans do is worse than experimenting on ani- mals 1.9 Experimenting on animals is just plain wrong 2.1 I am absolutely opposed to experimenting on animals 2.2 It is not necessary to torture animals just to help advance medicine 2.3 It is absurd that an animal must be harmed for the ad- vancement of science 2.5 Animal experimentation is cruel 2.7 I would not use a drug that had been tested on animals 2.8 I oppose animal experimentation 3.0 I couldn’t buy a product that had been tested on animals 9.0 It is okay to experiment on monkeys, even if they get hurt or die Animal Experimentation Scale - Moderately Worded Items 3.5 There is no need to experiment on animals 3.9 I feel badly about animal experimentation 7.6 Animal experimentation is not the same as torture 7.8 I love animals, but I think animal experimentation is nec- essary 7.9 Sometimes it is necessary to experiment on animals 8.2 It is okay to experiment on rats 8.3 It is okay to experiment on chimpanzees 8.4 I would work for a company that experimented on animals 8.5 Medical science wouldn’t be as advanced as it is without animal experimentation 8.5 It is okay to experiment on animals if it will help human beings potentially confounding variables. This resulted in 32 partici- pants responding to the strong forms and 33 responding to the moderate forms. All participants responded to both attitude objects. Analysis Item scores were reversed where appropriate, and total scores were produced. To compare reliability, coefficient alphas with associated confidence intervals (Feldt, Woodruff, & Slaih, 1987) were calculated for all four scales, and scale variances were computed. To compare validity, total scale scores were correlated with scores from the related general attitude item and with scores from the related behavior item. The reliability and validity was compared between the two forms - strong vs. moderate wording. It is important to em- phasize that the data isn’t used here to argue whether any particular scale’s scores were or were not reliable or valid by some standard; rather, data was used to see if reliability and validity values differed between formats. Results The reliability and validity measures for both the strongly - worded and moderately-worded forms of the two scales are presented in Table 2. In comparing reliability values between forms, there were no significant differences in coefficient alpha or variance. In comparing validity coefficients between forms, only one significant difference between correlation coefficients was found. The strong form of the Movies scale correlated .15 with movie going behavior while the moderate form corre- lated .69 with movie going behavior. The general absence of any differences in correlations across the different forms is consistent with a conclusion of similar levels of validity be- tween the two approaches. The finding of almost equal coeffi- cient alphas across the approaches is supportive of a conclusion that both approaches have equal reliability. Discussion The belief that strongly worded attitude statements make a more reliable scale is not supported by this study. The coeffi- cient alphas are almost exactly the same for both forms of the attitude scales and there is no statistical difference in variability for either of the two pairs of forms. This study also found no support for the belief that validity will be higher for scales made of strongly worded attitude statements. With one excep- tion, the validity coefficients were similar for the two scale formats (both statistically and interpretationally). Even the one exception does not support the belief that strong statements lead to higher validity because the larger validity coefficient was found between the moderate scale and behavior, not between the stronger scale and behavior. There are limitations on the generalizability of the conclu- sions of this study. We included only two measurement objects, and used relatively narrow methods of indexing validity and reliability. However, the methods used are commonly provided in the literature as reliability and validity evidence and would seem appropriate for testing common measurement assump- tions, the purpose of this study. Further, the sample sizes of a little more than 30 per group, though reasonable for demon- strating the existence of differences between populations, does not provide enough power to conclusively demonstrate the 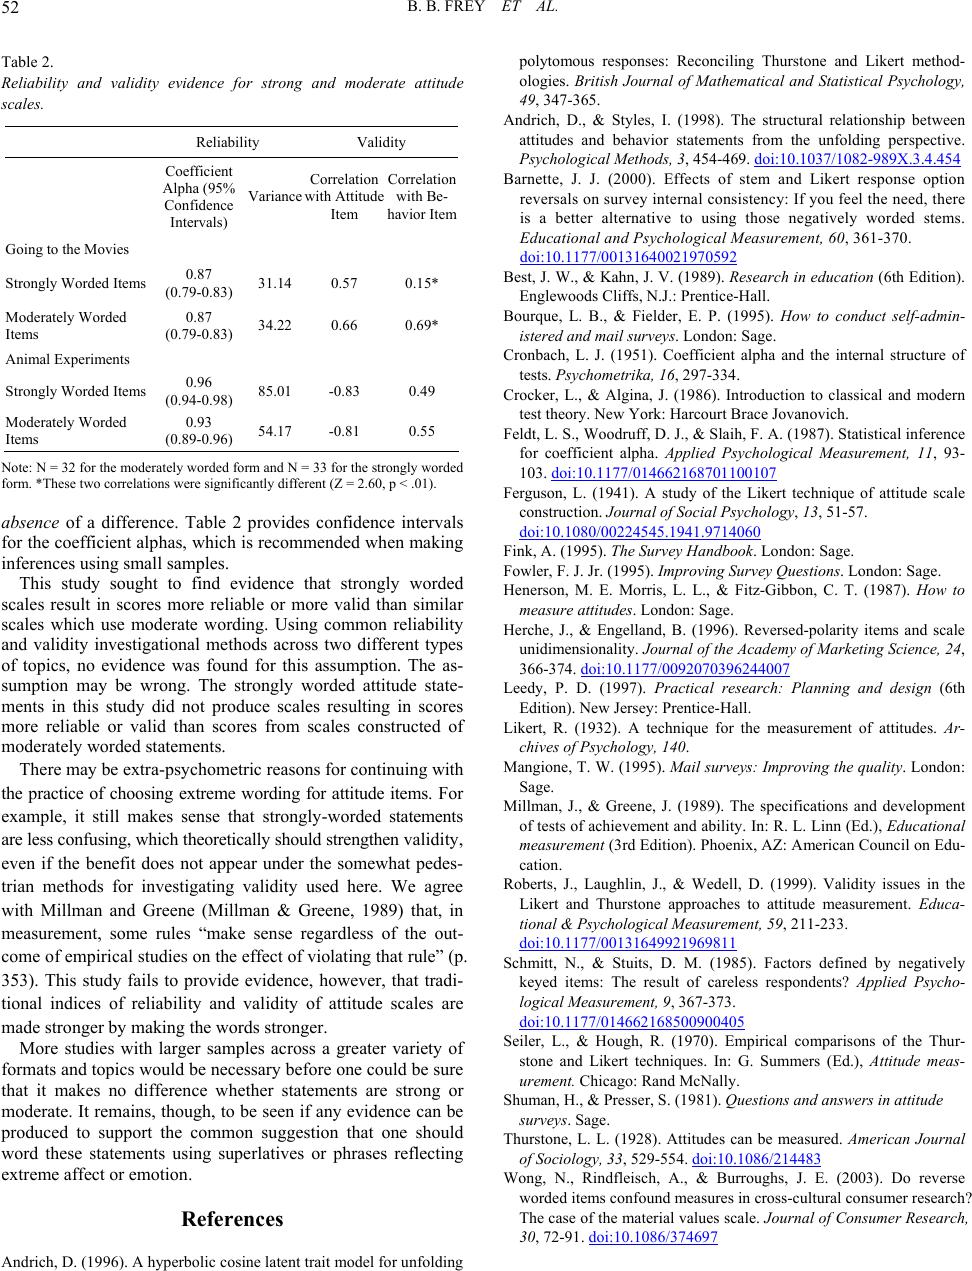 B. B. FREY ET AL. 52 Table 2. Reliability and validity evidence for strong and moderate attitude scales. Reliability Validity Coefficient Alpha (95% Confidence Intervals) Variance Correlation with Attitude Item Correlation with Be- havior Item Going to the Movies Strongly Worded Items 0.87 (0.79-0.83) 31.14 0.57 0.15* Moderately Worded Items 0.87 (0.79-0.83) 34.22 0.66 0.69* Animal Experiments Strongly Worded Items 0.96 (0.94-0.98) 85.01 -0.83 0.49 Moderately Worded Items 0.93 (0.89-0.96) 54.17 -0.81 0.55 Note: N = 32 for the moderately worded form and N = 33 for the strongly worded form. *These two correlations were significantly different (Z = 2.60, p < .01). absence of a difference. Table 2 provides confidence intervals for the coefficient alphas, which is recommended when making inferences using small samples. This study sought to find evidence that strongly worded scales result in scores more reliable or more valid than similar scales which use moderate wording. Using common reliability and validity investigational methods across two different types of topics, no evidence was found for this assumption. The as- sumption may be wrong. The strongly worded attitude state- ments in this study did not produce scales resulting in scores more reliable or valid than scores from scales constructed of moderately worded statements. There may be extra-psychometric reasons for continuing with the practice of choosing extreme wording for attitude items. For example, it still makes sense that strongly-worded statements are less confusing, which theoretically should strengthen validity, even if the benefit does not appear under the somewhat pedes- trian methods for investigating validity used here. We agree with Millman and Greene (Millman & Greene, 1989) that, in measurement, some rules “make sense regardless of the out- come of empirical studies on the effect of violating that rule” (p. 353). This study fails to provide evidence, however, that tradi- tional indices of reliability and validity of attitude scales are made stronger by making the words stronger. More studies with larger samples across a greater variety of formats and topics would be necessary before one could be sure that it makes no difference whether statements are strong or moderate. It remains, though, to be seen if any evidence can be produced to support the common suggestion that one should word these statements using superlatives or phrases reflecting extreme affect or emotion. References Andrich, D. (1996). A hyperbolic cosine latent trait model for unfolding polytomous responses: Reconciling Thurstone and Likert method- ologies. British Journal of Mathematical and Statistical Psychology, 49, 347-365. Andrich, D., & Styles, I. (1998). The structural relationship between attitudes and behavior statements from the unfolding perspective. Psychological Methods, 3, 454-469. doi:10.1037/1082-989X.3.4.454 Barnette, J. J. (2000). Effects of stem and Likert response option reversals on survey internal consistency: If you feel the need, there is a better alternative to using those negatively worded stems. Educational and Psychological Measurement, 60, 361-370. doi:10.1177/00131640021970592 Best, J. W., & Kahn, J. V. (1989). Research in education (6th Edition). Englewoods Cliffs, N.J.: Prentice-Hall. Bourque, L. B., & Fielder, E. P. (1995). How to conduct self-admin- istered and mail surve y s. London: Sage. Cronbach, L. J. (1951). Coefficient alpha and the internal structure of tests. Psychometrika, 16, 297-334. Crocker, L., & Algina, J. (1986). Introduction to classical and modern test theory. New York: Harcourt Brace Jovanovich. Feldt, L. S., Woodruff, D. J., & Slaih, F. A. (1987). Statistical inference for coefficient alpha. Applied Psychological Measurement, 11, 93- 103. doi:10.1177/014662168701100107 Ferguson, L. (1941). A study of the Likert technique of attitude scale construction. Jour na l o f So cial Psychology, 13, 51-57. doi:10.1080/00224545.1941.9714060 Fink, A. (1995). The Survey Han db ook. London: Sage. Fowler, F. J. Jr. (1995). Improving Survey Questions. London: Sage. Henerson, M. E. Morris, L. L., & Fitz-Gibbon, C. T. (1987). How to measure attitudes. London: Sage. Herche, J., & Engelland, B. (1996). Reversed-polarity items and scale unidimensionality. Journal of the Academy of Marketing Science, 24, 366-374. doi:10.1177/0092070396244007 Leedy, P. D. (1997). Practical research: Planning and design (6th Edition). New Jersey: Prentice-Hall. Likert, R. (1932). A technique for the measurement of attitudes. Ar- chives of Psychology, 140. Mangione, T. W. (1995). Mail surveys: Improving the quality. London: Sage. Millman, J., & Greene, J. (1989). The specifications and development of tests of achievement and ability. In: R. L. Linn (Ed.), Educational measurement (3rd Edition). Phoenix, AZ: American Council on Edu- cation. Roberts, J., Laughlin, J., & Wedell, D. (1999). Validity issues in the Likert and Thurstone approaches to attitude measurement. Educa- tional & Psychological Measurement, 59, 211-233. doi:10.1177/00131649921969811 Schmitt, N., & Stuits, D. M. (1985). Factors defined by negatively keyed items: The result of careless respondents? Applied Psycho- logical Measurement , 9, 367-373. doi:10.1177/014662168500900405 Seiler, L., & Hough, R. (1970). Empirical comparisons of the Thur- stone and Likert techniques. In: G. Summers (Ed.), Attitude meas- urement. Chicago: Rand McNally. Shuman, H., & Presser, S. (1981). Questions and answers in attitude surveys. Sage. Thurstone, L. L. (1928). Attitudes can be measured. American Journal of Sociology, 33, 529-554. doi:10.1086/214483 Wong, N., Rindfleisch, A., & Burroughs, J. E. (2003). Do reverse worded items confound measures in cross-cultural consumer research? The case of the material values scale. Journal of Consumer Research, 30, 72-91. doi:10.1086/374697 |