

Paper Menu >>
Journal Menu >>
 Energy and Power Engineering, 2013, 5, 1120-1125 doi:10.4236/epe.2013.54B214 Published Online July 2013 (http://www.scirp.org/journal/epe) Harmonic Currents of Semiconductor Pulse Switching Converters Petr Bilik1, Jan Zidek1, Vaclav Kus2, Te r eza Josefova2 1Faculty of Electrical Engineering and Computer Science, VSB – Technical University of Ostrava, Czech Republic 2Department of Electromechanics and Power Electronics, University of West Bohemia, Pilsen, Czech Republic Email: {petr.bilik, jan.zidek}@vsb.cz, [email protected], [email protected] Received March, 2013 ABSTRACT Due to the operation of power semiconductor switching converters, the content of harmonic currents, which these switching converters take from the feed array, is still increasing. One of the possible ways of minimizing these currents is the use of pulse switching converters. On one hand, the original, characteristic harmonic ones are minimized, but, on the other hand, new frequencies caused by the modulation frequency appear in the current spectrum. The level of the currents of these frequencies is small and is scarcely dependent on the load of the converter. It may happen that the proportional value of the monitored harmonic one is high, although the absolute value is low. In the article presented, there is a description of the activity of the pulse voltage rectifier and an analysis of the current taken. The other part contains the results of the harmonic analysis of the stated current, including both the absolute and proportional values according to the load. In the conclusion, there are results of measurements of pulsed switching converters taken from the real measurement. Keywords: Rectifiers; Harmonic Analysis; Harmonic Distortion; Power System Harmonics; Current Measurement 1. Introduction Conventional controlled rectifiers designed for speed regulation of DC motors were characterized by both the consumption of harmonic currents and, especially, the variable power factor (proportional to the steering angle of the converter). There were mostly high power con- verters, so the negative effects on the power network were dealt with by experts. In the spectrum of the current, there mostly occurred so called characteristic harmonic ones and their level was computed using the amplitude principle. When mentioning small power sources for the use in electronics (charging of capacitors), there were, on the contrary, very low powers and very small amount of appliances, so that negative effects were ignored. A significant increase of negative effects of the con- verters on the power network occurs with the increase of frequency converters with a DC voltage intermediate circuit. These converters usually contain uncontrolled rectifiers at the input. The converter thus works with a negligible phase shift between the voltage and the current, and the power factor (fundamental harmonic cos φ1) is close to 1. However, the current harmonic ones become a problem. The very first converters even worked without sufficient circuits for limitation of the harmonic ones. In principle, it is a rectifier working to capacitive load; the values of harmonic currents are very high. In a simplified calculation, there can be used a so-called "generalized amplitude principle" (1) [1,2]. h1 hd sin 12 II. d hsin 2 (1) where: h – harmonic order, I1 – magnitude of fundamen- tal harmonic, d – diode conduction time. Detailed information about calculations of characteristic harmonics, non-characteristic harmonics and interharmonics can be found in [2-5]. Topic of harmonics elimination and power factor improvement of three-phase rectifier is described in [6]. Equation (1) advantage is that it also applies to con- ventional controlled rectifiers, to calculation of the har- monic ones with intermittent currents, to calculation of harmonic voltage converters as well as to frequency converters or other rectifiers working to capacitive loads. See the calculated shape of current in Figure 1. The unambiguous result of this relation is the fact that the values of harmonic ones depend on the time during which the diode is open (the capacity is recharged). As for large capacities, the time is very short and thus the harmonic ones are even higher. This, paradoxically, re- sults in a situation where the load requires large voltage Copyright © 2013 SciRes. EPE 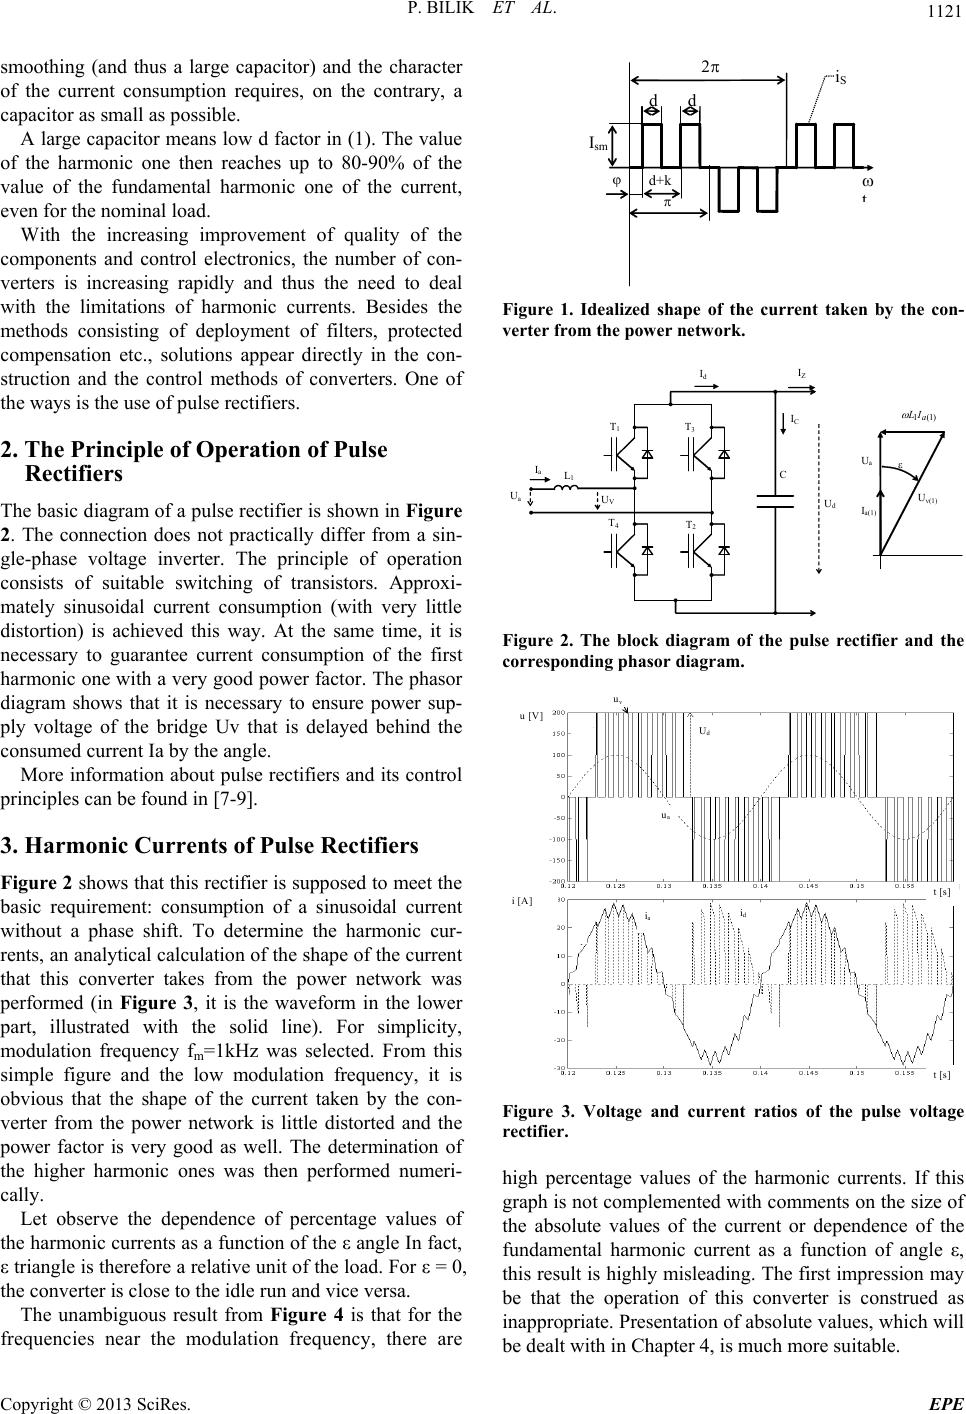 P. BILIK ET AL. 1121 smoothing (and thus a large capacitor) and the character of the current consumption requires, on the contrary, a capacitor as small as possible. A large capacitor means low d factor in (1). The value of the harmonic one then reaches up to 80-90% of the value of the fundamental harmonic one of the current, even for the nominal load. With the increasing improvement of quality of the components and control electronics, the number of con- verters is increasing rapidly and thus the need to deal with the limitations of harmonic currents. Besides the methods consisting of deployment of filters, protected compensation etc., solutions appear directly in the con- struction and the control methods of converters. One of the ways is the use of pulse rectifiers. 2. The Principle of Operation of Pulse Rectifiers The basic diagram of a pulse rectifier is shown in Figure 2. The connection does not practically differ from a sin- gle-phase voltage inverter. The principle of operation consists of suitable switching of transistors. Approxi- mately sinusoidal current consumption (with very little distortion) is achieved this way. At the same time, it is necessary to guarantee current consumption of the first harmonic one with a very good power factor. The phasor diagram shows that it is necessary to ensure power sup- ply voltage of the bridge Uv that is delayed behind the consumed current Ia by the angle. More information about pulse rectifiers and its control principles can be found in [7-9]. 3. Harmonic Currents of Pulse Rectifiers Figure 2 shows that this rectifier is supposed to meet the basic requirement: consumption of a sinusoidal current without a phase shift. To determine the harmonic cur- rents, an analytical calculation of the shape of the current that this converter takes from the power network was performed (in Figure 3, it is the waveform in the lower part, illustrated with the solid line). For simplicity, modulation frequency fm=1kHz was selected. From this simple figure and the low modulation frequency, it is obvious that the shape of the current taken by the con- verter from the power network is little distorted and the power factor is very good as well. The determination of the higher harmonic ones was then performed numeri- cally. Let observe the dependence of percentage values of the harmonic currents as a function of the ε angle In fact, ε triangle is therefore a relative unit of the load. For ε = 0, the converter is close to the idle run and vice versa. The unambiguous result from Figure 4 is that for the frequencies near the modulation frequency, there are iS dd t 2 Ism d+k Figure 1. Idealized shape of the current taken by the con- verter fr om the power networ k. C L1 Ua T4T2 T3 T1 Id Ia IC Ud IZ UVUv(1) Ua )1(1 a IL Ia(1) Figure 2. The block diagram of the pulse rectifier and the corresponding phasor diagram. u [V] i [A] Ud uv Ud ua id ia t [s] t [s] Figure 3. Voltage and current ratios of the pulse voltage rectifier. high percentage values of the harmonic currents. If this graph is not complemented with comments on the size of the absolute values of the current or dependence of the fundamental harmonic current as a function of angle ε, this result is highly misleading. The first impression may be that the operation of this converter is construed as inappropriate. Presentation of absolute values, which will be dealt with in Chapter 4, is much more suitable. Copyright © 2013 SciRes. EPE 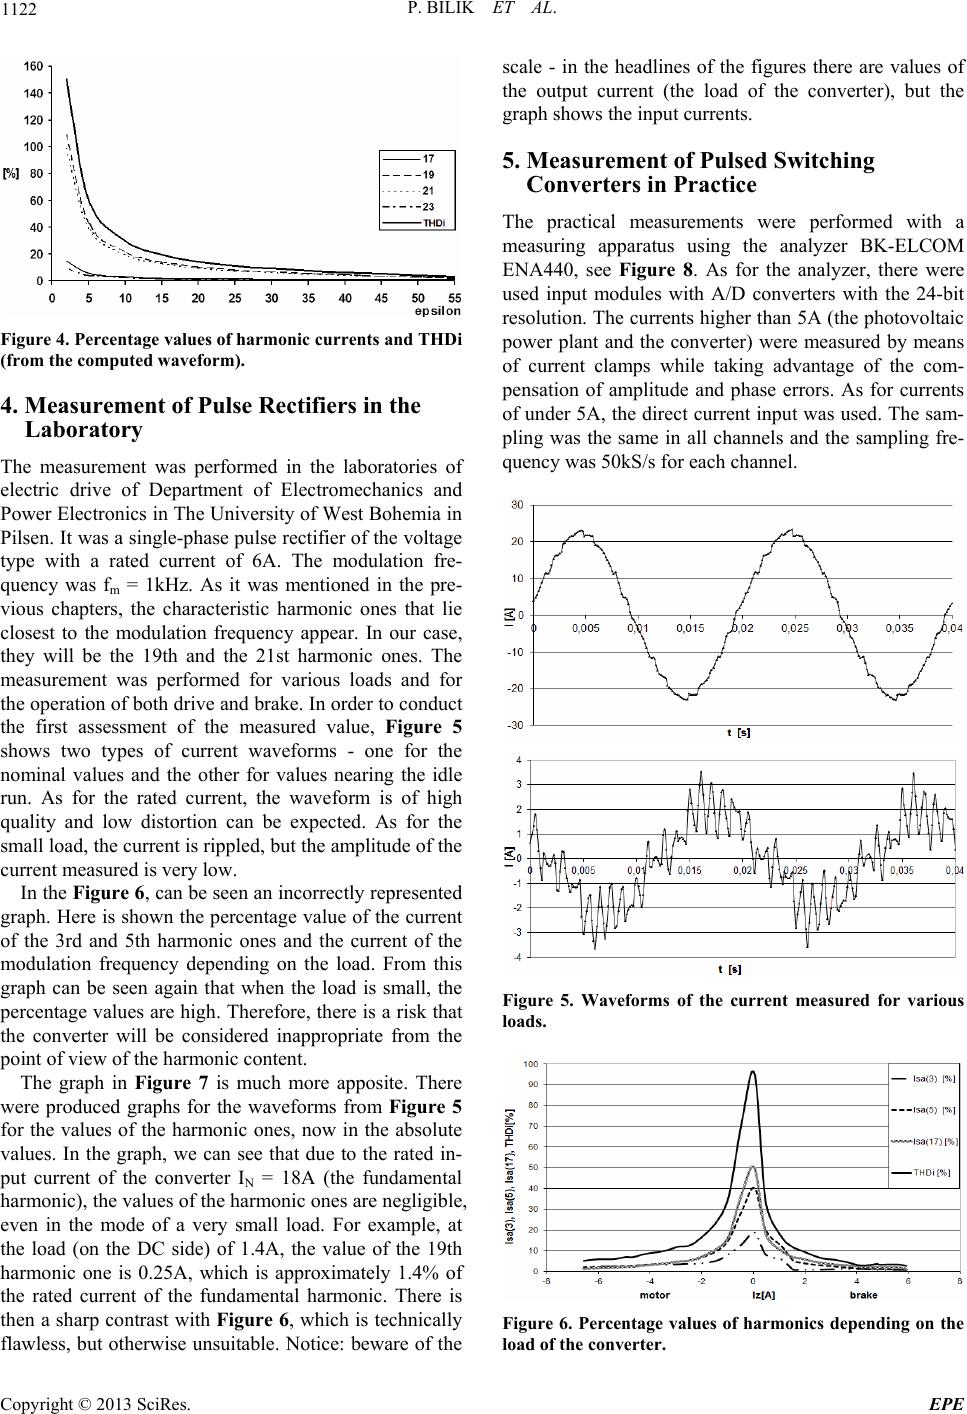 P. BILIK ET AL. 1122 Figure 4. Percentage values of harmonic currents and THDi (from the computed waveform). 4. Measurement of Pulse Rectifiers in the Laboratory The measurement was performed in the laboratories of electric drive of Department of Electromechanics and Power Electronics in The University of West Bohemia in Pilsen. It was a single-phase pulse rectifier of the voltage type with a rated current of 6A. The modulation fre- quency was fm = 1kHz. As it was mentioned in the pre- vious chapters, the characteristic harmonic ones that lie closest to the modulation frequency appear. In our case, they will be the 19th and the 21st harmonic ones. The measurement was performed for various loads and for the operation of both drive and brake. In order to conduct the first assessment of the measured value, Figure 5 shows two types of current waveforms - one for the nominal values and the other for values nearing the idle run. As for the rated current, the waveform is of high quality and low distortion can be expected. As for the small load, the current is rippled, but the amplitude of the current measured is very low. In the Figure 6, can be seen an incorrectly represented graph. Here is shown the percentage value of the current of the 3rd and 5th harmonic ones and the current of the modulation frequency depending on the load. From this graph can be seen again that when the load is small, the percentage values are high. Therefore, there is a risk that the converter will be considered inappropriate from the point of view of the harmonic content. The graph in Figure 7 is much more apposite. There were produced graphs for the waveforms from Figure 5 for the values of the harmonic ones, now in the absolute values. In the graph, we can see that due to the rated in- put current of the converter IN = 18A (the fundamental harmonic), the values of the harmonic ones are negligible, even in the mode of a very small load. For example, at the load (on the DC side) of 1.4A, the value of the 19th harmonic one is 0.25A, which is approximately 1.4% of the rated current of the fundamental harmonic. There is then a sharp contrast with Figure 6, which is technically flawless, but otherwise unsuitable. Notice: beware of the scale - in the headlines of the figures there are values of the output current (the load of the converter), but the graph shows the input currents. 5. Measurement of Pulsed Switching Converters in Practice The practical measurements were performed with a measuring apparatus using the analyzer BK-ELCOM ENA440, see Figure 8. As for the analyzer, there were used input modules with A/D converters with the 24-bit resolution. The currents higher than 5A (the photovoltaic power plant and the converter) were measured by means of current clamps while taking advantage of the com- pensation of amplitude and phase errors. As for currents of under 5A, the direct current input was used. The sam- pling was the same in all channels and the sampling fre- quency was 50kS/s for each channel. Figure 5. Waveforms of the current measured for various loads. Figure 6. Percentage values of harmonics depending on the load of the converter. Copyright © 2013 SciRes. EPE 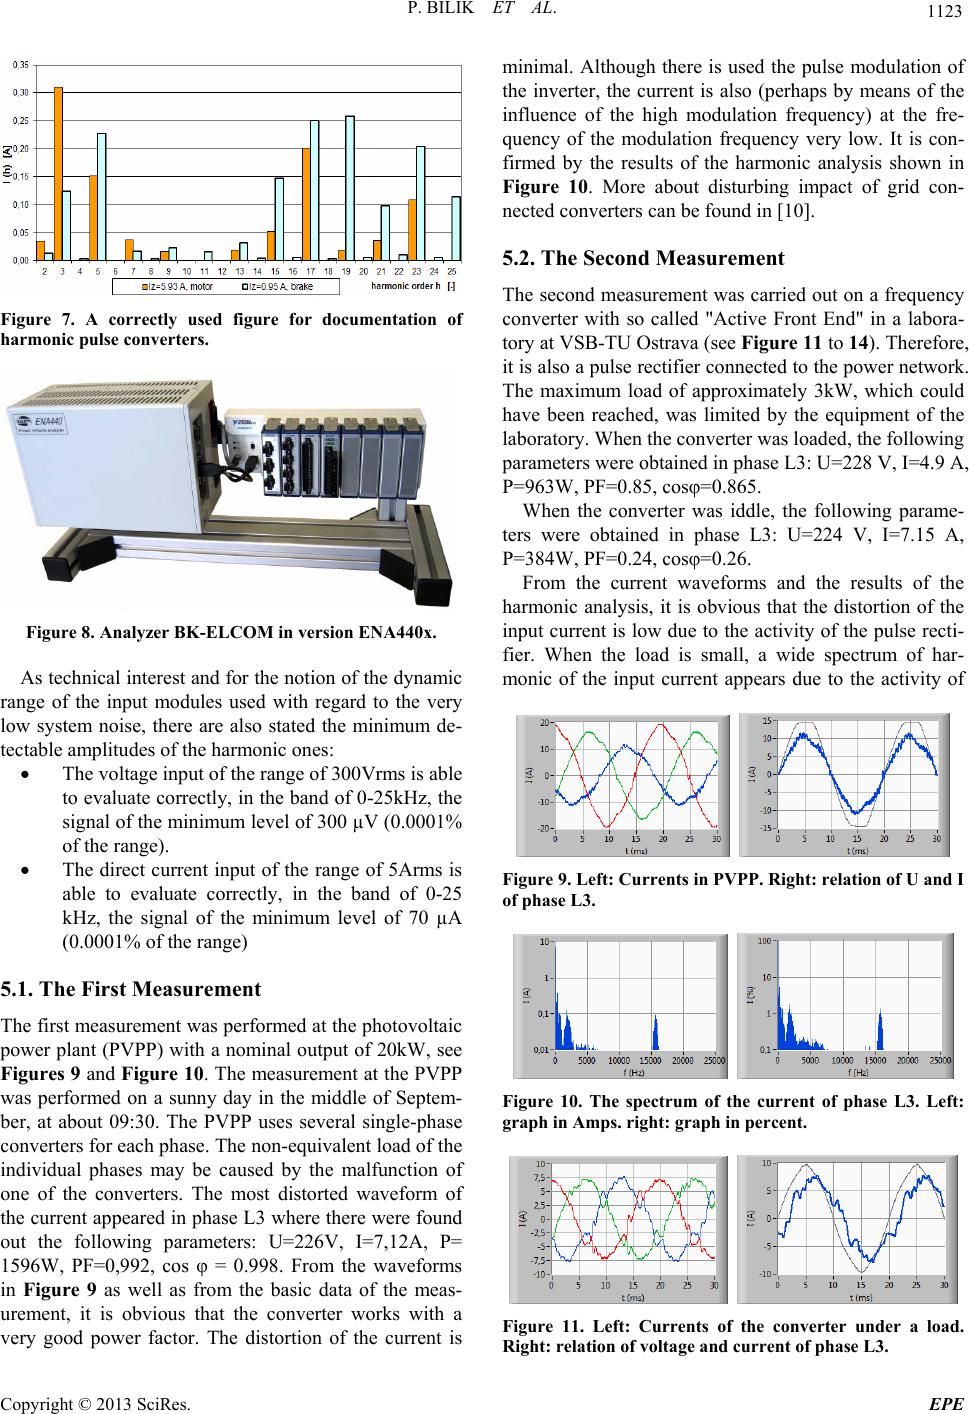 P. BILIK ET AL. 1123 Figure 7. A correctly used figure for documentation of harmonic pulse converters. Figure 8. Analyzer BK-ELCOM in version ENA440x. As technical interest and for the notion of the dynamic range of the input modules used with regard to the very low system noise, there are also stated the minimum de- tectable amplitudes of the harmonic ones: The voltage input of the range of 300Vrms is able to evaluate correctly, in the band of 0-25kHz, the signal of the minimum level of 300 µV (0.0001% of the range). The direct current input of the range of 5Arms is able to evaluate correctly, in the band of 0-25 kHz, the signal of the minimum level of 70 µA (0.0001% of the range) 5.1. The First Measurement The first measurement was performed at the photovoltaic power plant (PVPP) with a nominal output of 20kW, see Figures 9 and Figure 10. The measurement at the PVPP was performed on a sunny day in the middle of Septem- ber, at about 09:30. The PVPP uses several single-phase converters for each phase. The non-equivalent load of the individual phases may be caused by the malfunction of one of the converters. The most distorted waveform of the current appeared in phase L3 where there were found out the following parameters: U=226V, I=7,12A, P= 1596W, PF=0,992, cos φ = 0.998. From the waveforms in Figure 9 as well as from the basic data of the meas- urement, it is obvious that the converter works with a very good power factor. The distortion of the current is minimal. Although there is used the pulse modulation of the inverter, the current is also (perhaps by means of the influence of the high modulation frequency) at the fre- quency of the modulation frequency very low. It is con- firmed by the results of the harmonic analysis shown in Figure 10. More about disturbing impact of grid con- nected converters can be found in [10]. 5.2. The Second Measurement The second measurement was carried out on a frequency converter with so called "Active Front End" in a labora- tory at VSB-TU Ostrava (see Figure 11 to 14). Therefore, it is also a pulse rectifier connected to the power network. The maximum load of approximately 3kW, which could have been reached, was limited by the equipment of the laboratory. When the converter was loaded, the following parameters were obtained in phase L3: U=228 V, I=4.9 A, P=963W, PF=0.85, cosφ=0.865. When the converter was iddle, the following parame- ters were obtained in phase L3: U=224 V, I=7.15 A, P=384W, PF=0.24, cosφ=0.26. From the current waveforms and the results of the harmonic analysis, it is obvious that the distortion of the input current is low due to the activity of the pulse recti- fier. When the load is small, a wide spectrum of har- monic of the input current appears due to the activity of Figure 9. Left: Currents in PVPP. Right: relation of U and I of phase L3. Figure 10. The spectrum of the current of phase L3. Left: graph in Amps. right: graph in per cent. Figure 11. Left: Currents of the converter under a load. Right: relation of voltage and current of phase L3. Copyright © 2013 SciRes. EPE 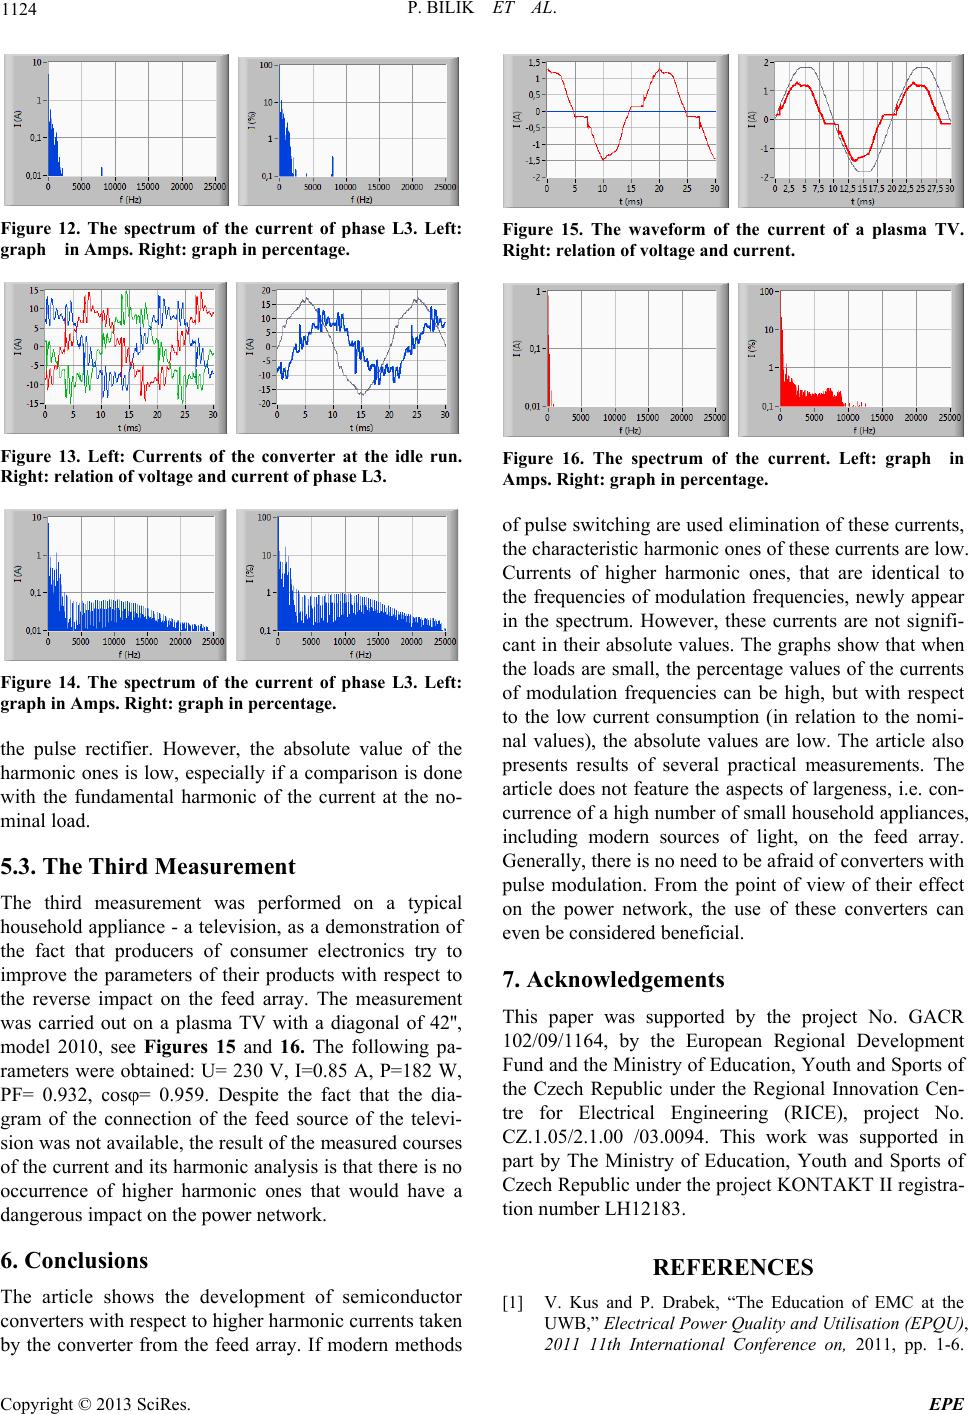 P. BILIK ET AL. 1124 Figure 12. The spectrum of the current of phase L3. Left: graph in Amps. Right: graph in percentage. Figure 13. Left: Currents of the converter at the idle run. Right: relation of voltage and current of phase L3. Figure 14. The spectrum of the current of phase L3. Left: graph in Amps. Right: graph in percentage. the pulse rectifier. However, the absolute value of the harmonic ones is low, especially if a comparison is done with the fundamental harmonic of the current at the no- minal load. 5.3. The Third Measurement The third measurement was performed on a typical household appliance - a television, as a demonstration of the fact that producers of consumer electronics try to improve the parameters of their products with respect to the reverse impact on the feed array. The measurement was carried out on a plasma TV with a diagonal of 42'', model 2010, see Figures 15 and 16. The following pa- rameters were obtained: U= 230 V, I=0.85 A, P=182 W, PF= 0.932, cosφ= 0.959. Despite the fact that the dia- gram of the connection of the feed source of the televi- sion was not available, the result of the measured courses of the current and its harmonic analysis is that there is no occurrence of higher harmonic ones that would have a dangerous impact on the power network. 6. Conclusions The article shows the development of semiconductor converters with respect to higher harmonic currents taken by the converter from the feed array. If modern methods Figure 15. The waveform of the current of a plasma TV. Right: relation of voltage and current. Figure 16. The spectrum of the current. Left: graph in Amps. Right: graph in percentage. of pulse switching are used elimination of these currents, the characteristic harmonic ones of these currents are low. Currents of higher harmonic ones, that are identical to the frequencies of modulation frequencies, newly appear in the spectrum. However, these currents are not signifi- cant in their absolute values. The graphs show that when the loads are small, the percentage values of the currents of modulation frequencies can be high, but with respect to the low current consumption (in relation to the nomi- nal values), the absolute values are low. The article also presents results of several practical measurements. The article does not feature the aspects of largeness, i.e. con- currence of a high number of small household appliances, including modern sources of light, on the feed array. Generally, there is no need to be afraid of converters with pulse modulation. From the point of view of their effect on the power network, the use of these converters can even be considered beneficial. 7. Acknowledgements This paper was supported by the project No. GACR 102/09/1164, by the European Regional Development Fund and the Ministry of Education, Youth and Sports of the Czech Republic under the Regional Innovation Cen- tre for Electrical Engineering (RICE), project No. CZ.1.05/2.1.00 /03.0094. This work was supported in part by The Ministry of Education, Youth and Sports of Czech Republic under the project KONTAKT II registra- tion number LH12183. REFERENCES [1] V. Kus and P. Drabek, “The Education of EMC at the UWB,” Electrical Power Quality and Utilisation (EPQU), 2011 11th International Conference on, 2011, pp. 1-6. Copyright © 2013 SciRes. EPE 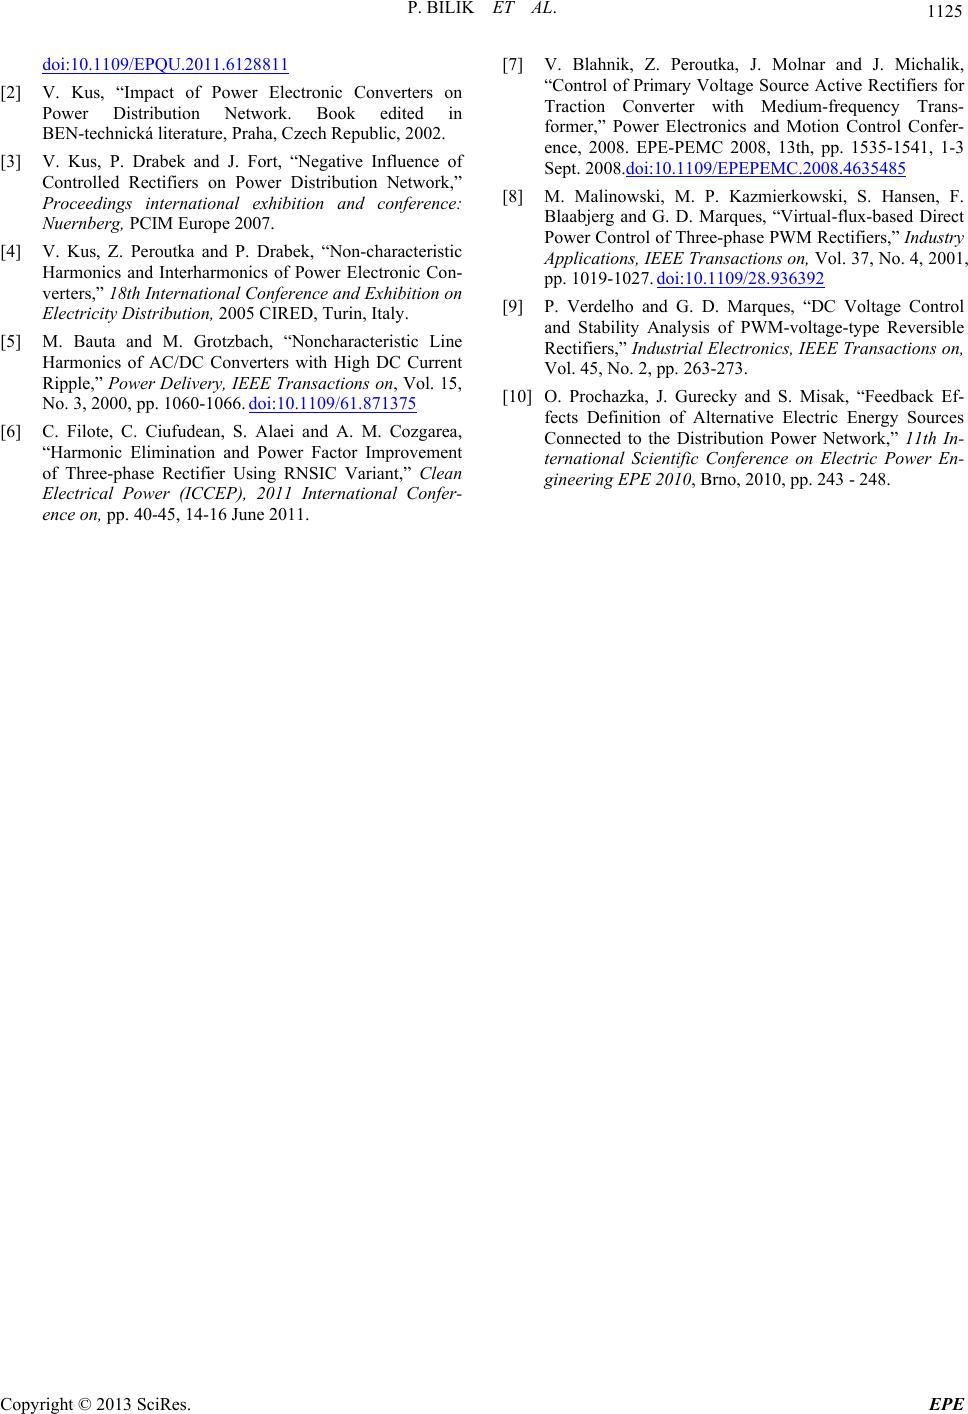 P. BILIK ET AL. Copyright © 2013 SciRes. EPE 1125 doi:10.1109/EPQU.2011.6128811 [2] V. Kus, “Impact of Power Electronic Converters on Power Distribution Network. Book edited in BEN-technická literature, Praha, Czech Republic, 2002. [3] V. Kus, P. Drabek and J. Fort, “Negative Influence of Controlled Rectifiers on Power Distribution Network,” Proceedings international exhibition and conference: Nuernberg, PCIM Europe 2007. [4] V. Kus, Z. Peroutka and P. Drabek, “Non-characteristic Harmonics and Interharmonics of Power Electronic Con- verters,” 18th International Conference and Exhibition on Electricity Distribution, 2005 CIRED, Turin, Italy. [5] M. Bauta and M. Grotzbach, “Noncharacteristic Line Harmonics of AC/DC Converters with High DC Current Ripple,” Power Delivery, IEEE Transactions on, Vol. 15, No. 3, 2000, pp. 1060-1066. doi:10.1109/61.871375 [6] C. Filote, C. Ciufudean, S. Alaei and A. M. Cozgarea, “Harmonic Elimination and Power Factor Improvement of Three-phase Rectifier Using RNSIC Variant,” Clean Electrical Power (ICCEP), 2011 International Confer- ence on, pp. 40-45, 14-16 June 2011. [7] V. Blahnik, Z. Peroutka, J. Molnar and J. Michalik, “Control of Primary Voltage Source Active Rectifiers for Traction Converter with Medium-frequency Trans- former,” Power Electronics and Motion Control Confer- ence, 2008. EPE-PEMC 2008, 13th, pp. 1535-1541, 1-3 Sept. 2008.doi:10.1109/EPEPEMC.2008.4635485 [8] M. Malinowski, M. P. Kazmierkowski, S. Hansen, F. Blaabjerg and G. D. Marques, “Virtual-flux-based Direct Power Control of Three-phase PWM Rectifiers,” Industry Applications, IEEE Transactions on, Vol. 37, No. 4, 2001, pp. 1019-1027. doi:10.1109/28.936392 [9] P. Verdelho and G. D. Marques, “DC Voltage Control and Stability Analysis of PWM-voltage-type Reversible Rectifiers,” Industrial Electronics, IEEE Transactions on, Vol. 45, No. 2, pp. 263-273. [10] O. Prochazka, J. Gurecky and S. Misak, “Feedback Ef- fects Definition of Alternative Electric Energy Sources Connected to the Distribution Power Network,” 11th In- ternational Scientific Conference on Electric Power En- gineering EPE 2010, Brno, 2010, pp. 243 - 248. |