

Paper Menu >>
Journal Menu >>
 Energy and Power Engineering, 2013, 5, 1053-1059 doi:10.4236/epe.2013.54B201 Published Online July 2013 (http://www.scirp.org/journal/epe) Multi-Layer Optimization for Load Scheduling to Manage Unreliable Grid Outages in Developing Countries Amit S. Closepet Spectrum Consultants, Bangalore, India Email: [email protected] Received 2013 ABSTRACT This paper describes the significant cost saving opportunities for consumers in developing countries by the use of com- putational intelligence and demand-side-management techniques to mitigate the massive use of diesel back-up during grid outages. Application of load scheduling optimization is investigated during scheduled power outages, for residen- tial consumer in India. The specific load shifting approaches explored include a day ahead predicted load schedule which is generated by performing a DSM referring to the forecasted day ahead outage. Whereas in reality the predicted may not match the actual outage, thus in these cases a fuzzy logic rule base is referred on real time basis to take correc- tive action & reach the best optimal load schedule possible to attain the lowest cost. The load types modeled include passive loads and schedulable, i.e. typically heavy loads. It is found that this multi-level DSM schemes show excellent benefits to the consumer. The maximum diesel savings for the consumer due to load shifting can be approximately ranging from 45% to as high as 75% for a flat-tariff grid. The study also showed that the actual savings potential de- pends on the timing of power outage, duration and the specific load characteristics. Keywords: Residential Demand Side Management; Diesel Mitigation; Real Time Load Shifting; Power Outage Management; Computational Intelligence 1. Introduction Demand-side-management (DSM) policies are being formulated by various stakeholders in India and other developing countries. These policies are specifically tar- geted to overcome large energy demand-supply gaps, to provide inclusive and reliable power for entire popula- tions. For example, in India, load scheduling has recently been implemented successfully for the agricultural sector. As in developed countries, load scheduling is driven by the utility for peak clipping of demand, load shifting for energy conservation and/or supporting load growth. In this work, our aim is to highlight the urgent need for de- mand-side-management policies to address one of the major unaddressed challenges for a consumer in a de- veloping country which is the problem of frequent power outages. DSM solutions and policies need to be devel- oped, validated and framed to enable the consumer get reliable power and reduce his dependence on expensive diesel back-up systems. The highly stochastic nature of the power grid (Figure 1) in developing economies with relentless power cuts forces consumers to rely heavily on diesel back-up systems for business continuity, risk mi- tigation and load execution. Major cost investments are required for both installation and operation diesel back-up systems. Recent articles [1-4,17] have shown that, in some cases, cost can run as much as high as 50% of the customer’s annual power budget. In this study, we explore the use of demand management techniques that will enable the consumer mitigate power outages, cut the dependence on diesel back-up and provide significant cost savings to the consumer. Tables 1(a)-(b) in [18] provide power outage data for several major cities in India and in other developing economies such as Africa, Philippines, South America and observe that power outages range from 2 hours to more than 10 hours a day. Power blackouts typically re- sult in total loss of power to large parts of the entire city to large districts. Different scenarios and causes for planned/unplanned power outages in India are described in [4,5]. Due to this grid unreliability, the market for genset and UPS systems is India is worth several billion dollars and growing at a rapid 20% annual rate. In India, Figure 1. Stochastic grid in developing countries. Copyright © 2013 SciRes. EPE 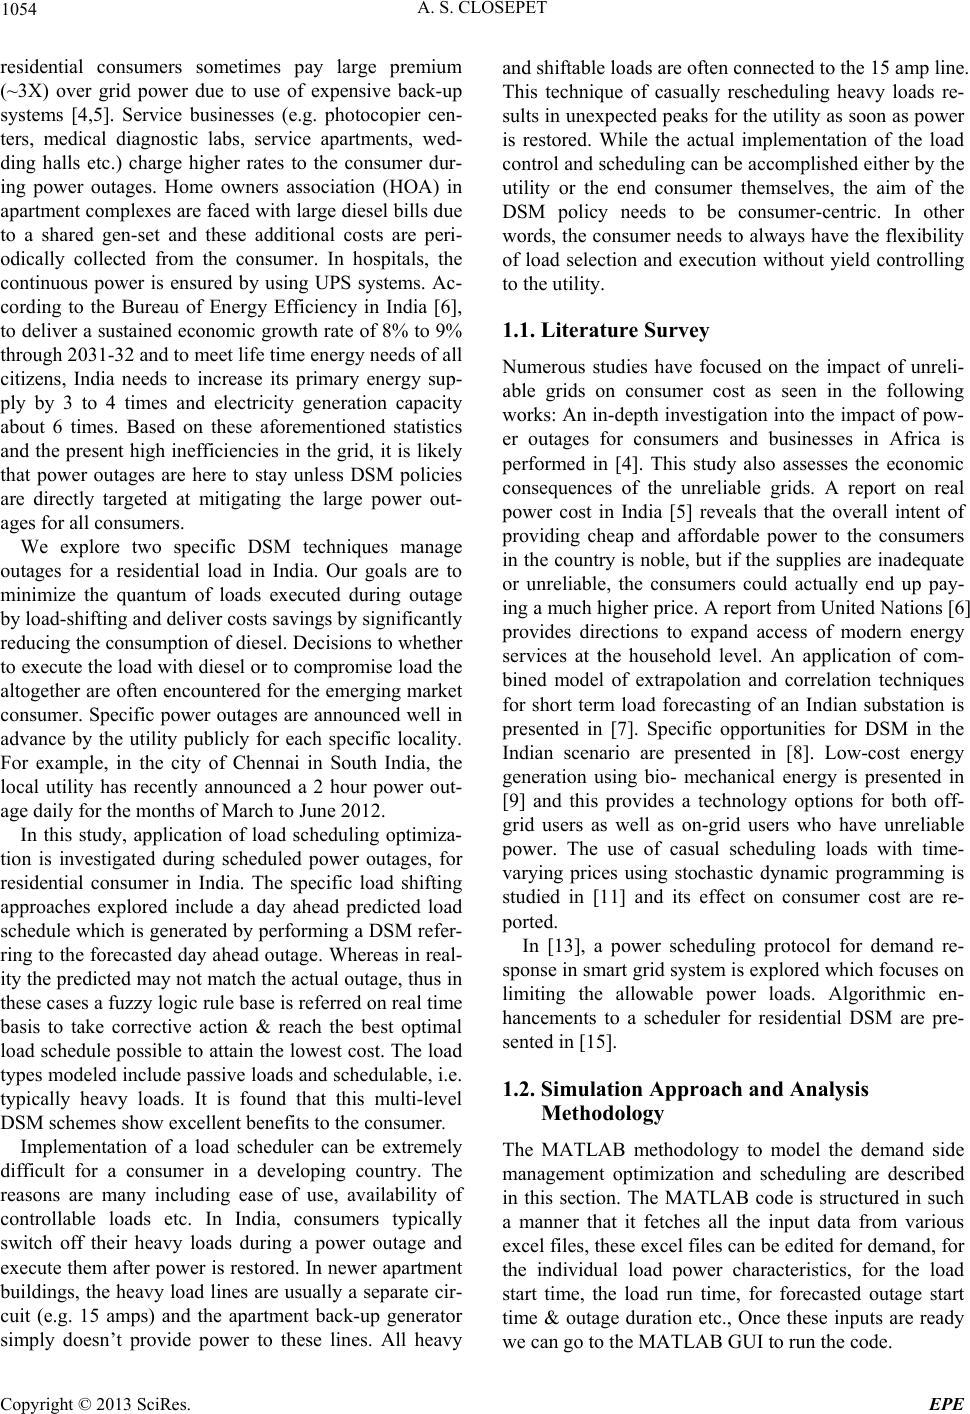 A. S. CLOSEPET 1054 residential consumers sometimes pay large premium (~3X) over grid power due to use of expensive back-up systems [4,5]. Service businesses (e.g. photocopier cen- ters, medical diagnostic labs, service apartments, wed- ding halls etc.) charge higher rates to the consumer dur- ing power outages. Home owners association (HOA) in apartment complexes are faced with large diesel bills due to a shared gen-set and these additional costs are peri- odically collected from the consumer. In hospitals, the continuous power is ensured by using UPS systems. Ac- cording to the Bureau of Energy Efficiency in India [6], to deliver a sustained economic growth rate of 8% to 9% through 2031-32 and to meet life time energy needs of all citizens, India needs to increase its primary energy sup- ply by 3 to 4 times and electricity generation capacity about 6 times. Based on these aforementioned statistics and the present high inefficiencies in the grid, it is likely that power outages are here to stay unless DSM policies are directly targeted at mitigating the large power out- ages for all consumers. We explore two specific DSM techniques manage outages for a residential load in India. Our goals are to minimize the quantum of loads executed during outage by load-shifting and deliver costs savings by significantly reducing the consumption of diesel. Decisions to whether to execute the load with diesel or to compromise load the altogether are often encountered for the emerging market consumer. Specific power outages are announced well in advance by the utility publicly for each specific locality. For example, in the city of Chennai in South India, the local utility has recently announced a 2 hour power out- age daily for the months of March to June 2012. In this study, application of load scheduling optimiza- tion is investigated during scheduled power outages, for residential consumer in India. The specific load shifting approaches explored include a day ahead predicted load schedule which is generated by performing a DSM refer- ring to the forecasted day ahead outage. Whereas in real- ity the predicted may not match the actual outage, thus in these cases a fuzzy logic rule base is referred on real time basis to take corrective action & reach the best optimal load schedule possible to attain the lowest cost. The load types modeled include passive loads and schedulable, i.e. typically heavy loads. It is found that this multi-level DSM schemes show excellent benefits to the consumer. Implementation of a load scheduler can be extremely difficult for a consumer in a developing country. The reasons are many including ease of use, availability of controllable loads etc. In India, consumers typically switch off their heavy loads during a power outage and execute them after power is restored. In newer apartment buildings, the heavy load lines are usually a separate cir- cuit (e.g. 15 amps) and the apartment back-up generator simply doesn’t provide power to these lines. All heavy and shiftable loads are often connected to the 15 amp line. This technique of casually rescheduling heavy loads re- sults in unexpected peaks for the utility as soon as power is restored. While the actual implementation of the load control and scheduling can be accomplished either by the utility or the end consumer themselves, the aim of the DSM policy needs to be consumer-centric. In other words, the consumer needs to always have the flexibility of load selection and execution without yield controlling to the utility. 1.1. Literature Survey Numerous studies have focused on the impact of unreli- able grids on consumer cost as seen in the following works: An in-depth investigation into the impact of pow- er outages for consumers and businesses in Africa is performed in [4]. This study also assesses the economic consequences of the unreliable grids. A report on real power cost in India [5] reveals that the overall intent of providing cheap and affordable power to the consumers in the country is noble, but if the supplies are inadequate or unreliable, the consumers could actually end up pay- ing a much higher price. A report from United Nations [6] provides directions to expand access of modern energy services at the household level. An application of com- bined model of extrapolation and correlation techniques for short term load forecasting of an Indian substation is presented in [7]. Specific opportunities for DSM in the Indian scenario are presented in [8]. Low-cost energy generation using bio- mechanical energy is presented in [9] and this provides a technology options for both off- grid users as well as on-grid users who have unreliable power. The use of casual scheduling loads with time- varying prices using stochastic dynamic programming is studied in [11] and its effect on consumer cost are re- ported. In [13], a power scheduling protocol for demand re- sponse in smart grid system is explored which focuses on limiting the allowable power loads. Algorithmic en- hancements to a scheduler for residential DSM are pre- sented in [15]. 1.2. Simulation Approach and Analysis Methodology The MATLAB methodology to model the demand side management optimization and scheduling are described in this section. The MATLAB code is structured in such a manner that it fetches all the input data from various excel files, these excel files can be edited for demand, for the individual load power characteristics, for the load start time, the load run time, for forecasted outage start time & outage duration etc., Once these inputs are ready we can go to the MATLAB GUI to run the code. Copyright © 2013 SciRes. EPE 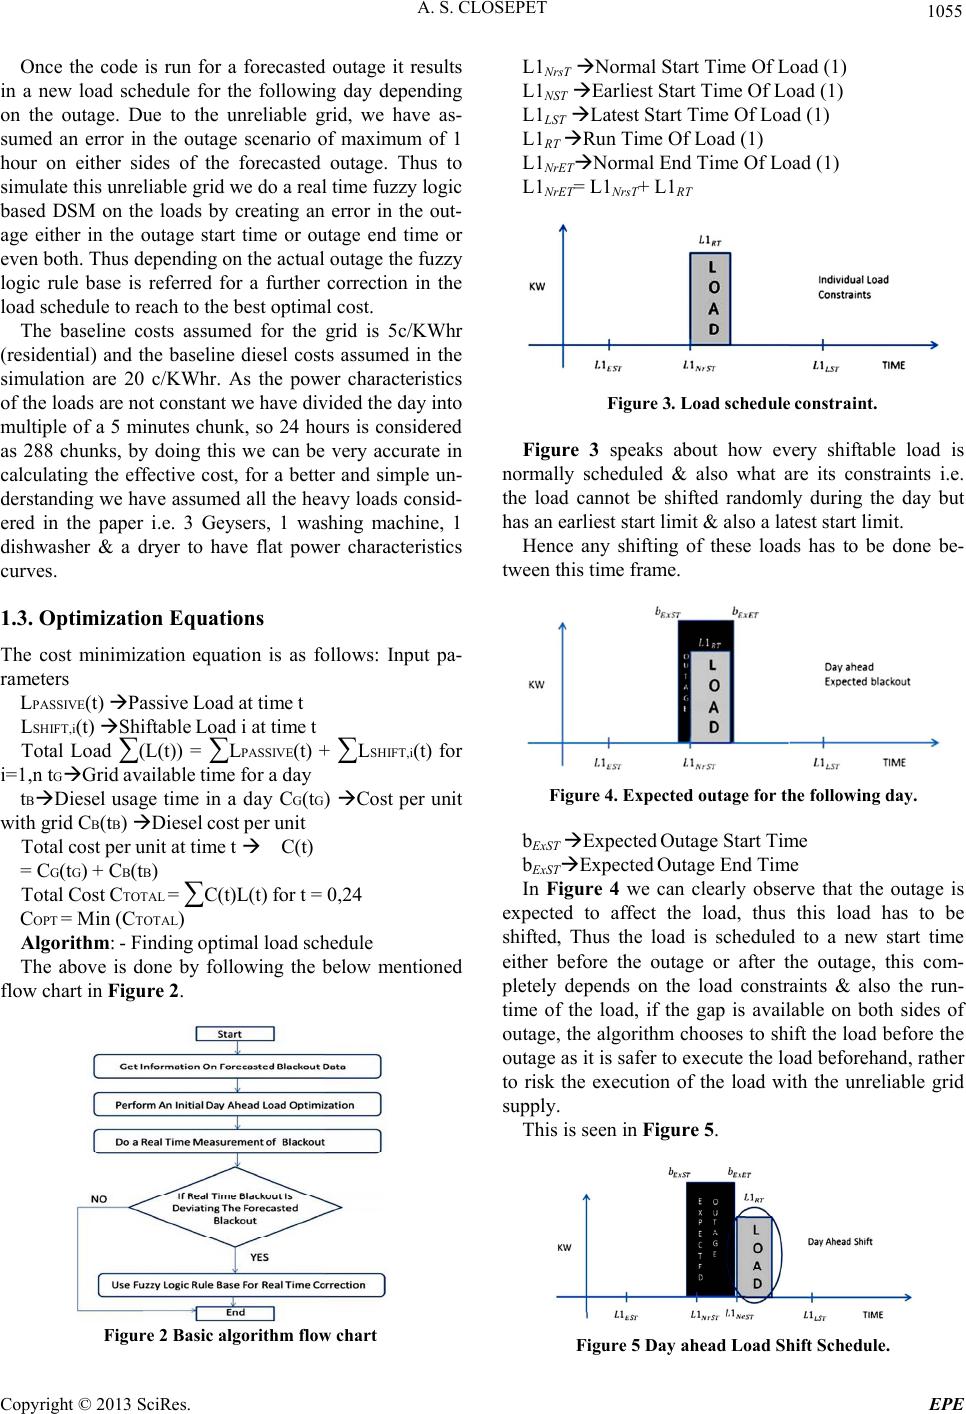 A. S. CLOSEPET 1055 Once the code is run for a forecasted outage it results in a new load schedule for the following day depending on the outage. Due to the unreliable grid, we have as- sumed an error in the outage scenario of maximum of 1 hour on either sides of the forecasted outage. Thus to simulate this unreliable grid we do a real time fuzzy logic based DSM on the loads by creating an error in the out- age either in the outage start time or outage end time or even both. Thus depending on the actual outage the fuzzy logic rule base is referred for a further correction in the load schedule to reach to the best optimal cost. The baseline costs assumed for the grid is 5c/KWhr (residential) and the baseline diesel costs assumed in the simulation are 20 c/KWhr. As the power characteristics of the loads are not constant we have divided the day into multiple of a 5 minutes chunk, so 24 hours is considered as 288 chunks, by doing this we can be very accurate in calculating the effective cost, for a better and simple un- derstanding we have assumed all the heavy loads consid- ered in the paper i.e. 3 Geysers, 1 washing machine, 1 dishwasher & a dryer to have flat power characteristics curves. 1.3. Optimization Equations The cost minimization equation is as follows: Input pa- rameters LPASSIVE(t) Passive Load at time t LSHIFT,i(t) Shiftable Load i at time t Total Load ∑(L(t)) = ∑LPASSIVE(t) + ∑LSHIFT ,i(t) for i=1,n tGGrid available time for a day tBDiesel usage time in a day CG(tG) Cost per unit with grid CB(tB) Diesel cost per unit Total cost per unit at time t C(t) = CG(tG) + CB(tB) Total Cost CTOTAL = ∑C(t)L(t) for t = 0,24 COPT = Min (CTOTAL) Algorithm: - Finding optimal load schedule The above is done by following the below mentioned flow chart in Figure 2. Figure 2 Basic algorithm flow chart L1NrsT Normal Start Time Of Load (1) L1NST Earliest Start Time Of Load (1) L1LST Latest Start Time Of Load (1) L1RT Run Time Of Load (1) L1NrETNormal End Time Of Load (1) L1NrET= L1NrsT+ L1RT Figure 3. Load schedule constraint. Figure 3 speaks about how every shiftable load is normally scheduled & also what are its constraints i.e. the load cannot be shifted randomly during the day but has an earliest start limit & also a latest start limit. Hence any shifting of these loads has to be done be- tween this time frame. Figure 4. Expected outage for the following day. bExST Expected Outage Start Time bExSTExpected Outage End Time In Figure 4 we can clearly observe that the outage is expected to affect the load, thus this load has to be shifted, Thus the load is scheduled to a new start time either before the outage or after the outage, this com- pletely depends on the load constraints & also the run- time of the load, if the gap is available on both sides of outage, the algorithm chooses to shift the load before the outage as it is safer to execute the load beforehand, rather to risk the execution of the load with the unreliable grid supply. This is seen in Figure 5. Figure 5 Day ahead Load Shift Sc he dule . Copyright © 2013 SciRes. EPE 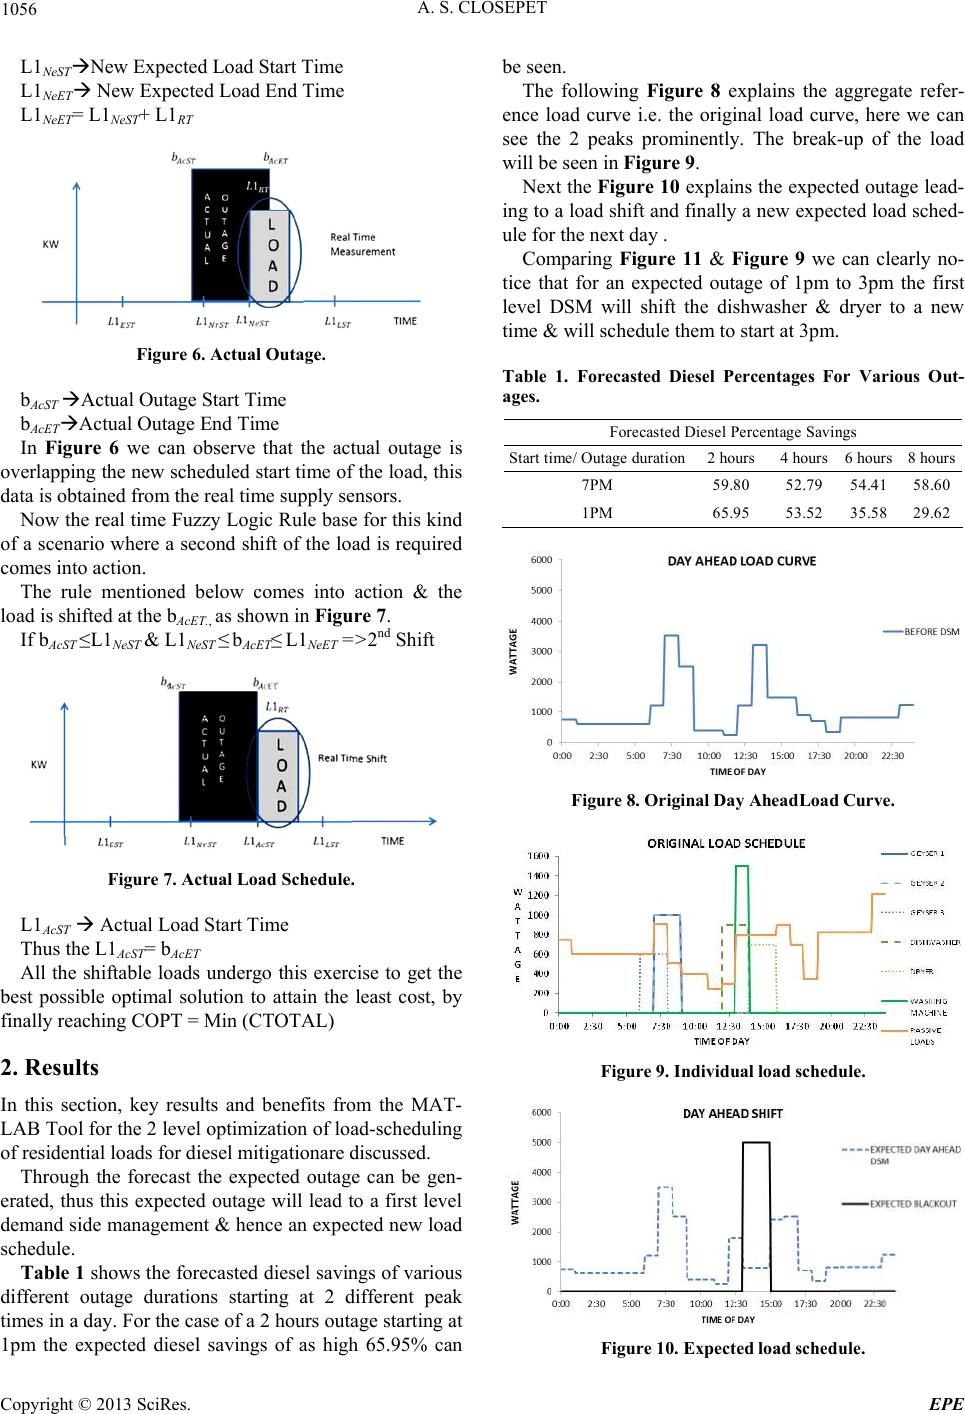 A. S. CLOSEPET 1056 L1NeSTNew Expected Load Start Time L1NeET New Expected Load End Time L1NeET= L1NeST+ L1RT Figure 6. Actual Outage. bAcST Actual Outage Start Time bAcETActual Outage End Time In Figure 6 we can observe that the actual outage is overlapping the new scheduled start time of the load, this data is obtained from the real time supply sensors. Now the real time Fuzzy Logic Rule base for this kind of a scenario where a second shift of the load is required comes into action. The rule mentioned below comes into action & the load is shifted at the bAcET., as shown in Figure 7. If bAcST ≤L1NeST & L1NeST ≤ bAcET≤ L1NeET =>2nd Shift Figure 7. Actual Load Schedule. L1AcST Actual Load Start Time Thus the L1AcST= bAcET All the shiftable loads undergo this exercise to get the best possible optimal solution to attain the least cost, by finally reaching COPT = Min (CTOTAL) 2. Results In this section, key results and benefits from the MAT- LAB Tool for the 2 level optimization of load-scheduling of residential loads for diesel mitigationare discussed. Through the forecast the expected outage can be gen- erated, thus this expected outage will lead to a first level demand side management & hence an expected new load schedule. Table 1 shows the forecasted diesel savings of various different outage durations starting at 2 different peak times in a day. For the case of a 2 hours outage starting at 1pm the expected diesel savings of as high 65.95% can be seen. The following Figure 8 explains the aggregate refer- ence load curve i.e. the original load curve, here we can see the 2 peaks prominently. The break-up of the load will be seen in Figure 9. Next the Figure 10 explains the expected outage lead- ing to a load shift and finally a new expected load sched- ule for the next day . Comparing Figure 11 & Figure 9 we can clearly no- tice that for an expected outage of 1pm to 3pm the first level DSM will shift the dishwasher & dryer to a new time & will schedule them to start at 3pm. Table 1. Forecasted Diesel Percentages For Various Out- ages. Forecasted Diesel Percentage Savings Start time/ Outage duration 2 hours 4 hours 6 hours 8 hours 7PM 59.80 52.79 54.41 58.60 1PM 65.95 53.52 35.58 29.62 Figure 8. Origin al Day Ah eadLoad C urve. Figure 9. Individual load schedule. Figure 10. Expe cted load schedu le. Copyright © 2013 SciRes. EPE 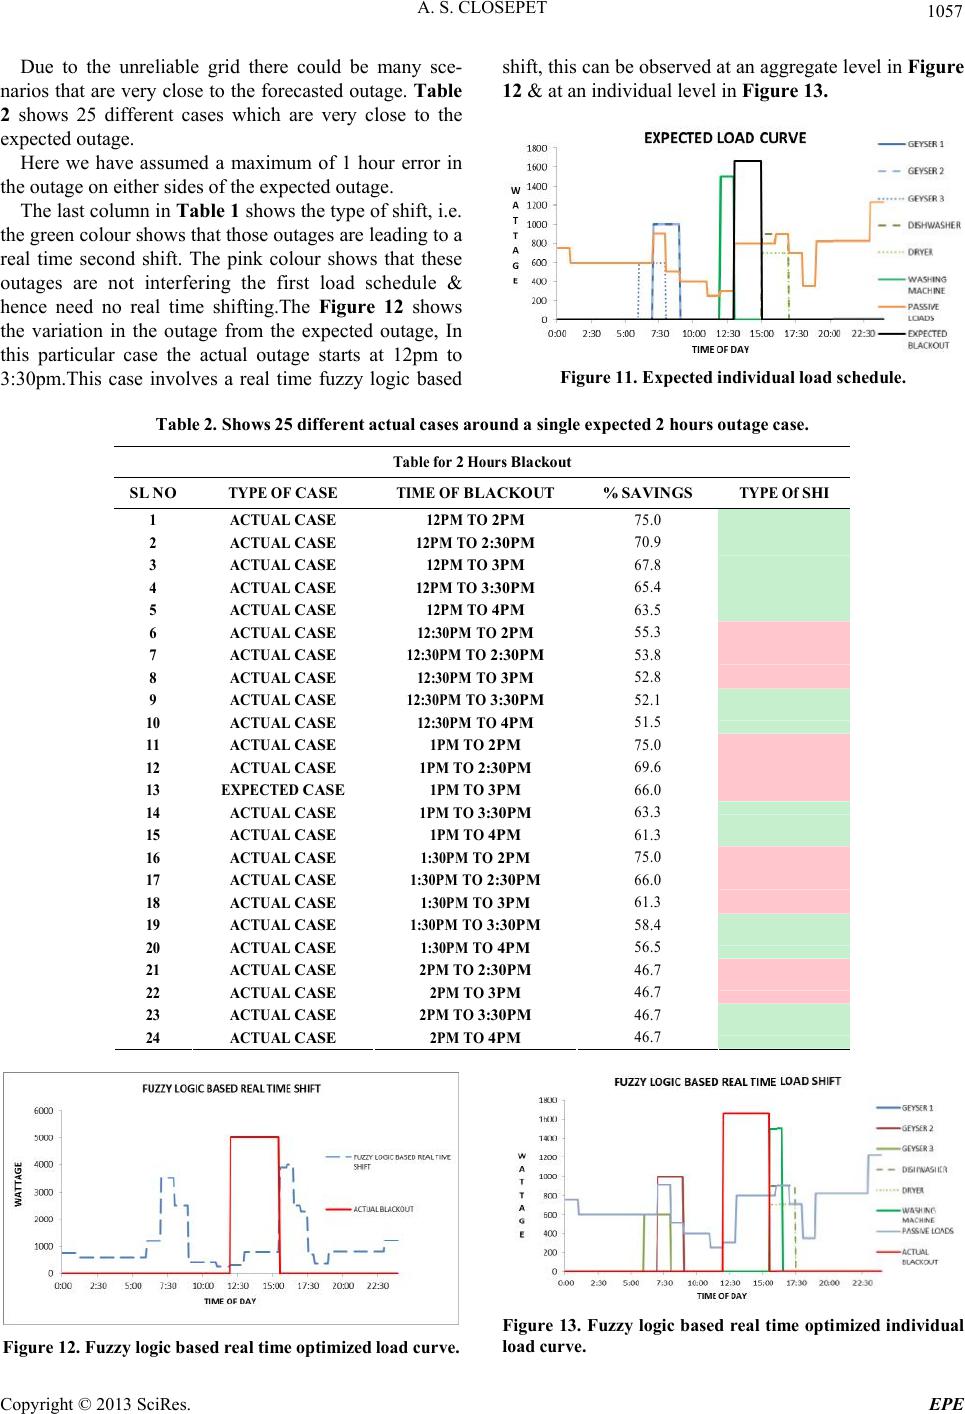 A. S. CLOSEPET Copyright © 2013 SciRes. EPE 1057 shift, this can be observed at an aggregate level in Figure 12 & at an individual level in Figure 13. Due to the unreliable grid there could be many sce- narios that are very close to the forecasted outage. Table 2 shows 25 different cases which are very close to the expected outage. Here we have assumed a maximum of 1 hour error in the outage on either sides of the expected outage. The last column in Table 1 shows the type of shift, i.e. the green colour shows that those outages are leading to a real time second shift. The pink colour shows that these outages are not interfering the first load schedule & hence need no real time shifting.The Figure 12 shows the variation in the outage from the expected outage, In this particular case the actual outage starts at 12pm to 3:30pm.This case involves a real time fuzzy logic based Figure 11. Expected individual load schedule. Table 2. Shows 25 different actual cases around a single expected 2 hours outage case. Table for 2 Hours Blackout SL NO TYPE OF CASE TIME OF BLACKOUT % SAVINGS TYPE Of SHI 1 ACTUAL CASE 12PM TO 2PM 75.0 2 ACTUAL CASE 12PM TO 2:30PM 70.9 3 ACTUAL CASE 12PM TO 3PM 67.8 4 ACTUAL CASE 12PM TO 3:30PM 65.4 5 ACTUAL CASE 12PM TO 4PM 63.5 6 ACTUAL CASE 12:30PM TO 2PM 55.3 7 ACTUAL CASE 12:30PM TO 2:30PM 53.8 8 ACTUAL CASE 12:30PM TO 3PM 52.8 9 ACTUAL CASE 12:30PM TO 3:30PM 52.1 10 ACTUAL CASE 12:30PM TO 4PM 51.5 11 ACTUAL CASE 1PM TO 2PM 75.0 12 ACTUAL CASE 1PM TO 2:30PM 69.6 13 EXPECTED CASE 1PM TO 3PM 66.0 14 ACTUAL CASE 1PM TO 3:30PM 63.3 15 ACTUAL CASE 1PM TO 4PM 61.3 16 ACTUAL CASE 1:30PM TO 2PM 75.0 17 ACTUAL CASE 1:30PM TO 2:30PM 66.0 18 ACTUAL CASE 1:30PM TO 3PM 61.3 19 ACTUAL CASE 1:30PM TO 3:30PM 58.4 20 ACTUAL CASE 1:30PM TO 4PM 56.5 21 ACTUAL CASE 2PM TO 2:30PM 46.7 22 ACTUAL CASE 2PM TO 3PM 46.7 23 ACTUAL CASE 2PM TO 3:30PM 46.7 24 ACTUAL CASE 2PM TO 4PM 46.7 Figure 13. Fuzzy lo gic base d real t ime optimi zed individ ual load curve. Figure 12. Fuzzy logic based r eal tim e optimiz ed load curve. 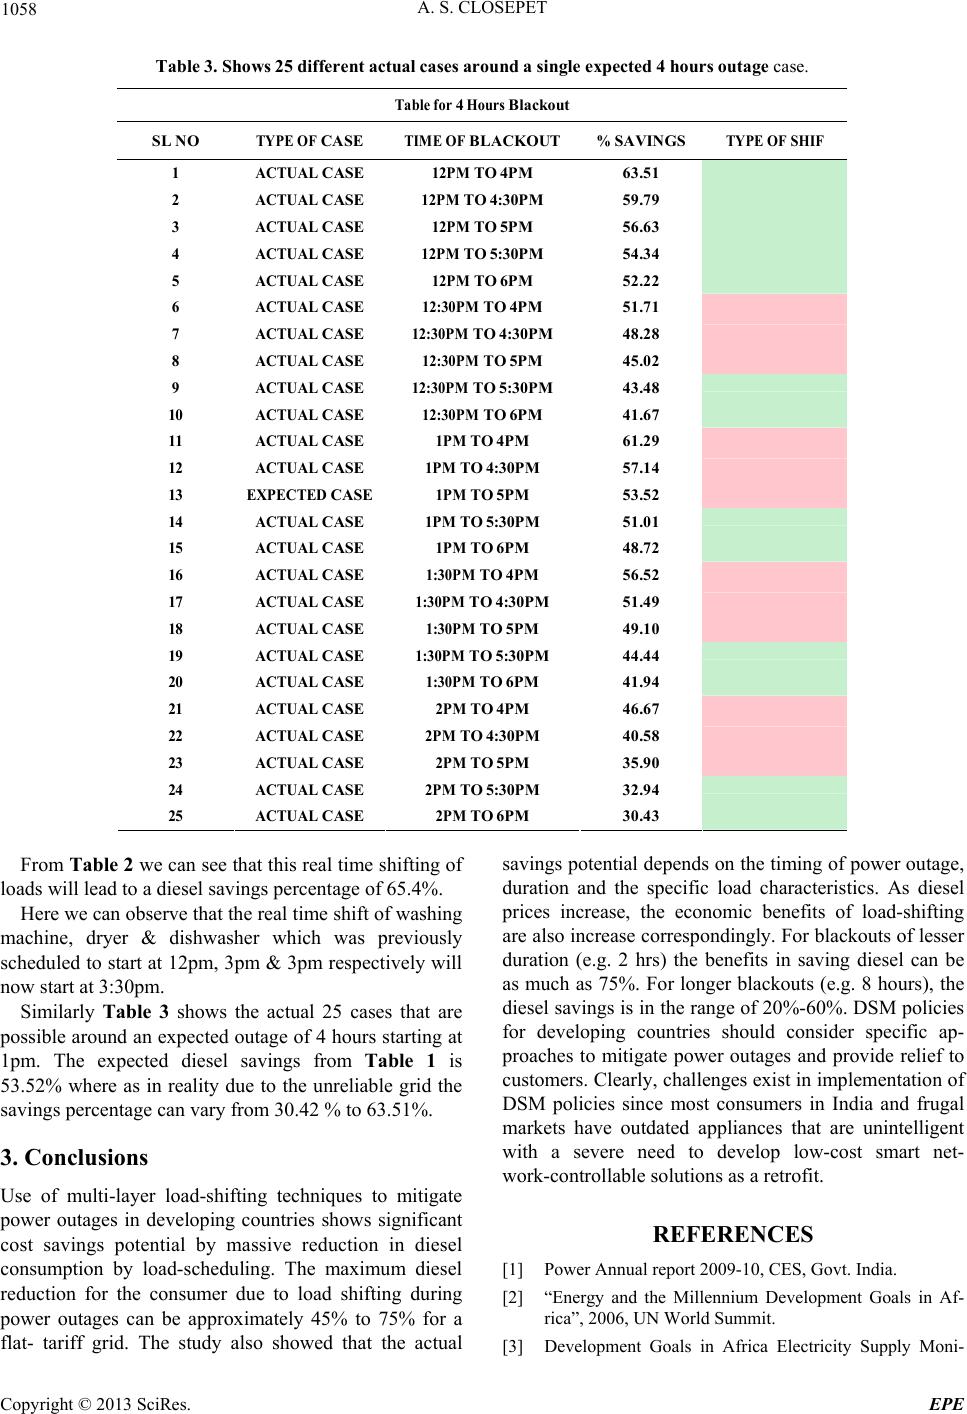 A. S. CLOSEPET 1058 Table 3. Shows 25 different actual cases ar ound a single expected 4 hours outage case. Table for 4 Hours Blackout SL NO TYPE OF CASE TIME OF BLACKOUT % SAVINGS TYPE OF SHIF 1 ACTUAL CASE 12PM TO 4PM 63.51 2 ACTUAL CASE 12PM TO 4:30PM 59.79 3 ACTUAL CASE 12PM TO 5PM 56.63 4 ACTUAL CASE 12PM TO 5:30PM 54.34 5 ACTUAL CASE 12PM TO 6PM 52.22 6 ACTUAL CASE 12:30PM TO 4PM 51.71 7 ACTUAL CASE 12:30PM TO 4: 30PM 48.28 8 ACTUAL CASE 12:30PM TO 5PM 45.02 9 ACTUAL CASE 12:30PM TO 5: 30PM 43.48 10 ACTUAL CASE 12:30PM TO 6PM 41.67 11 ACTUAL CASE 1PM TO 4PM 61.29 12 ACTUAL CASE 1PM TO 4:30PM 57.14 13 EXPECTED CASE 1PM TO 5PM 53.52 14 ACTUAL CASE 1PM TO 5:30PM 51.01 15 ACTUAL CASE 1PM TO 6PM 48.72 16 ACTUAL CASE 1:30PM TO 4PM 56.52 17 ACTUAL CASE 1:30PM TO 4:30PM 51.49 18 ACTUAL CASE 1:30PM TO 5PM 49.10 19 ACTUAL CASE 1:30PM TO 5:30PM 44.44 20 ACTUAL CASE 1:30PM TO 6PM 41.94 21 ACTUAL CASE 2PM TO 4PM 46.67 22 ACTUAL CASE 2PM TO 4:30PM 40.58 23 ACTUAL CASE 2PM TO 5PM 35.90 24 ACTUAL CASE 2PM TO 5:30PM 32.94 25 ACTUAL CASE 2PM TO 6PM 30.43 From Table 2 we can see that this real time shifting of loads will lead to a diesel savings percentage of 65.4%. Here we can observe that the real time shift of washing machine, dryer & dishwasher which was previously scheduled to start at 12pm, 3pm & 3pm respectively will now start at 3:30pm. Similarly Table 3 shows the actual 25 cases that are possible around an expected outage of 4 hours starting at 1pm. The expected diesel savings from Table 1 is 53.52% where as in reality due to the unreliable grid the savings percentage can vary from 30.42 % to 63.51%. 3. Conclusions Use of multi-layer load-shifting techniques to mitigate power outages in developing countries shows significant cost savings potential by massive reduction in diesel consumption by load-scheduling. The maximum diesel reduction for the consumer due to load shifting during power outages can be approximately 45% to 75% for a flat- tariff grid. The study also showed that the actual savings potential depends on the timing of power outage, duration and the specific load characteristics. As diesel prices increase, the economic benefits of load-shifting are also increase correspondingly. For blackouts of lesser duration (e.g. 2 hrs) the benefits in saving diesel can be as much as 75%. For longer blackouts (e.g. 8 hours), the diesel savings is in the range of 20%-60%. DSM policies for developing countries should consider specific ap- proaches to mitigate power outages and provide relief to customers. Clearly, challenges exist in implementation of DSM policies since most consumers in India and frugal markets have outdated appliances that are unintelligent with a severe need to develop low-cost smart net- work-controllable solutions as a retrofit. REFERENCES [1] Power Annual report 2009-10, CES, Govt. India. [2] “Energy and the Millennium Development Goals in Af- rica”, 2006, UN World Summit. [3] Development Goals in Africa Electricity Supply Moni- Copyright © 2013 SciRes. EPE 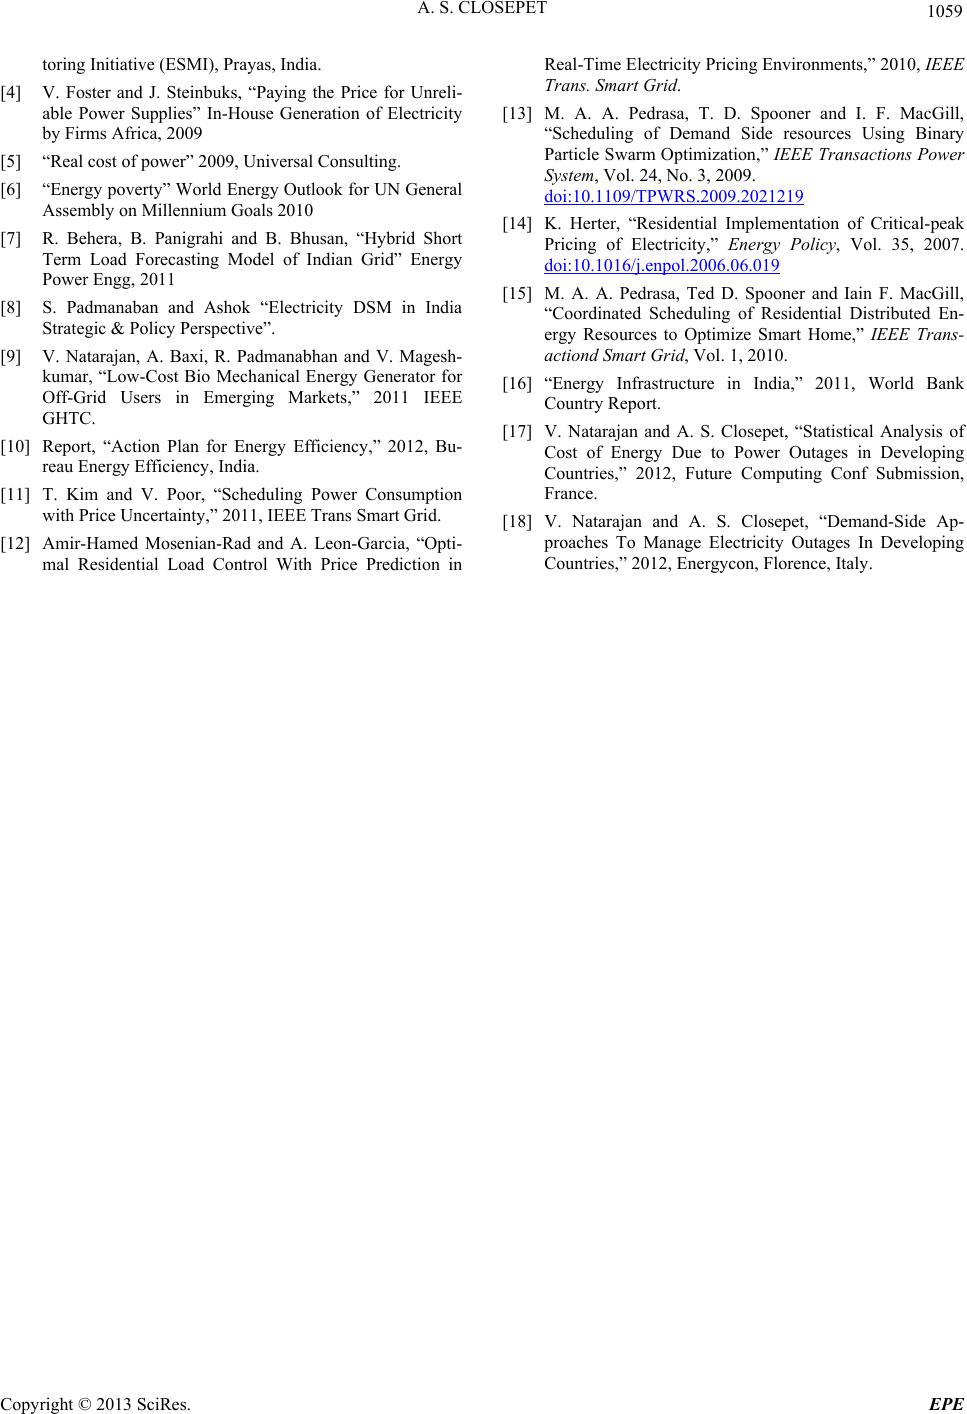 A. S. CLOSEPET 1059 toring Initiative (ESMI), Prayas, India. [4] V. Foster and J. Steinbuks, “Paying the Price for Unreli- able Power Supplies” In-House Generation of Electricity by Firms Africa, 2009 [5] “Real cost of power” 2009, Universal Consulting. [6] “Energy poverty” World Energy Outlook for UN General Assembly on Millennium Goals 2010 [7] R. Behera, B. Panigrahi and B. Bhusan, “Hybrid Short Term Load Forecasting Model of Indian Grid” Energy Power Engg, 2011 [8] S. Padmanaban and Ashok “Electricity DSM in India Strategic & Policy Perspective”. [9] V. Natarajan, A. Baxi, R. Padmanabhan and V. Magesh- kumar, “Low-Cost Bio Mechanical Energy Generator for Off-Grid Users in Emerging Markets,” 2011 IEEE GHTC. [10] Report, “Action Plan for Energy Efficiency,” 2012, Bu- reau Energy Efficiency, India. [11] T. Kim and V. Poor, “Scheduling Power Consumption with Price Uncertainty,” 2011, IEEE Trans Smart Grid. [12] Amir-Hamed Mosenian-Rad and A. Leon-Garcia, “Opti- mal Residential Load Control With Price Prediction in Real-Time Electricity Pricing Environments,” 2010, IEEE Trans. Smart Grid. [13] M. A. A. Pedrasa, T. D. Spooner and I. F. MacGill, “Scheduling of Demand Side resources Using Binary Particle Swarm Optimization,” IEEE Transactions Power System, Vol. 24, No. 3, 2009. doi:10.1109/TPWRS.2009.2021219 [14] K. Herter, “Residential Implementation of Critical-peak Pricing of Electricity,” Energy Policy, Vol. 35, 2007. doi:10.1016/j.enpol.2006.06.019 [15] M. A. A. Pedrasa, Ted D. Spooner and Iain F. MacGill, “Coordinated Scheduling of Residential Distributed En- ergy Resources to Optimize Smart Home,” IEEE Trans- actiond Smart Grid, Vol. 1, 2010. [16] “Energy Infrastructure in India,” 2011, World Bank Country Report. [17] V. Natarajan and A. S. Closepet, “Statistical Analysis of Cost of Energy Due to Power Outages in Developing Countries,” 2012, Future Computing Conf Submission, France. [18] V. Natarajan and A. S. Closepet, “Demand-Side Ap- proaches To Manage Electricity Outages In Developing Countries,” 2012, Energycon, Florence, Italy. Copyright © 2013 SciRes. EPE |