

Paper Menu >>
Journal Menu >>
 Journal of Cancer Therapy, 2013, 4, 1403-1410 Published Online November 2013 (http://www.scirp.org/journal/jct) http://dx.doi.org/10.4236/jct.2013.49167 Open Access JCT 1403 Plasma Levels of Angiotensin-Converting Enzymes 1 and 2 and AGTR2 (T1247G and A5235G) Gene Polymorphisms Are Associated to Breast Cancer Progression* Maria Del Carmen Garcia Molina Wolgien1, Ismael Dale Cotrim Guerreiro da Silva1, Afonso Celso Pinto Nazário1, Clovis Riyuchi Nakaie2, Silvana Aparecida Alves Corrêa de Noronha3, Samuel Marcos Ribeiro de Noronha3, Gil Facina1 1Gynecology Department, Escola Paulista de Medicina/Universidade Federal de São Paulo (EPM-UNIFESP), São Paulo, Brazil; 2Biophisics Department, Escola Paulista de Medicina da Universidade Federal de São Paulo (EPM-UNIFESP), São Paulo, Brazil; 3Surgery Department, Escola Paulista de Medicina/Universidade Federal de São Paulo (EPM-UNIFESP), São Paulo, Brazil. [email protected], labgineco@globo.com, [email protected] Received October 4th, 2013; revised November 1st, 2013; accepted November 9th, 2013 Copyright © 2013 Maria Del Carmen Garcia Molina Wolgien et al. This is an open access article distributed under the Creative Commons Attribution License, which permits unrestricted use, distribution, and reproduction in any medium, provided the original work is properly cited. ABSTRACT Background: Breast cancer is the most common type of cancer among women. Diagnosed and treated timely, patients may have good prognostics. In Brazil, in 2012, the estimate of new cases was 52,680 and the number of registered deaths in 2012 was 12,852. The Renin-Angiotensin System (RAS) is known for its role in arterial hypertension and in other cardiovascular diseases. Angiotensin-Converting Enzyme 2 (ACE2) is the key to Ang-(1-7) formation, and coun- terbalances the ACE1/AngII/AGTR1 axis actions. RAS components have complex interactions with different tissues and their actions are not restricted to the cardiovascular system. Recently, the RAS has been associated with different types of cancers and in particular with gynecological cancers. Objectives: Our aim is to investigate possible associa- tions between allelic distribution of two genetic polymorphisms in the AGTR2 receptor with ACEs 1 and 2 plasma lev- els among women with breast cancer. Patients and Methods: Patients with breast cancer were genotyped for two poly- morphisms of the AGTR2 (T1247G and A5235G). Genotyping assays (TaqMan) were performed with genomic DNA extracted from blood cells. ACEs plasma level measurements were conducted in women from the breast-cancer group (N = 53). ACEs were measured in the plasma of these patients using ELISA kits. Results: SNPs genotype distribution is correlated with ACEs plasma levels. ACEs plasma levels are also correlated with clinical variables and ACE2 high levels are associated with better prognostics. Conclusions: Changes in circulating levels of ECA1/AngII ECA2/ Ang-(1-7) determine the magnitude of the inflammatory response that an individual can trigger and the variation in ACE 1 and 2 plasma level measurements in the blood of breast cancer patients suggests an association with the process of mammary carcinogenesis. Thus, the RAS may be associated with the process of mammary carcinogenesis by both genotypic variations of RAS components and by circulating levels of ACEs. Keywords: Angiotensin-Converting Enzyme 1; Angiotensin-Converting Enzyme 2; Angiotensin II Type 2 Receptor; Breast Neoplasm; ACEs Plasma Level; Genetic Polymorphisms 1. Introduction Breast cancer can be defined as a malignant proliferation of epithelial cells that line the ducts and lobules of the breast [1]. Generally, cancer is considered as a disease that originates from progressive genetic alterations in oncogenes and in tumor suppressor genes combined to chromosomal abnormalities [2]. Breast cancer is among the most frequently diagnosed cancers and the second leading cause of cancer death among U.S. women [3]. 22% of new cancer cases in women around the world are caused by malignancies of the breast. In Brazil, as in *Funding: This work was supported by the Sao Paulo State Research Foundation (FAPESP) by Grants numbers 2007/56480-0, 2008/50776- 7, and 2008/54383-0. Conflict of interest statement: None declared.  Plasma Levels of Angiotensin-Converting Enzymes 1 and 2 and AGTR2 (T1247G and A5235G) Gene Polymorphisms Are Associated to Breast Cancer Progression 1404 many other countries, the incidence of breast cancer has been increasing. In 2012, 52,680 new cases of the disease were estimated. There are risk factors classically associated with breast cancer, like sex (99% women), age (generally over 40 years), personal history for cancer (risk goes up based on previously found gynecological cancers), family history, menstrual history (early menarche and late menopause increase risk), obstetric history (increased risk for nul- liparous and primiparous over 35 years), nutritional fac- tors (high-fat diets and intake of alcohol abuse are asso- ciated with an increased risk) and genetic (gene muta- tions in BRCA 1 and 2) [1]. More recently, as the number of studies on the inte- grated operation of RAS components increases, the RAS is no longer interpreted only as a linear proteolytic cas- cade, but instead, as a complex humoral system in which several agonists, besides the traditional AngII, may be bound to multiple receptors, and offset the effects of each other to control the (in)activation of different intracellular pathways [4]. Angiotensin-Converting Enzyme 2 (ACE2) seems to be the key to Ang-(1-7) formation which coun- terbalances ACE1/AngII/AGTR1 axis effects. RAS com- ponents have complex interactions with different tissues and their actions are not restricted to the cardiovascular system. Among the recent approaches to study the RAS, it is noteworthy to mention the two-axis concept, in which one axis is composed of the peptidase Angiotensin- Converting Enzyme 2 (ACE2), the hormone Ang-(1-7) and the receptor MAS1, synergistically acting on organs like the heart, liver and kidneys, and having opposite actions to those assigned to the traditional ECA1/AngII/ AGTR1 axis [5]. Nowadays, Ang-(1-7) is robustly asso- ciated with hypotensional actions and with inhibition of calcium release from intracellular stores and with volt- age-dependent calcium channel inactivation. This hep- tapetide hormone also inhibits inflammatory pathways and activates proapoptotic signals, in a tissue-specific pattern [6,7]. Peptidase activity of ACE2 seems to be the key to Ang-(1-7) formation, which counterbalances effects triggered by the ACE1/AngII/AGTR1 axis. RAS compo- nents have complex interactions with different tissues and their actions are not restricted to the cardiovascular system [8,9]. Studies about the role of the AGTR2 re- ceptor in these recent approaches of the RAS are lacking. 2. Patients and Methods 2.1. Patients Fifty-three (53) women with histologically confirmed breast cancer were included in this study. Breast cancer patients were admitted to and treated at the Mastology Section, Division of Gynecology and Obstetrics, in Hospital Sao Paulo, Sao Paulo, Brazil. Control group women were admitted to the Menopause session/Gynecology Depart- ment, also in Hospital Sao Paulo, Sao Paulo, Brazil. Ad- missions occurred from December 2009 to December 2012. A structured questionnaire was applied to obtain detailed information on demographic factors, as well as menstrual and reproductive history. Clinical variables like TNM category and axillary lymph node status were also assessed in breast cancer patients. This study is ap- proved by the Research Ethics Committee (REC) of the Federal University of São Paulo under number 0424/09. 2.2. DNA Extraction Blood samples were collected and immediately stored at −80˚C for posterior genomic DNA extraction. DNA ex- traction was performed through GFX® Kit for blood cells (GE HealthCare Life Sciences, Pittsburg, USA) accord- ing to the manufacturer’s instructions. 2.3. AGTR2 SNPs Genotypin g The Custom TaqMan® SNP Genotyping Assays (AGTR2) (Applied Biosystems, Palo Alto, CA, USA) were used for allelic discrimination, with a 40X PCR mix (Applied Biosystems, Palo Alto, CA, US) specific to each AGTR2 SNP studied (T1247G rs5950584 and A5235G rs1403543). This Assays-by-DesignSM (Applied Biosys- tems, Palo Alto, CA, USA) is an assay for SNP genotype- ing and gene expression based on sequence information (Table 1) submitted by the customer. To obtain specific DNA sequences amplification, we employed a 7500 Real-Time PCR system (Applied Biosystems, Palo Alto, CA, USA) using 10 μl of TaqMan® Universal PCR Mas- ter Mix, No AmpErase® UNG (2X), 0.5 l of specific assay mix (T1247G and A5235G) containing the primers and probes, 1 to 20 ng of genomic DNA and sterile water for a total volume of 20 μl. PCR conditions were an ad- ditional step at 50˚C for 2 minutes, and an initial step at Table 1. Sequences that contained the mutation region for each one of polymorphisms studied using Assays-by-Design service, or TaqMan® SNP Genotyping Assays (AGTR2) (Applied Biosystems). Polymorphisms Sequences and mutations used for TaqMan® SNP Genotyping Assays AGTR2-T1247G (rs5950584; Chr X) (Pre-designed assay) AGTR2-A5235G (rs1403543; Chr X intron) (Pre-designed assay) GACAGGAGTTTACGATTATT[T/G] GGTTGACCATTTTTTAA TTAACACTGTATTTTGCAAAACTC CT[A/G]AATTATTTAGCTGCTGTTT CTCTTA Open Access JCT  Plasma Levels of Angiotensin-Converting Enzymes 1 and 2 and AGTR2 (T1247G and A5235G) Gene Polymorphisms Are Associated to Breast Cancer Progression 1405 95˚C for 10 minutes, followed by 40 cycles of denaturing to 92˚C for 15 seconds and annealing/extension at 60˚C for 1 minute. A negative control without template DNA was used in each run. The allelic discrimination was de- termined by analysis using SDS Software v. 1.3.1 (Ap- plied Biosystem®s, Palo Alto, CA, USA). 2.4. Measurement of ACEs 1 and 2 in Plasma Blood plasma samples were collected from the 53 wo- men of the breast cancer group, the anticoagulant EDTA was added, and these samples were centrifuged for 15 minutes at 1000 xg at 2˚C - 8˚C. The plasma removed was stored at −80˚C until use. Plasma levels of ACEs 1 and 2 were measured with commercial ELISA kits (Uscn Life Science Inc., Wuhan, China). ELISA standard curves were generated with the diluent standard kit seri- ally diluted to obtain seven different concentration points (25 ng/ml; 12.5 ng/ml, 6.25 ng/ml, 3.12 ng/ml, 1.56 ng/ml, 0.78 ng/ml, 0.39 ng/ml; white and 0 ng/ml). Next, plasma samples were thawed at RT and diluted 1:100 in PBS 0.02 mol/L (pH = 7.0 to 7.2). Then, 100 mL of each sample, the white point and the seven dilution ones were placed in a 96-well assay plate coated with monoclonal antibody specific for ACEs 1 and 2. These specimens were incubated for 2 h at 37˚C. After this first incubation period, the liquid was removed without washing and 100 mL of detection reagent A (polyclonal antibody conju- gated to biotin specific for ACEs 1 and 2) were added. The plate containing the sample was again incubated for 1 h at 37˚C, and then sealed. After this second incubation period, the solution was aspirated and washed with 350 μl of the kit wash solution for 1.5 min. The plate was dried out on paper towels. Rinsing was performed three times. Next, 100 mL of detection reagent B (radish per- oxidase conjugated to avidin HRP) working solution were added and the sealed plates were incubated for 30 min at 37˚C. Plates were washed again (repeating proce- dure described above) and 90 µl of TMB Substrate Solu- tion were added to each well and the plate was again in- cubated for 15 minutes at 37˚C protected from light. Fi- nally, 50 mL of the kit stop solution (sulfuric acid) were added and the plate was brought to a microplate reader where spectrophotometric readings at 450 nm were made. Each reading was taken in duplicates to obtain average values and each standard and target sample was sub- tracted from the average zero standard optical density. GraphPad Prism 5.0 was used to generate a standard curve (as recommended by the manufacturer), displaying the ACE concentration, in the y-axis, and absorbance, in the x-axis. The detection limits for the ACE1 assay is ECA1 0.39 - 25 ng/mL, being 0.14 ng/mL the minimum detectable dose. For ACE2, the detection limits are 0.78 - 50 ng/mL, being the minimum detectable dose equal to 0.27 ng/mL. 3. Results 3.1. AGTR2 SNPs Allelic Distribution and Association with Breast Cancer Among the two polymorphisms here studied, there could only be found an association between allelic distributions with case/control groups for SNP AGTR2 (A5235G). However, both SNPs of the AGTR2 were associated with at least one clinical variable (data not shown). 3.2. Correlation of ACE1 Plasma Levels with AGTR2 SNPs Allelic Distribution and with Clinical Variables Plasma levels of ACE1 in breast cancer patients ranged from 0.16 ng/ml to 115 ng/ml. For data analysis, these patients were divided into three groups (0.1 - 1.0; 1.0 to 10, and >10 ng/ml) according to ACE1 plasma levels. In each of these three groups, the following ACE1 plasma levels were detected [mean ± SE (N)], respectively: [0.37 ± 0.04 (27)], [3.9 ± 0.8 (13)], [48.6 ± 0, 04 (13)]. After that, genotype distribution for the AGTR2 polymor- phisms according to descriptive and/or clinical variables (age, clinical stage, presence of lymph node metastasis and histological grade) were correlated to the plasma le- vels of ACE1 among these patients. Correlation of ACE1 plasma levels with AG TR2 (A5235G) SNP genotype distribution—The SNP A5235G genotype distribution correlated with plasma levels of ACE1 (p < 0.0001***, chi-square), being the highest ACE2 plasma levels (0.1 to 1.0ng/ml) the most abundant level detected among homozygous GG individuals (GG = 54%), intermediary levels (1.0 to 10.0 ng/ml) predomi- nated among homozygous AA individuals (38%) and lower ACE1 levels (<0.1 ng/ml) among heterozygous ones (52%) (Figure 1(a)). Correlation of ACE1 plasma levels with AG TR2 (T1247G) SNP genotype distribution—The SNP A5235G genotype distribution correlated with plasma levels of ACE1 (p = 0.0027**, chi-square). Most of the patients are homozygous TT carriers and, among these, intermediary ACE1 plasma levels predominated (88%). Higher ACE1 plasma levels predominated among heterozygous patients and, curiously, only lower ACE1 plasma levels were de- tected among GG carriers (Figure 1(b)). Correlation of ACE1 plasma levels with age—No sta- tistically significant difference could be observed in the age of the three ACE1 plasma levels groups (p = 0.69, t test). The age of these patients in years (mean ± sd) in each ACE2 concentration range were: ACE1 from 0.1 to 1.0 ng/ml (59 ± 12), ACE1 from 1.0 to 10.0 ng/ml (55 ± 19) and ACE1 > 10 ng/ml (57 ± 14) (Figure 2). Open Access JCT 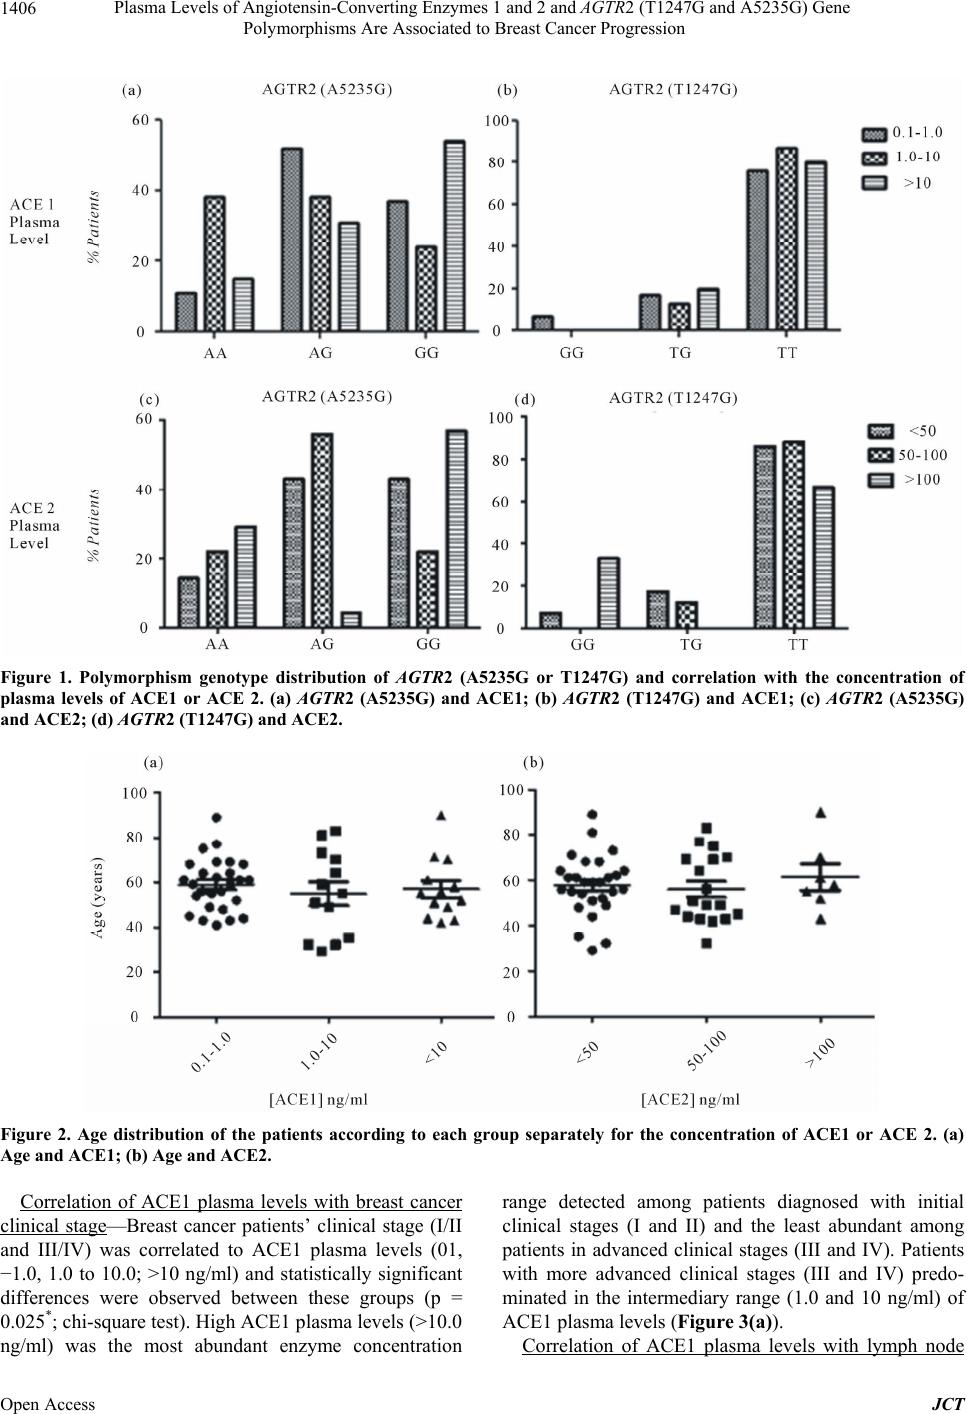 Plasma Levels of Angiotensin-Converting Enzymes 1 and 2 and AGTR2 (T1247G and A5235G) Gene Polymorphisms Are Associated to Breast Cancer Progression Open Access JCT 1406 Figure 1. Polymorphism genotype distribution of AGTR2 (A5235G or T1247G) and correlation with the concentration of plasma levels of ACE1 or ACE 2. (a) AGTR2 (A5235G) and ACE1; (b) AGTR2 (T1247G) and ACE1; (c) AGTR2 (A5235G) and ACE2; (d) AGTR2 (T1247G) and ACE2. Figure 2. Age distribution of the patients according to each group separately for the concentration of ACE1 or ACE 2. (a) Age and ACE1; (b) Age and ACE2. Correlation of ACE1 plasma levels with breast cancer clinical stage—Breast cancer patients’ clinical stage (I/II and III/IV) was correlated to ACE1 plasma levels (01, −1.0, 1.0 to 10.0; >10 ng/ml) and statistically significant differences were observed between these groups (p = 0.025*; chi-square test). High ACE1 plasma levels (>10.0 ng/ml) was the most abundant enzyme concentration range detected among patients diagnosed with initial clinical stages (I and II) and the least abundant among patients in advanced clinical stages (III and IV). Patients with more advanced clinical stages (III and IV) predo- minated in the intermediary range (1.0 and 10 ng/ml) of ACE1 plasma levels (Figure 3( a )). Correlation of ACE1 plasma levels with lymph node  Plasma Levels of Angiotensin-Converting Enzymes 1 and 2 and AGTR2 (T1247G and A5235G) Gene Polymorphisms Are Associated to Breast Cancer Progression 1407 Figure 3. Classification of clinical stage, lymph node status and histological grade for each of the patients according to the correlation with the concentration of plasma levels of ACE1 or ACE 2. (a) Clinical stage and ACE1; (b) Lymph node status and ACE1; (c) Histological grade and ACE1; (d) Clinical stage and ACE2; (e) Lymph node status and ACE2; (f) Histological grade and ACE2. status—Statistically significant differences were observed between the groups (p = 0.0019**; chi-square test), High ACE1 plasma levels (>10.0 ng/ml) was the most abun- dant enzyme concentration range detected among pa- tients with negative lymph node status and the least abundant among patients with positive lymph node status. Intermediary ACE1 plasma levels (1.0 to 10.0 ng/ml) predominated among patients with positive lymph node status (Figure 3 (b)). Correlation of ACE1 plasma levels with histological grade—Statistically significant differences were observed between the groups (p = 0.0029**; chi-square test), being the intermediary ACE1 plasma levels the most abundant concentration among patients with histological grade G3 and the least abundant among patients with histological grades G1 and G2 (Figure 3(c)). 3.3. Correlation of ACE2 Plasma Levels with AGTR2 SNPs Allelic Distribution and with Clinical Variables Plasma levels of ACE2 in breast cancer patients ranged from 27.5 ng/ml to 108.5 ng/ml. For data analysis, these patients were divided into three groups (<50; 50 - 100; e >100 ng/ml) according to ACE2 plasma levels. In each of these three groups, the following ACE2 plasma levels were obtained [mean ± SE (N)], respectively: [39.7 ± 1.3 (28)]; [64.5 ± 3.6 (18)]; [105.3 ± 1.00 (7)]. After that, genotype distribution for the AGTR2 polymorphisms ac- cording to descriptive and/or clinical variables (age, cli- nical stage, presence of lymph node metastasis and his- tological grade) were correlated to the plasma levels of ACE1 among these patients. Correlation of ACE2 plasma levels with AG TR2 (A5235G) SNP genotype distribution—The SNP A5235G genotype distribution correlated with plasma levels of ACE2 (p < 0.0001***, chi-square), being the highest ACE2 plasma levels (>100 ng/ml) the most abundant level detected among homozygous individuals (AA = 29% and GG = 58%) and intermediary levels (50 to 100 ng/ml) predominated among heterozygous individuals (AG = 56%) (Figure 1(c)). Correlation of ACE2 plasma levels with AG TR2 (T1247G) SNP genotype distribution—The SNP T1247G genotype distribution correlated with plasma levels of ACE1 (p < 0.0001**, chi-square), being the highest ACE2 plasma levels (>100 ng/ml) the most abundant level de- tected among polymorphic homozygous individuals (GG = 37%), lower levels (<50 ng/ml) among heterozygous ones (TG = 17%) and intermediary levels among homo- zygous (TT = 88%). Curiously, no GG carriers were de- tected with intermediary ACE2 plasma levels, nor were detected heterozygous ones with intermediary levels (Figure 1(d)). Correlation of ACE2 plasma levels with age—No sta- tistically significant difference could be observed in the Open Access JCT 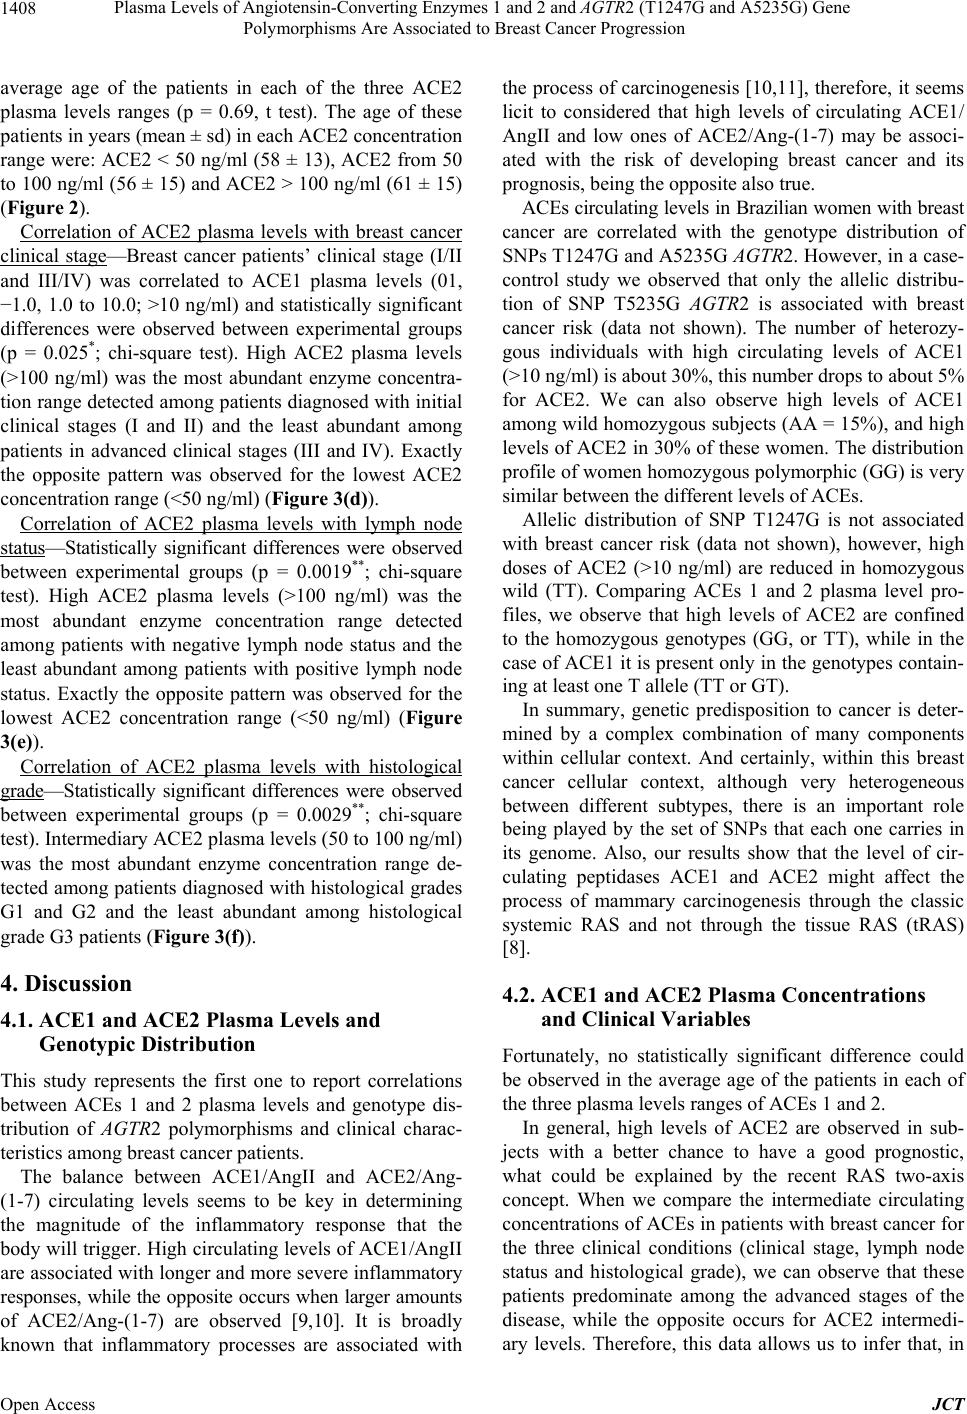 Plasma Levels of Angiotensin-Converting Enzymes 1 and 2 and AGTR2 (T1247G and A5235G) Gene Polymorphisms Are Associated to Breast Cancer Progression 1408 average age of the patients in each of the three ACE2 plasma levels ranges (p = 0.69, t test). The age of these patients in years (mean ± sd) in each ACE2 concentration range were: ACE2 < 50 ng/ml (58 ± 13), ACE2 from 50 to 100 ng/ml (56 ± 15) and ACE2 > 100 ng/ml (61 ± 15) (Figure 2). Correlation of ACE2 plasma levels with breast cancer clinical stage—Breast cancer patients’ clinical stage (I/II and III/IV) was correlated to ACE1 plasma levels (01, −1.0, 1.0 to 10.0; >10 ng/ml) and statistically significant differences were observed between experimental groups (p = 0.025*; chi-square test). High ACE2 plasma levels (>100 ng/ml) was the most abundant enzyme concentra- tion range detected among patients diagnosed with initial clinical stages (I and II) and the least abundant among patients in advanced clinical stages (III and IV). Exactly the opposite pattern was observed for the lowest ACE2 concentration range (<50 ng/ml) (Figure 3(d)). Correlation of ACE2 plasma levels with lymph node status—Statistically significant differences were observed between experimental groups (p = 0.0019**; chi-square test). High ACE2 plasma levels (>100 ng/ml) was the most abundant enzyme concentration range detected among patients with negative lymph node status and the least abundant among patients with positive lymph node status. Exactly the opposite pattern was observed for the lowest ACE2 concentration range (<50 ng/ml) (Figure 3(e)). Correlation of ACE2 plasma levels with histological grade—Statistically significant differences were observed between experimental groups (p = 0.0029**; chi-square test). Intermediary ACE2 plasma levels (50 to 100 ng/ml) was the most abundant enzyme concentration range de- tected among patients diagnosed with histological grades G1 and G2 and the least abundant among histological grade G3 patients (Figure 3(f)). 4. Discussion 4.1. ACE1 and ACE2 Plasma Levels and Genotypic Distribution This study represents the first one to report correlations between ACEs 1 and 2 plasma levels and genotype dis- tribution of AGTR2 polymorphisms and clinical charac- teristics among breast cancer patients. The balance between ACE1/AngII and ACE2/Ang- (1-7) circulating levels seems to be key in determining the magnitude of the inflammatory response that the body will trigger. High circulating levels of ACE1/AngII are associated with longer and more severe inflammatory responses, while the opposite occurs when larger amounts of ACE2/Ang-(1-7) are observed [9,10]. It is broadly known that inflammatory processes are associated with the process of carcinogenesis [10,11], therefore, it seems licit to considered that high levels of circulating ACE1/ AngII and low ones of ACE2/Ang-(1-7) may be associ- ated with the risk of developing breast cancer and its prognosis, being the opposite also true. ACEs circulating levels in Brazilian women with breast cancer are correlated with the genotype distribution of SNPs T1247G and A5235G AG TR2. However, in a case- control study we observed that only the allelic distribu- tion of SNP T5235G AGTR2 is associated with breast cancer risk (data not shown). The number of heterozy- gous individuals with high circulating levels of ACE1 (>10 ng/ml) is about 30%, this number drops to about 5% for ACE2. We can also observe high levels of ACE1 among wild homozygous subjects (AA = 15%), and high levels of ACE2 in 30% of these women. The distribution profile of women homozygous polymorphic (GG) is very similar between the different levels of ACEs. Allelic distribution of SNP T1247G is not associated with breast cancer risk (data not shown), however, high doses of ACE2 (>10 ng/ml) are reduced in homozygous wild (TT). Comparing ACEs 1 and 2 plasma level pro- files, we observe that high levels of ACE2 are confined to the homozygous genotypes (GG, or TT), while in the case of ACE1 it is present only in the genotypes contain- ing at least one T allele (TT or GT). In summary, genetic predisposition to cancer is deter- mined by a complex combination of many components within cellular context. And certainly, within this breast cancer cellular context, although very heterogeneous between different subtypes, there is an important role being played by the set of SNPs that each one carries in its genome. Also, our results show that the level of cir- culating peptidases ACE1 and ACE2 might affect the process of mammary carcinogenesis through the classic systemic RAS and not through the tissue RAS (tRAS) [8]. 4.2. ACE1 and ACE2 Plasma Concentrations and Clinical Variables Fortunately, no statistically significant difference could be observed in the average age of the patients in each of the three plasma levels ranges of ACEs 1 and 2. In general, high levels of ACE2 are observed in sub- jects with a better chance to have a good prognostic, what could be explained by the recent RAS two-axis concept. When we compare the intermediate circulating concentrations of ACEs in patients with breast cancer for the three clinical conditions (clinical stage, lymph node status and histological grade), we can observe that these patients predominate among the advanced stages of the disease, while the opposite occurs for ACE2 intermedi- ary levels. Therefore, this data allows us to infer that, in Open Access JCT 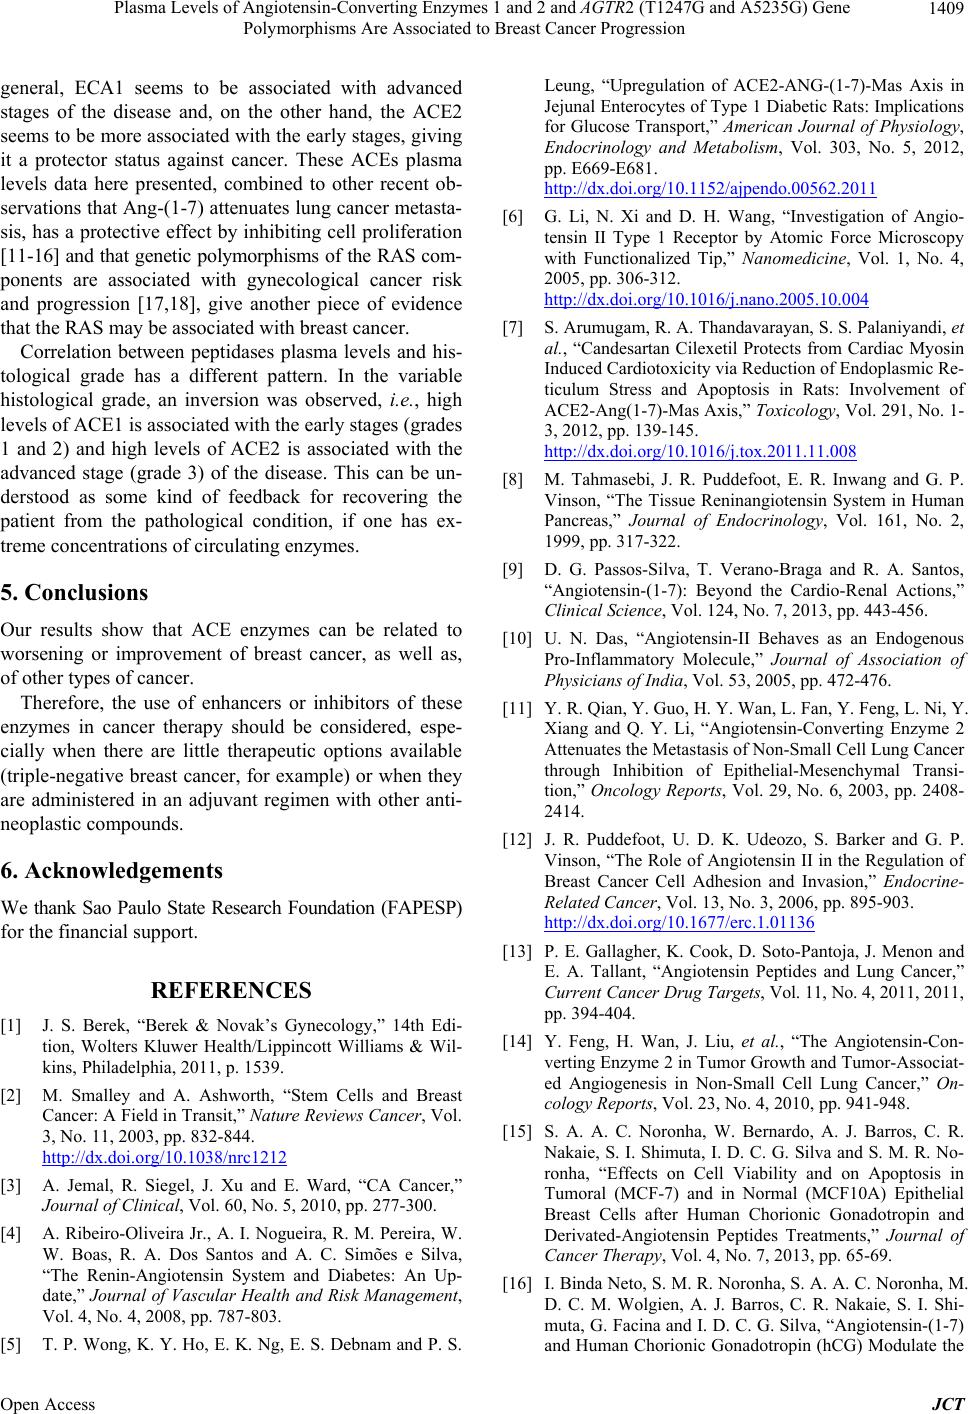 Plasma Levels of Angiotensin-Converting Enzymes 1 and 2 and AGTR2 (T1247G and A5235G) Gene Polymorphisms Are Associated to Breast Cancer Progression 1409 general, ECA1 seems to be associated with advanced stages of the disease and, on the other hand, the ACE2 seems to be more associated with the early stages, giving it a protector status against cancer. These ACEs plasma levels data here presented, combined to other recent ob- servations that Ang-(1-7) attenuates lung cancer metasta- sis, has a protective effect by inhibiting cell proliferation [11-16] and that genetic polymorphisms of the RAS com- ponents are associated with gynecological cancer risk and progression [17,18], give another piece of evidence that the RAS may be associated with breast cancer. Correlation between peptidases plasma levels and his- tological grade has a different pattern. In the variable histological grade, an inversion was observed, i.e., high levels of ACE1 is associated with the early stages (grades 1 and 2) and high levels of ACE2 is associated with the advanced stage (grade 3) of the disease. This can be un- derstood as some kind of feedback for recovering the patient from the pathological condition, if one has ex- treme concentrations of circulating enzymes. 5. Conclusions Our results show that ACE enzymes can be related to worsening or improvement of breast cancer, as well as, of other types of cancer. Therefore, the use of enhancers or inhibitors of these enzymes in cancer therapy should be considered, espe- cially when there are little therapeutic options available (triple-negative breast cancer, for example) or when they are administered in an adjuvant regimen with other anti- neoplastic compounds. 6. Acknowledgements We thank Sao Paulo State Research Foundation (FAPESP) for the financial support. REFERENCES [1] J. S. Berek, “Berek & Novak’s Gynecology,” 14th Edi- tion, Wolters Kluwer Health/Lippincott Williams & Wil- kins, Philadelphia, 2011, p. 1539. [2] M. Smalley and A. Ashworth, “Stem Cells and Breast Cancer: A Field in Transit,” Nature Reviews Cancer, Vol. 3, No. 11, 2003, pp. 832-844. http://dx.doi.org/10.1038/nrc1212 [3] A. Jemal, R. Siegel, J. Xu and E. Ward, “CA Cancer,” Journal of Clinical, Vol. 60, No. 5, 2010, pp. 277-300. [4] A. Ribeiro-Oliveira Jr., A. I. Nogueira, R. M. Pereira, W. W. Boas, R. A. Dos Santos and A. C. Simões e Silva, “The Renin-Angiotensin System and Diabetes: An Up- date,” Journal of Vascular Health and Risk Management, Vol. 4, No. 4, 2008, pp. 787-803. [5] T. P. Wong, K. Y. Ho, E. K. Ng, E. S. Debnam and P. S. Leung, “Upregulation of ACE2-ANG-(1-7)-Mas Axis in Jejunal Enterocytes of Type 1 Diabetic Rats: Implications for Glucose Transport,” American Journal of Physiology, Endocrinology and Metabolism, Vol. 303, No. 5, 2012, pp. E669-E681. http://dx.doi.org/10.1152/ajpendo.00562.2011 [6] G. Li, N. Xi and D. H. Wang, “Investigation of Angio- tensin II Type 1 Receptor by Atomic Force Microscopy with Functionalized Tip,” Nanomedicine, Vol. 1, No. 4, 2005, pp. 306-312. http://dx.doi.org/10.1016/j.nano.2005.10.004 [7] S. Arumugam, R. A. Thandavarayan, S. S. Palaniyandi, et al., “Candesartan Cilexetil Protects from Cardiac Myosin Induced Cardiotoxicity via Reduction of Endoplasmic Re- ticulum Stress and Apoptosis in Rats: Involvement of ACE2-Ang(1-7)-Mas Axis,” Toxicology, Vol. 291, No. 1- 3, 2012, pp. 139-145. http://dx.doi.org/10.1016/j.tox.2011.11.008 [8] M. Tahmasebi, J. R. Puddefoot, E. R. Inwang and G. P. Vinson, “The Tissue Reninangiotensin System in Human Pancreas,” Journal of Endocrinology, Vol. 161, No. 2, 1999, pp. 317-322. [9] D. G. Passos-Silva, T. Verano-Braga and R. A. Santos, “Angiotensin-(1-7): Beyond the Cardio-Renal Actions,” Clinical Science, Vol. 124, No. 7, 2013, pp. 443-456. [10] U. N. Das, “Angiotensin-II Behaves as an Endogenous Pro-Inflammatory Molecule,” Journal of Association of Physicians of India, Vol. 53, 2005, pp. 472-476. [11] Y. R. Qian, Y. Guo, H. Y. Wan, L. Fan, Y. Feng, L. Ni, Y. Xiang and Q. Y. Li, “Angiotensin-Converting Enzyme 2 Attenuates the Metastasis of Non-Small Cell Lung Cancer through Inhibition of Epithelial-Mesenchymal Transi- tion,” Oncology Reports, Vol. 29, No. 6, 2003, pp. 2408- 2414. [12] J. R. Puddefoot, U. D. K. Udeozo, S. Barker and G. P. Vinson, “The Role of Angiotensin II in the Regulation of Breast Cancer Cell Adhesion and Invasion,” Endocrine- Related Cancer, Vol. 13, No. 3, 2006, pp. 895-903. http://dx.doi.org/10.1677/erc.1.01136 [13] P. E. Gallagher, K. Cook, D. Soto-Pantoja, J. Menon and E. A. Tallant, “Angiotensin Peptides and Lung Cancer,” Current Cancer Drug Targets, Vol. 11, No. 4, 2011, 2011, pp. 394-404. [14] Y. Feng, H. Wan, J. Liu, et al., “The Angiotensin-Con- verting Enzyme 2 in Tumor Growth and Tumor-Associat- ed Angiogenesis in Non-Small Cell Lung Cancer,” On- cology Reports, Vol. 23, No. 4, 2010, pp. 941-948. [15] S. A. A. C. Noronha, W. Bernardo, A. J. Barros, C. R. Nakaie, S. I. Shimuta, I. D. C. G. Silva and S. M. R. No- ronha, “Effects on Cell Viability and on Apoptosis in Tumoral (MCF-7) and in Normal (MCF10A) Epithelial Breast Cells after Human Chorionic Gonadotropin and Derivated-Angiotensin Peptides Treatments,” Journal of Cancer Therapy, Vol. 4, No. 7, 2013, pp. 65-69. [16] I. Binda Neto, S. M. R. Noronha, S. A. A. C. Noronha, M. D. C. M. Wolgien, A. J. Barros, C. R. Nakaie, S. I. Shi- muta, G. Facina and I. D. C. G. Silva, “Angiotensin-(1-7) and Human Chorionic Gonadotropin (hCG) Modulate the Open Access JCT  Plasma Levels of Angiotensin-Converting Enzymes 1 and 2 and AGTR2 (T1247G and A5235G) Gene Polymorphisms Are Associated to Breast Cancer Progression Open Access JCT 1410 Nuclear Transcription Factors or Nuclear Receptors Genes in the Tumorigenic Undifferentiated Breast Cancer Cell Line SKBR3,” Journal of Cancer Therapy, Vol. 4, No. 7A, 2013, pp. 70-74. http://dx.doi.org/10.4236/jct.2013.47A011 [17] S. A. A. Corrêa, S. M. R. Noronha, N. C. Nogueira-de- Souza, C. V. V. Carvalho, A. M. M. Costa, J. J. Linhares, M. T. V. Gomes and I. D. G. Silva, “Association between the Angiotensin-Converting Enzyme (Insertion/Deletion) and Angiotensin II Type 1 Receptor (A1166C) Polymor- phisms and Breast Cancer among Brazilian Women,” Journal of Renin Angiotensin Aldosterone System, Vol. 10, No. 1, 2009, pp. 51-58. http://dx.doi.org/10.1177/1470320309102317 [18] S. A. Correa-Noronha, S. A. Ribeiro de Noronha, C. Ale- crim, A. D. Mesquita, G. S. Brito, M. G. Junqueira, D. B. Leite, C. V. Carvalho and I. D. Silva, “Association of An- giotensin-Converting Enzyme I Gene I/D Polymorphism with Endometrial but Not with Ovarian Cancer,” Gyne- cology Endocrinology, Vol. 28, No. 11, 2012, pp. 889- 891. |