

Paper Menu >>
Journal Menu >>
 International Journal of Geosciences, 2011, 2, 29-35 doi:10.4236/ijg.2011.21003 Published Online February 2011 (http://www.SciRP.org/journal/ijg) Copyright © 2011 SciRes. IJG Changes in Tropical Cyclone Number in the Western North Pacific in a Warming Environment as Implied by Classical Thermodynamics Xiaogang Zhou1, Chongjian Liu2,3, Ying Liu2, Hui Xu4, Xiuming Wang1 1Training Centre, China Meteorological Administration, Beijing, China 2State Key Laboratory of Severe Weather, Chinese Academy of Meteorological Sciences, Beijing, China 3Shanghai Typhoon Institute, China Meteorological Administration, Shanghai, China 4National Meteoro logical Center, China Meteorologica l Administration, Beijing, Chi na E-mail: [email protected] Received October 29, 2010; revised December 5, 2010; accepted January 1, 2011 Abstract Observational analyses show that the equatorial trough in the western North Pacific (WNP) is a well-known origin for tropical cyclones (TC) which have tended to weaken in intensity and decrease in number during the last several decades under global warming. A scientific problem then arises as to why higher sea surface temperatures (SSTs), one of the necessary conditions for typhoon genesis, can cause a weakened equatorial trough and a decreased TC number. In this paper, the WNP is taken as an example to illustrate a possible mechanism for the above-mentioned seemingly counterintuitive phenomena and explain the causality be- tween the unusually heterogeneous pattern of SSTs in a warming environment and TC number in the WNP. This mechanism is based substantially on the second law of thermodynamics. Keywords: Second Law of Thermodynamics, Global Warming, Thermal Wind Relation, Sea Surface Temperature 1. Introduction A number of papers and the observational data have re- vealed that a variety of devastating weather/climate events have happened frequently over the world recently. Here we may quote, as examples, the most serious drought since 1940 occurred in the central western part of the United States in 1998 with grain production drop- ping by 38%, the warmest year 1999 experienced in China in the last hundred years, the extraordinarily pow- erful and deadly Hurricane Katrina with damages of about $81 billion and fatalities over 1800 in 2005, and so forth [1-5]. However, during this severe period, a coun- terintuitive phenomenon was seen in that the tropical cyclone (TC) numbers tended to decrease over some oceanic basins while a rise in their sea surface tempera- tures (SSTs) has been observed [6-8]. As a result, a sci- entific problem arises as to why, under a background of global warming, higher SSTs, implying more potential energy which is one of the necessary conditions for ty- phoon genesis, would cause decreased TC numbers? In the recently published monograph [9] it is stated that most numerical models indicate an overall decrease in the number of storms attributable to greater atmos- pheric stability and to a decrease in vertical mass flux. However, the analysis in this paper for understanding the observed counterintuitive phenomena is quite different from those described in the previous works. This analysis is based on fundamental dynamics rather than numerical experiments whose results are inevitably affected by the numerical model itself. In this paper the western North Pacific (WNP) over which the TC numbers tended to decrease with minor fluctuations from late 1960s (Figure 1) is taken to illus- trate a possible mechanism responsible for the conun- drum. This paper is based on the observational results shown in Figure 1 that are obtained from the Tropical Cyclone Year Book or the CMA dataset covering 59 years as indicated in Ref. [10]. And, the relative vorticity (RV) in Figure 1 is calculated via the definition formula for RV (see Subsection 3.1 below), based on the National Centers for Environmental Prediction/National Center 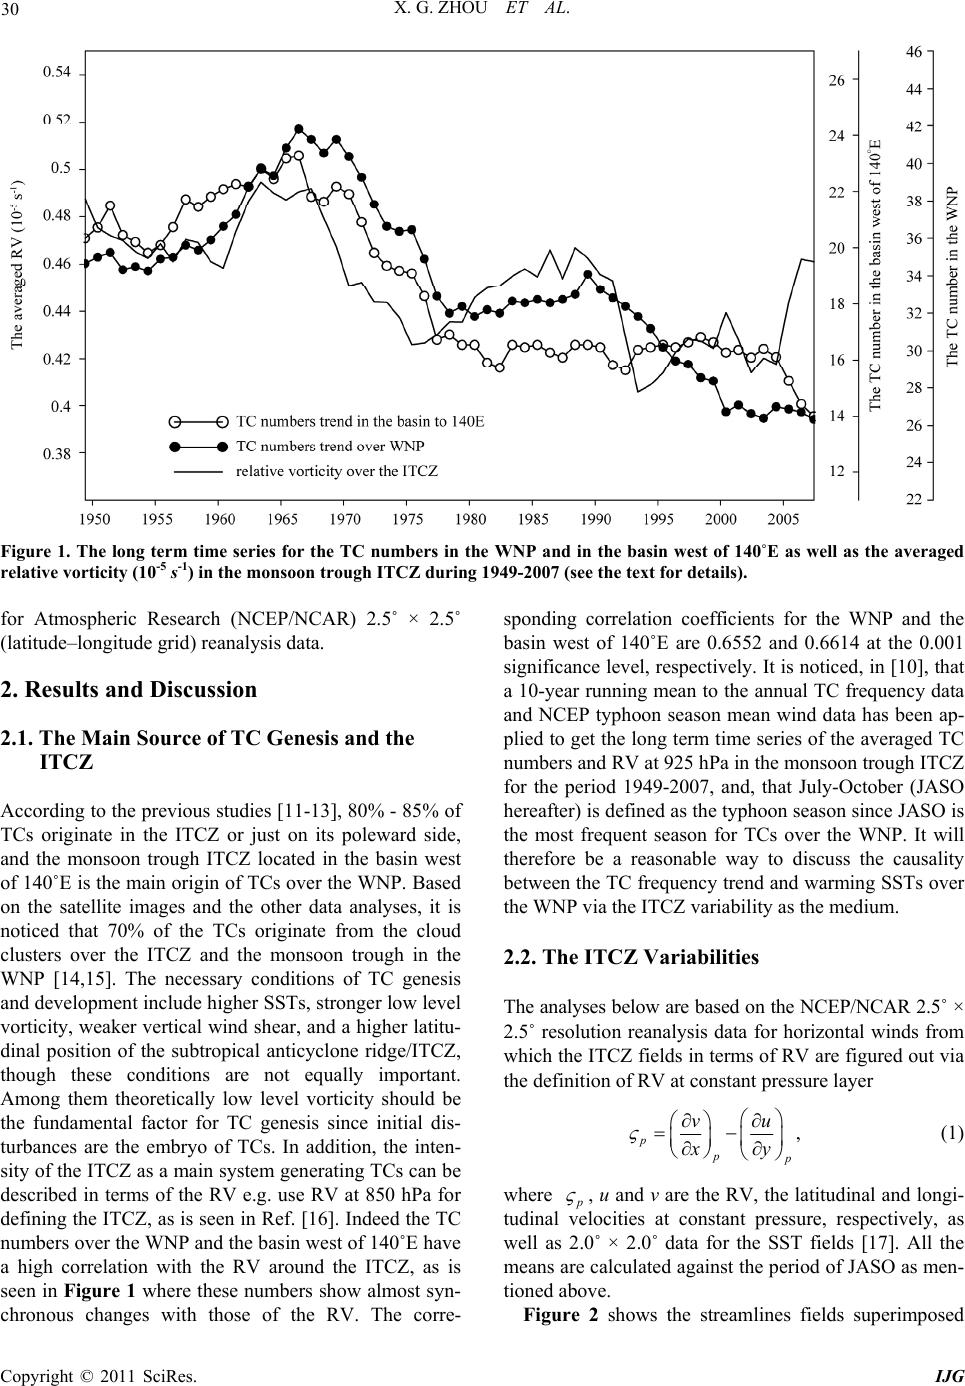 X. G. ZHOU ET AL. Copyright © 2011 SciRes. IJG 30 Figure 1. The long term time series for the TC numbers in the WNP and in the basin west of 140˚E as well as the averaged relative vorticity (10-5 s-1) in the monsoon trough ITCZ during 1949-2007 (see the text for details). for Atmospheric Research (NCEP/NCAR) 2.5˚ × 2.5˚ (latitude–longitude grid) reanalysis data. 2. Results and Discussion 2.1. The Main Source of TC Genesis and the ITCZ According to the previous studies [11-13], 80% - 85% of TCs originate in the ITCZ or just on its poleward side, and the monsoon trough ITCZ located in the basin west of 140˚E is the main origin of TCs over the WNP. Based on the satellite images and the other data analyses, it is noticed that 70% of the TCs originate from the cloud clusters over the ITCZ and the monsoon trough in the WNP [14,15]. The necessary conditions of TC genesis and development include higher SSTs, stronger low level vorticity, weaker vertical wind shear, and a higher latitu- dinal position of the subtropical anticyclone ridge/ITCZ, though these conditions are not equally important. Among them theoretically low level vorticity should be the fundamental factor for TC genesis since initial dis- turbances are the embryo of TCs. In addition, the inten- sity of the ITCZ as a main system generating TCs can be described in terms of the RV e.g. use RV at 850 hPa for defining the ITCZ, as is seen in Ref. [16]. Indeed the TC numbers over the WNP and the basin west of 140˚E have a high correlation with the RV around the ITCZ, as is seen in Figure 1 where these numbers show almost syn- chronous changes with those of the RV. The corre- sponding correlation coefficients for the WNP and the basin west of 140˚E are 0.6552 and 0.6614 at the 0.001 significance level, respectively. It is noticed, in [10], that a 10-year running mean to the annual TC frequency data and NCEP typhoon season mean wind data has been ap- plied to get the long term time series of the averaged TC numbers and RV at 925 hPa in the monsoon trough ITCZ for the period 1949-2007, and, that July-October (JASO hereafter) is defined as the typhoon season since JASO is the most frequent season for TCs over the WNP. It will therefore be a reasonable way to discuss the causality between the TC frequency trend and warming SSTs over the WNP via the ITCZ variability as the medium. 2.2. The ITCZ Variabilities The analyses below are based on the NCEP/NCAR 2.5˚ × 2.5˚ resolution reanalysis data for horizontal winds from which the ITCZ fields in terms of RV are figured out via the definition of RV at constant pressure layer pp p vu x y , (1) where p , u and v are the RV, the latitudinal and longi- tudinal velocities at constant pressure, respectively, as well as 2.0˚ × 2.0˚ data for the SST fields [17]. All the means are calculated against the period of JASO as men- tioned above. Figure 2 shows the streamlines fields superimposed 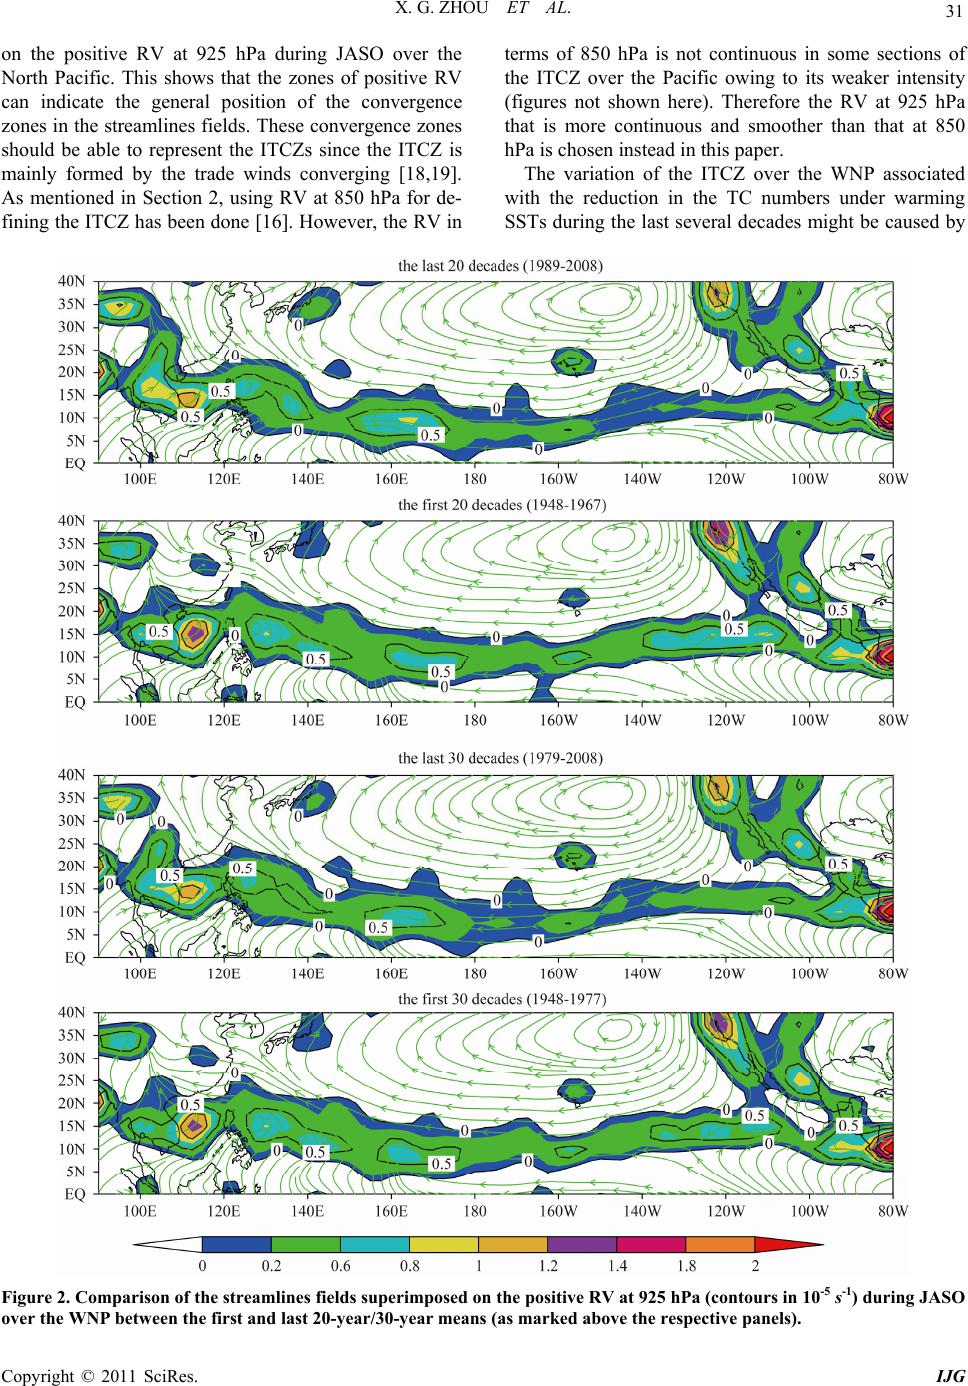 X. G. ZHOU ET AL. Copyright © 2011 SciRes. IJG 31 on the positive RV at 925 hPa during JASO over the North Pacific. This shows that the zones of positive RV can indicate the general position of the convergence zones in the streamlines fields. These convergence zones should be able to represent the ITCZs since the ITCZ is mainly formed by the trade winds converging [18,19]. As mentioned in Section 2, using RV at 850 hPa for de- fining the ITCZ has been done [16]. However, the RV in terms of 850 hPa is not continuous in some sections of the ITCZ over the Pacific owing to its weaker intensity (figures not shown here). Therefore the RV at 925 hPa that is more continuous and smoother than that at 850 hPa is chosen instead in this paper. The variation of the ITCZ over the WNP associated with the reduction in the TC numbers under warming SSTs during the last several decades might be caused by Figure 2. Comparison of the streamlines fields superimposed on the positive RV at 925 hPa (contours in 10-5 s-1) during JASO over the WNP between the first and last 20-year/30-year means (as marked above the respective panels). 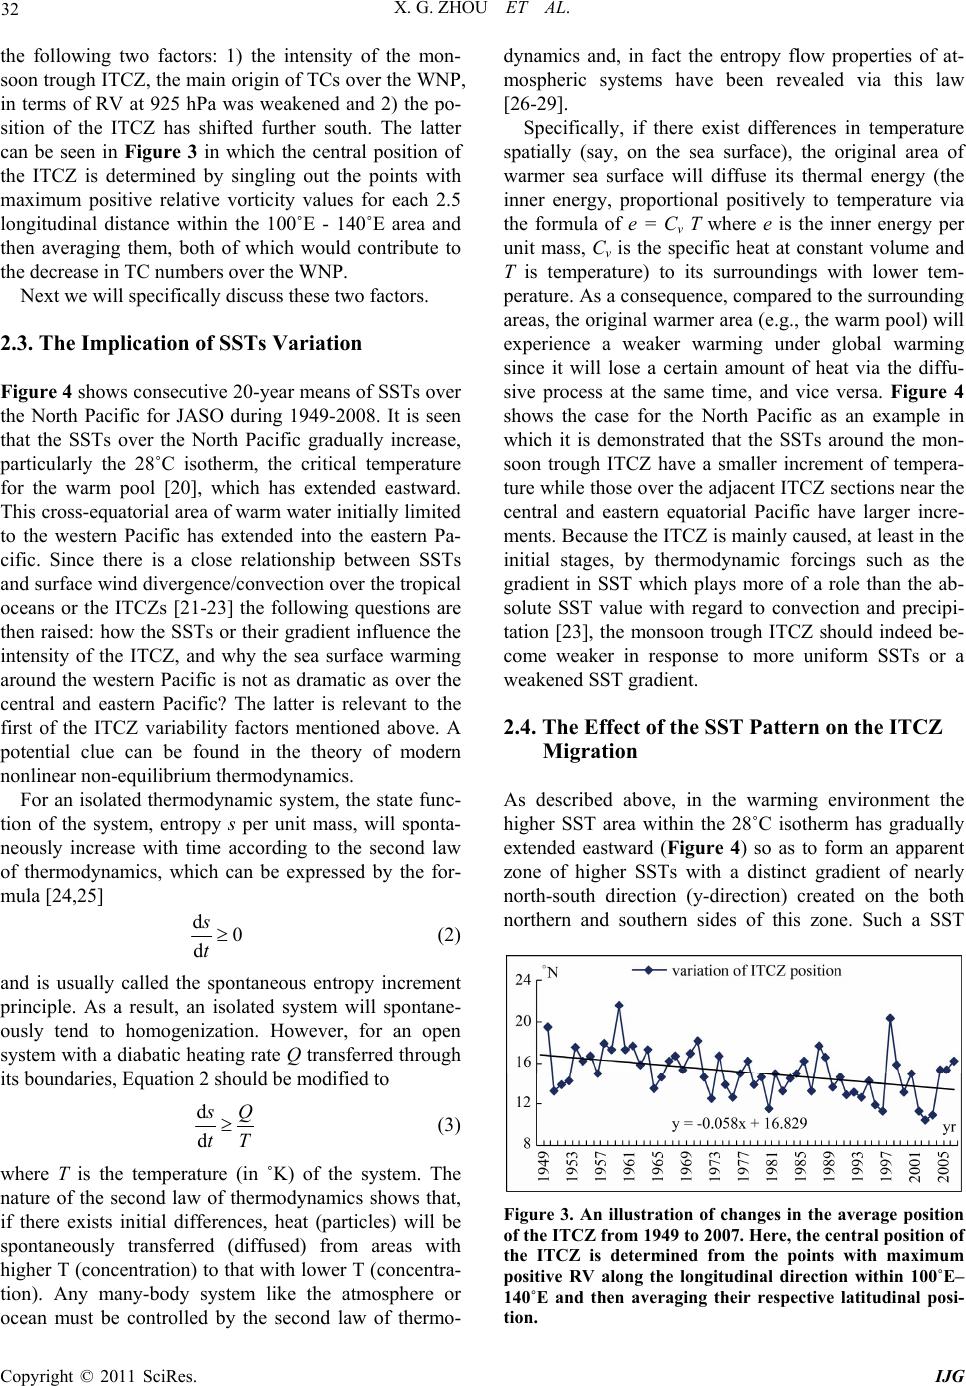 X. G. ZHOU ET AL. Copyright © 2011 SciRes. IJG 32 the following two factors: 1) the intensity of the mon- soon trough ITCZ, the main origin of TCs over the WNP, in terms of RV at 925 hPa was weakened and 2) the po- sition of the ITCZ has shifted further south. The latter can be seen in Figure 3 in which the central position of the ITCZ is determined by singling out the points with maximum positive relative vorticity values for each 2.5 longitudinal distance within the 100˚E - 140˚E area and then averaging them, both of which would contribute to the decrease in TC numbers over the WNP. Next we will specifically discuss these two factors. 2.3. The Implication of SSTs Variation Figure 4 shows consecutive 20-year means of SSTs over the North Pacific for JASO during 1949-2008. It is seen that the SSTs over the North Pacific gradually increase, particularly the 28˚C isotherm, the critical temperature for the warm pool [20], which has extended eastward. This cross-equatorial area of warm water initially limited to the western Pacific has extended into the eastern Pa- cific. Since there is a close relationship between SSTs and surface wind divergence/convection over the tropical oceans or the ITCZs [21-23] the following questions are then raised: how the SSTs or their gradient influence the intensity of the ITCZ, and why the sea surface warming around the western Pacific is not as dramatic as over the central and eastern Pacific? The latter is relevant to the first of the ITCZ variability factors mentioned above. A potential clue can be found in the theory of modern nonlinear non-equilibrium thermodynamics. For an isolated thermodynamic system, the state func- tion of the system, entropy s per unit mass, will sponta- neously increase with time according to the second law of thermodynamics, which can be expressed by the for- mula [24,25] d0 d s t (2) and is usually called the spontaneous entropy increment principle. As a result, an isolated system will spontane- ously tend to homogenization. However, for an open system with a diabatic heating rate Q transferred through its boundaries, Equation 2 should be modified to d d s Q tT (3) where T is the temperature (in ˚K) of the system. The nature of the second law of thermodynamics shows that, if there exists initial differences, heat (particles) will be spontaneously transferred (diffused) from areas with higher T (concentration) to that with lower T (concentra- tion). Any many-body system like the atmosphere or ocean must be controlled by the second law of thermo- dynamics and, in fact the entropy flow properties of at- mospheric systems have been revealed via this law [26-29]. Specifically, if there exist differences in temperature spatially (say, on the sea surface), the original area of warmer sea surface will diffuse its thermal energy (the inner energy, proportional positively to temperature via the formula of e = Cv T where e is the inner energy per unit mass, Cv is the specific heat at constant volume and T is temperature) to its surroundings with lower tem- perature. As a consequence, compared to the surrounding areas, the original warmer area (e.g., the warm pool) will experience a weaker warming under global warming since it will lose a certain amount of heat via the diffu- sive process at the same time, and vice versa. Figure 4 shows the case for the North Pacific as an example in which it is demonstrated that the SSTs around the mon- soon trough ITCZ have a smaller increment of tempera- ture while those over the adjacent ITCZ sections near the central and eastern equatorial Pacific have larger incre- ments. Because the ITCZ is mainly caused, at least in the initial stages, by thermodynamic forcings such as the gradient in SST which plays more of a role than the ab- solute SST value with regard to convection and precipi- tation [23], the monsoon trough ITCZ should indeed be- come weaker in response to more uniform SSTs or a weakened SST gradient. 2.4. The Effect of the SST Pattern on the ITCZ Migration As described above, in the warming environment the higher SST area within the 28˚C isotherm has gradually extended eastward (Figure 4) so as to form an apparent zone of higher SSTs with a distinct gradient of nearly north-south direction (y-direction) created on the both northern and southern sides of this zone. Such a SST Figure 3. An illustration of changes in the average position of the ITCZ from 1949 to 2007. Here, the central position of the ITCZ is determined from the points with maximum positive RV along the longitudinal direction within 100˚E– 140˚E and then averaging their respective latitudinal posi- tion. 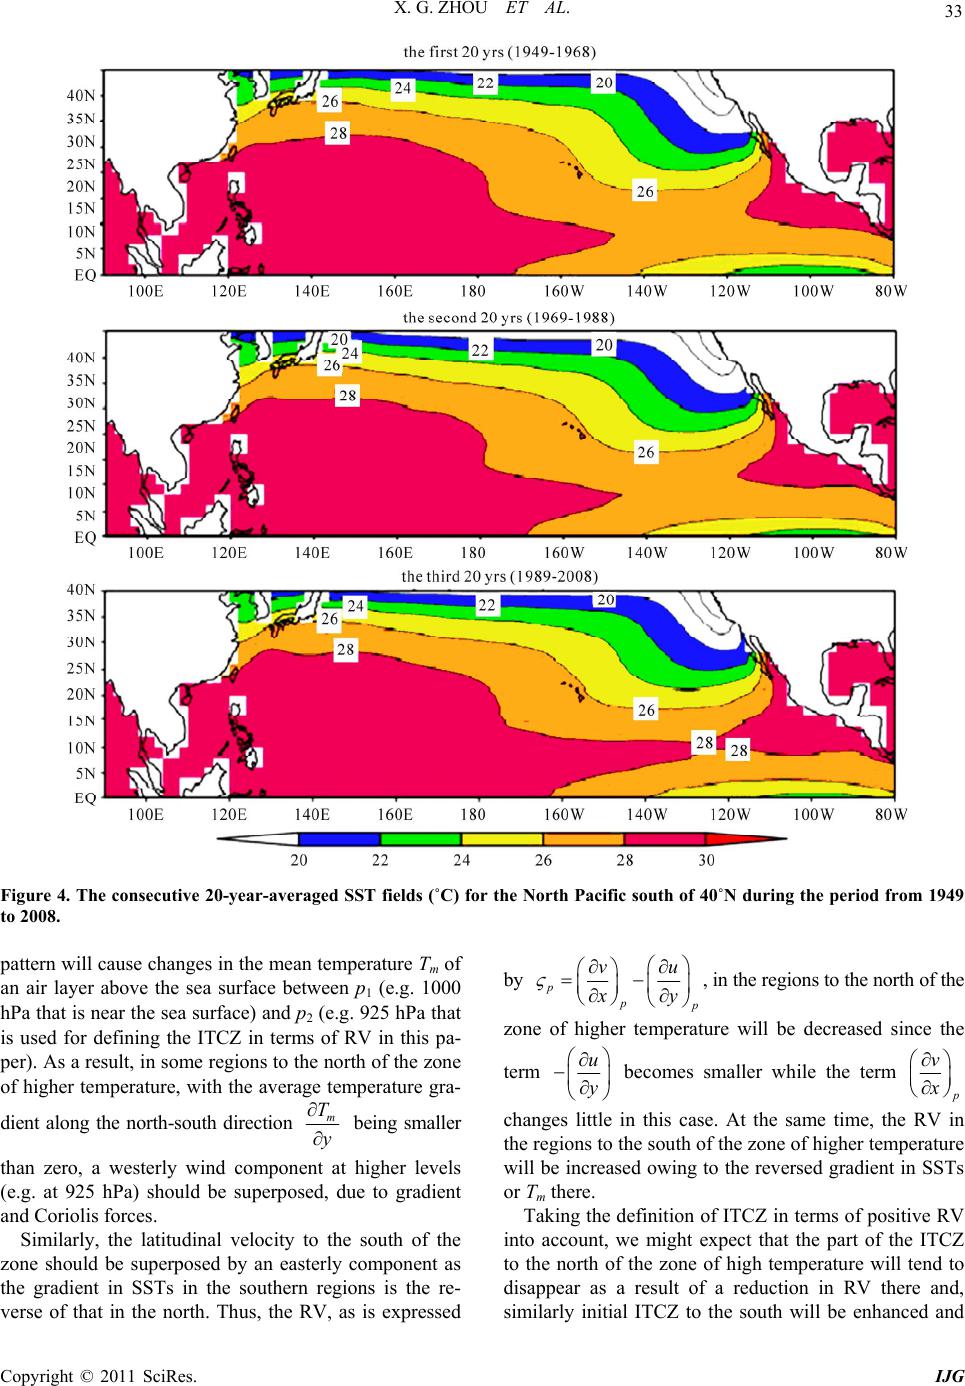 X. G. ZHOU ET AL. Copyright © 2011 SciRes. IJG 33 Figure 4. The consecutive 20-year-averaged SST fields (˚C) for the North Pacific south of 40˚N during the period from 1949 to 2008. pattern will cause changes in the mean temperature Tm of an air layer above the sea surface between p1 (e.g. 1000 hPa that is near the sea surface) and p2 (e.g. 925 hPa that is used for defining the ITCZ in terms of RV in this pa- per). As a result, in some regions to the north of the zone of higher temperature, with the average temperature gra- dient along the north-south direction m T y being smaller than zero, a westerly wind component at higher levels (e.g. at 925 hPa) should be superposed, due to gradient and Coriolis forces. Similarly, the latitudinal velocity to the south of the zone should be superposed by an easterly component as the gradient in SSTs in the southern regions is the re- verse of that in the north. Thus, the RV, as is expressed by pp p vu x y , in the regions to the north of the zone of higher temperature will be decreased since the term u y becomes smaller while the term p v x changes little in this case. At the same time, the RV in the regions to the south of the zone of higher temperature will be increased owing to the reversed gradient in SSTs or Tm there. Taking the definition of ITCZ in terms of positive RV into account, we might expect that the part of the ITCZ to the north of the zone of high temperature will tend to disappear as a result of a reduction in RV there and, similarly initial ITCZ to the south will be enhanced and 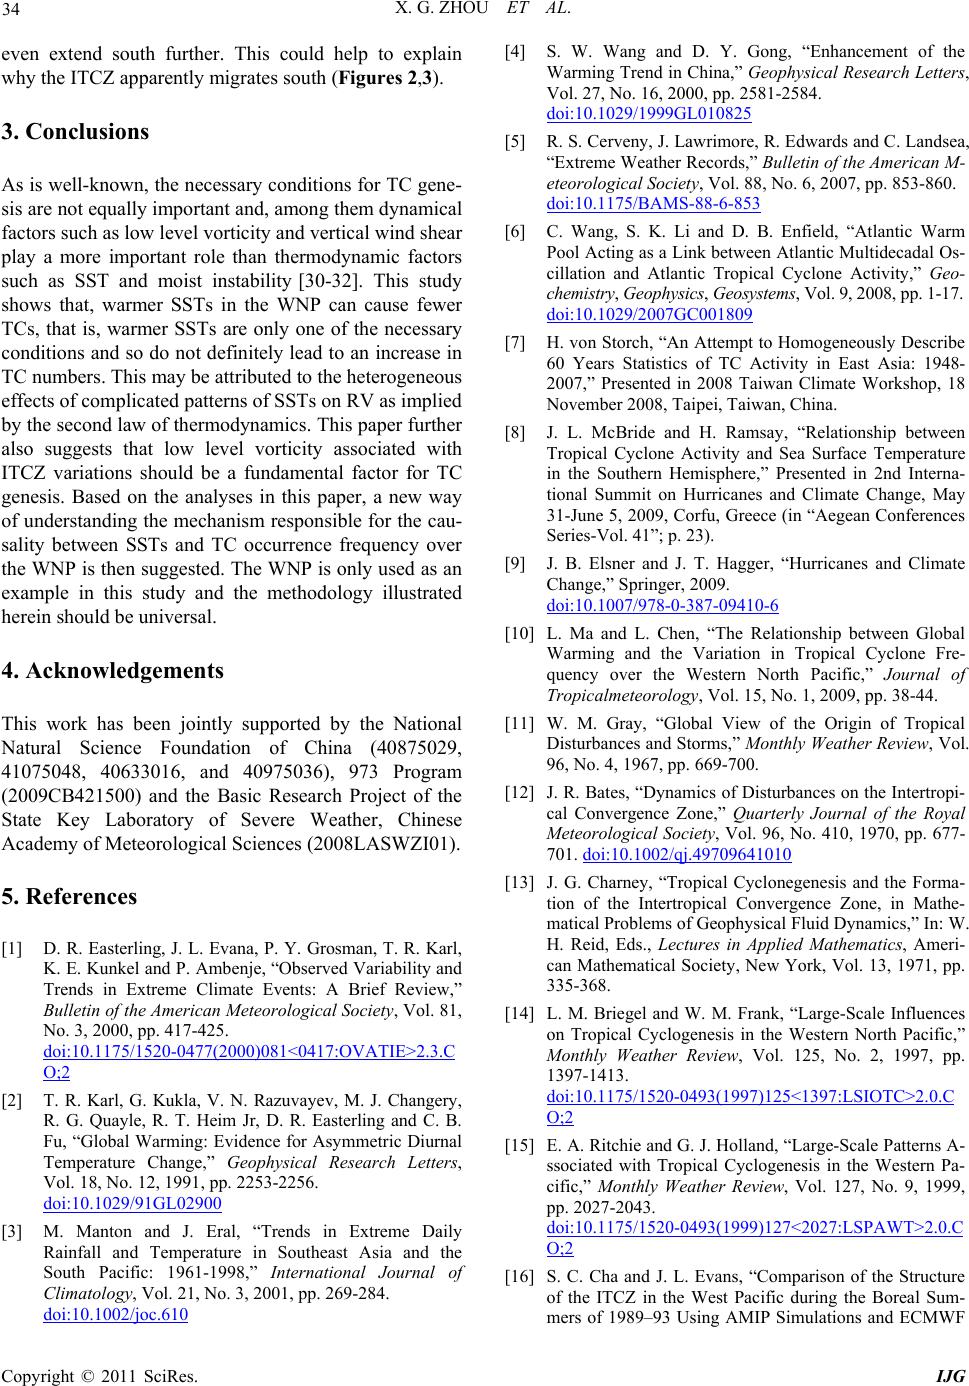 X. G. ZHOU ET AL. Copyright © 2011 SciRes. IJG 34 even extend south further. This could help to explain why the ITCZ apparently migrates south (Figures 2,3). 3. Conclusions As is well-known, the necessary conditions for TC gene- sis are not equally important and, among them dynamical factors such as low level vorticity and vertical wind shear play a more important role than thermodynamic factors such as SST and moist instability [30-32]. This study shows that, warmer SSTs in the WNP can cause fewer TCs, that is, warmer SSTs are only one of the necessary conditions and so do not definitely lead to an increase in TC numbers. This may be attributed to the heterogeneous effects of complicated patterns of SSTs on RV as implied by the second law of thermodynamics. This paper further also suggests that low level vorticity associated with ITCZ variations should be a fundamental factor for TC genesis. Based on the analyses in this paper, a new way of understanding the mechanism responsible for the cau- sality between SSTs and TC occurrence frequency over the WNP is then suggested. The WNP is only used as an example in this study and the methodology illustrated herein should be universal. 4. Acknowledgements This work has been jointly supported by the National Natural Science Foundation of China (40875029, 41075048, 40633016, and 40975036), 973 Program (2009CB421500) and the Basic Research Project of the State Key Laboratory of Severe Weather, Chinese Academy of Meteorological Sciences (2008LASWZI01). 5. References [1] D. R. Easterling, J. L. Evana, P. Y. Grosman, T. R. Karl, K. E. Kunkel and P. Ambenje, “Observed Variability and Trends in Extreme Climate Events: A Brief Review,” Bulletin of the American Meteorological Society, Vol. 81, No. 3, 2000, pp. 417-425. doi:10.1175/1520-0477(2000)081<0417:OVATIE>2.3.C O;2 [2] T. R. Karl, G. Kukla, V. N. Razuvayev, M. J. Changery, R. G. Quayle, R. T. Heim Jr, D. R. Easterling and C. B. Fu, “Global Warming: Evidence for Asymmetric Diurnal Temperature Change,” Geophysical Research Letters, Vol. 18, No. 12, 1991, pp. 2253-2256. doi:10.1029/91GL02900 [3] M. Manton and J. Eral, “Trends in Extreme Daily Rainfall and Temperature in Southeast Asia and the South Pacific: 1961-1998,” International Journal of Climatology, Vol. 21, No. 3, 2001, pp. 269-284. doi:10.1002/joc.610 [4] S. W. Wang and D. Y. Gong, “Enhancement of the Warming Trend in China,” Geophysical Research Letters, Vol. 27, No. 16, 2000, pp. 2581-2584. doi:10.1029/1999GL010825 [5] R. S. Cerveny, J. Lawrimore, R. Edwards and C. Landsea, “Extreme Weather Records,” Bulletin of the American M- eteorological Society, Vol. 88, No. 6, 2007, pp. 853-860. doi:10.1175/BAMS-88-6-853 [6] C. Wang, S. K. Li and D. B. Enfield, “Atlantic Warm Pool Acting as a Link between Atlantic Multidecadal Os- cillation and Atlantic Tropical Cyclone Activity,” Geo- chemistry, Geophysics, Geosystems, Vol. 9, 2008, pp. 1-17. doi:10.1029/2007GC001809 [7] H. von Storch, “An Attempt to Homogeneously Describe 60 Years Statistics of TC Activity in East Asia: 1948- 2007,” Presented in 2008 Taiwan Climate Workshop, 18 November 2008, Taipei, Taiwan, China. [8] J. L. McBride and H. Ramsay, “Relationship between Tropical Cyclone Activity and Sea Surface Temperature in the Southern Hemisphere,” Presented in 2nd Interna- tional Summit on Hurricanes and Climate Change, May 31-June 5, 2009, Corfu, Greece (in “Aegean Conferences Series-Vol. 41”; p. 23). [9] J. B. Elsner and J. T. Hagger, “Hurricanes and Climate Change,” Springer, 2009. doi:10.1007/978-0-387-09410-6 [10] L. Ma and L. Chen, “The Relationship between Global Warming and the Variation in Tropical Cyclone Fre- quency over the Western North Pacific,” Journal of Tropicalmeteorology, Vol. 15, No. 1, 2009, pp. 38-44. [11] W. M. Gray, “Global View of the Origin of Tropical Disturbances and Storms,” Monthly Weather Review, Vol. 96, No. 4, 1967, pp. 669-700. [12] J. R. Bates, “Dynamics of Disturbances on the Intertropi- cal Convergence Zone,” Quarterly Journal of the Royal Meteorological Society, Vol. 96, No. 410, 1970, pp. 677- 701. doi:10.1002/qj.49709641010 [13] J. G. Charney, “Tropical Cyclonegenesis and the Forma- tion of the Intertropical Convergence Zone, in Mathe- matical Problems of Geophysical Fluid Dynamics,” In: W. H. Reid, Eds., Lectures in Applied Mathematics, Ameri- can Mathematical Society, New York, Vol. 13, 1971, pp. 335-368. [14] L. M. Briegel and W. M. Frank, “Large-Scale Influences on Tropical Cyclogenesis in the Western North Pacific,” Monthly Weather Review, Vol. 125, No. 2, 1997, pp. 1397-1413. doi:10.1175/1520-0493(1997)125<1397:LSIOTC>2.0.C O;2 [15] E. A. Ritchie and G. J. Holland, “Large-Scale Patterns A- ssociated with Tropical Cyclogenesis in the Western Pa- cific,” Monthly Weather Review, Vol. 127, No. 9, 1999, pp. 2027-2043. doi:10.1175/1520-0493(1999)127<2027:LSPAWT>2.0.C O;2 [16] S. C. Cha and J. L. Evans, “Comparison of the Structure of the ITCZ in the West Pacific during the Boreal Sum- mers of 1989–93 Using AMIP Simulations and ECMWF  X. G. ZHOU ET AL. Copyright © 2011 SciRes. IJG 35 Reanalysis,” Journal of Climate, Vol. 15, No. 24, 2002, pp. 3459-3568. [17] E. Kalnay, et al., “The NCEP/NCAR 40-Year Reanalysis Project,” Bulletin of the American Meteorological Society, Vol. 77, No.3, 1996, pp. 437-471. doi:10.1175/1520-0477(1996)077<0437:TNYRP>2.0.CO ;2 [18] J. Bjerknes, “Atmospheric Teleconnections from the Equatorial Pacific,” Monthly Weather Review, Vol. 97, No. 2, 1969, pp. 163-172. doi:10.1175/1520-0493(1969)097<0163:ATFTEP>2.3.C O;2 [19] J. R. Holton, J. M. Wallace and J. A. Young, “On Boundary Layer Dynamics and the ITCZ,” Journal of the Atmospheric Sciences, Vol. 28, No. 2, 1971, pp. 275-280. doi:10.1175/1520-0469(1971)028<0275:OBLDAT>2.0.C O;2 [20] C.-R. Ho, X.-H. Yan and Q. Zheng, “Satellite Obse- rvations of Upper-Layer Variabilities in the Western Pac- ific Warm Pool,” Bulletin of the American Meteorolo- gical Society , Vol. 76, No. 5, 1995, pp. 669-679. doi:10.1175/1520-0477(1995)076<0669:SOOULV>2.0.C O;2 [21] N. E. Graham and T. P. Barnett, “Sea Surface Tempera- ture, Surface Wind Divergence and Convection over Tropical Oceans,” Science, Vol. 238, No. 4827, 1987, pp. 657-659. doi:10.1126/science.238.4827.657 [22] K.-M. Lau, H.-T. Wu and S. Bony, “The Role of Large-Scale Atmospheric Circulation in the Relationship between Tropical Convection and Sea Surface Tempera- ture,” Journal of Climate, Vol. 10, No. 3, 1997, pp. 381- 392. doi:10.1175/1520-0442(1997)010<0381:TROLSA>2.0.C O;2 [23] R. S. Lindzen and S. Nigam, “On the Role of Sea Surface Temperature Gradients in Forcing Low Level Winds and Convergence in the Tropics,” Journal of the Atmospheric Sciences, Vol. 44, 1987, pp. 2440-2458. doi:10.1175/1520-0469(1987)044<2418:OTROSS>2.0.C O;2 [24] I. Prigogine, “Introduction to Thermodynamics of Irreve- rsible Processes,” Charles C. Thomas, 1955. [25] S. R. de Groot and P. Mazur, “Non-Equilibrium Thermo- dynamics,” North-Holland Publishing Company, 1962. [26] C. Liu and Y. Liu, “An Attempt at Improving a Global Spectral Model by Incorporating the Second Law of Thermodynamics,” Geophysical Research Letters, Vol. 32, 2005, L03806. doi:10.1029/2004GL021602 [27] C. Liu, Y. Liu and H. Xu, “A Physics-Based Diffusion Scheme for Numerical Models,” Geophysical Research Letters, Vol. 33, 2006, L12805. doi:10.1029/2006GL025781 [28] Y. Liu and C. Liu, “Entropy Flow and the Evolution of a Storm,” Entropy, Vol. 10, No. 4, 2008, pp. 430-440. doi:10.3390/e10040430. [29] H. Xu and C. Liu, “Entropy Flow Properties of a Ty- phoon as Simulated by a Meso-Scale Model,” Europhys- ics Letters, Vol. 83, No. 1, 2008. doi:10.1209/0295-5075/83/18001 [30] M. Sugi, A. Noda and N. Sato, “Influence of Global Warming on Tropical Cyclone Climatology: An Experi- ment with the JMA Global Model,” Journal of the Mete- orological Society of Japan, Vol. 80, No. 5, 2002, pp. 249-272. doi:10.2151/jmsj.80.249 [31] R. E. McDonald, D. G.Bleaken, D. R. Cresswell, V. D. Pope and C. A. Senior, “Tropical Storms: Representation and Diagnosis in Climate Models and the Impacts of Cli- mate Change,” Climate Dynamics, 2005. doi:10.1007/s00382-004-0491-0 [32] F. J. Chauvin, F. Royer and M. Deque, “Response of Hurricane-Type Vortices to Global Warming as Simu- lated by ARPEGE-Climate at High Resolution,” Climate Dynamic, Vol. 27, No. 4, 2006, pp. 377-399. doi:10.1007/s00382-006-0135-7 |