

Paper Menu >>
Journal Menu >>
 J. Biomedical Science and Engineering, 2013, 6, 1029-1033 JBiSE http://dx.doi.org/10.4236/jbise.2013.611128 Published Online November 2013 (http://www.scirp.org/journal/jbise/) Carcinoma cell identification via optical microscop y and shape feature analysis Ahmad Chaddad, Camel Tanougast, Andrew Golato, Abbas Dandache Laboratory of Design, Optimization and Modeling (LCOMS), University of Lorraine, Metz, France Email: [email protected], [email protected] Received 27 September 2013; revised 21 October 2013; accepted 29 October 2013 Copyright © 2013 Ahmad Chaddad et al. This is an open access article distributed under the Creative Commons Attribution License, which permits unrestricted use, distribution, and reproduction in any medium, provided the original work is properly cited. ABSTRACT Optical microscopy is commonly used for cancer cell detection. Focusing on carcinoma cell identification via optical microscopy, a proof-of-concept study was performed at Laboratory of Design, Optimization and Modeling (LCOMS) to determine the grade of cancer cells. This paper focuses on three types of abnormal cells; namely, Benign Hyperplasia (BH), Intraepithe- lial Neoplasia (IN), which is a precursor state for can- cer, and Carcinoma (Ca), which corresponds to ab- normal tissue proliferation cancer. These types of cells were used to assess the efficiency of using shape features to identify carcinoma cells. A comparative study based on performance indicator concludes that three features, Area, Xor-Co n v ex, and Solidity, were found to be effective in identifying the Carcinoma grade of cancer cells. Keywords: Cancer; Carcinoma; Detection; Shape Features 1. INTRODUCTION Cancer, unfortunately, is one of the most common dis- eases affecting people. It is characterized by abnormal and uncontrolled cell proliferation. Early cancer detec- tion is of paramount interest for timely and effective di- agnosis and treatment [1]. Colon cancer cells are well studied and presented since many macroscopic and mi- croscopic techniques can be used to detect colon cancer. The current repertoire of tools, including medical imag- ing techniques [2], such as MRI, CT scan, PET, SPECT and Microscopy, are considered effective at detecting [3], localizing and estimating the volume of certain cancers. Nevertheless, these tools are not capable of detecting ear- ly cancer on the cellular level. However, microscopic ob- servations of biopsies of the colon display an ability to detect irregular cells or non-natural contrasts. With this, many recent works focus on developing automatic read- ing procedures for such biopsies [4-6]. Automatic read- ing fosters faster and precise readings of microscopic bi- opsies and segmenting cells in order to classify them as cancerous or non-cancerous cells [7,8]. Automatic read- ing of microscopic images includes several consecutive steps: The system must segment the image by detecting and extracting cells from their surrounding medium us- ing morphological image processing. This step requires the careful selection of the approp riate segmentation tec h- nique in order to process high resolution gray scale and multispectral microscopic images. Following the detec- tion of cells within an image, the system must extract some characteristic parameters in order to distinguish the three abnormal cell types [9,10]. To better our learning and classification, we employed the nearest neighbor cl as - sifier [11,12]. We used a texture of multispectral images of cancer cells taken from the Anapat service of the CHU hospital, Nancy-Brabois, France. Analysis of the textures and structures present in the multispectral bio-images di- agnoses different grades of cancer malignancy. Our pro- ject operates on the interface between optical microscopy and the control center “computer”, which takes the data from optical microscopy including the Charge Coupled Device (CCD) Camera and the Liquid Crystal Tunable Filter (LCTF) and uses it to get a multispectral image. Figure 1 presents the optical microscopy acquisition sys- tem for cell detection and carcinoma cell identification. The goal of this paper presents proper carcinoma cell identification and clear distingu ishing of these cells from other grades of cancer cells. The three types of cancer cells considered in this study are shown in Figure 2. This paper is organized as follows: Section 2 briefly reviews the Snake method based on external and internal energy, shape features, nearest neighbors classifier and the cross validation. Experimental results and discussions based on a comparative study are presented in Section 3. OPEN ACCESS 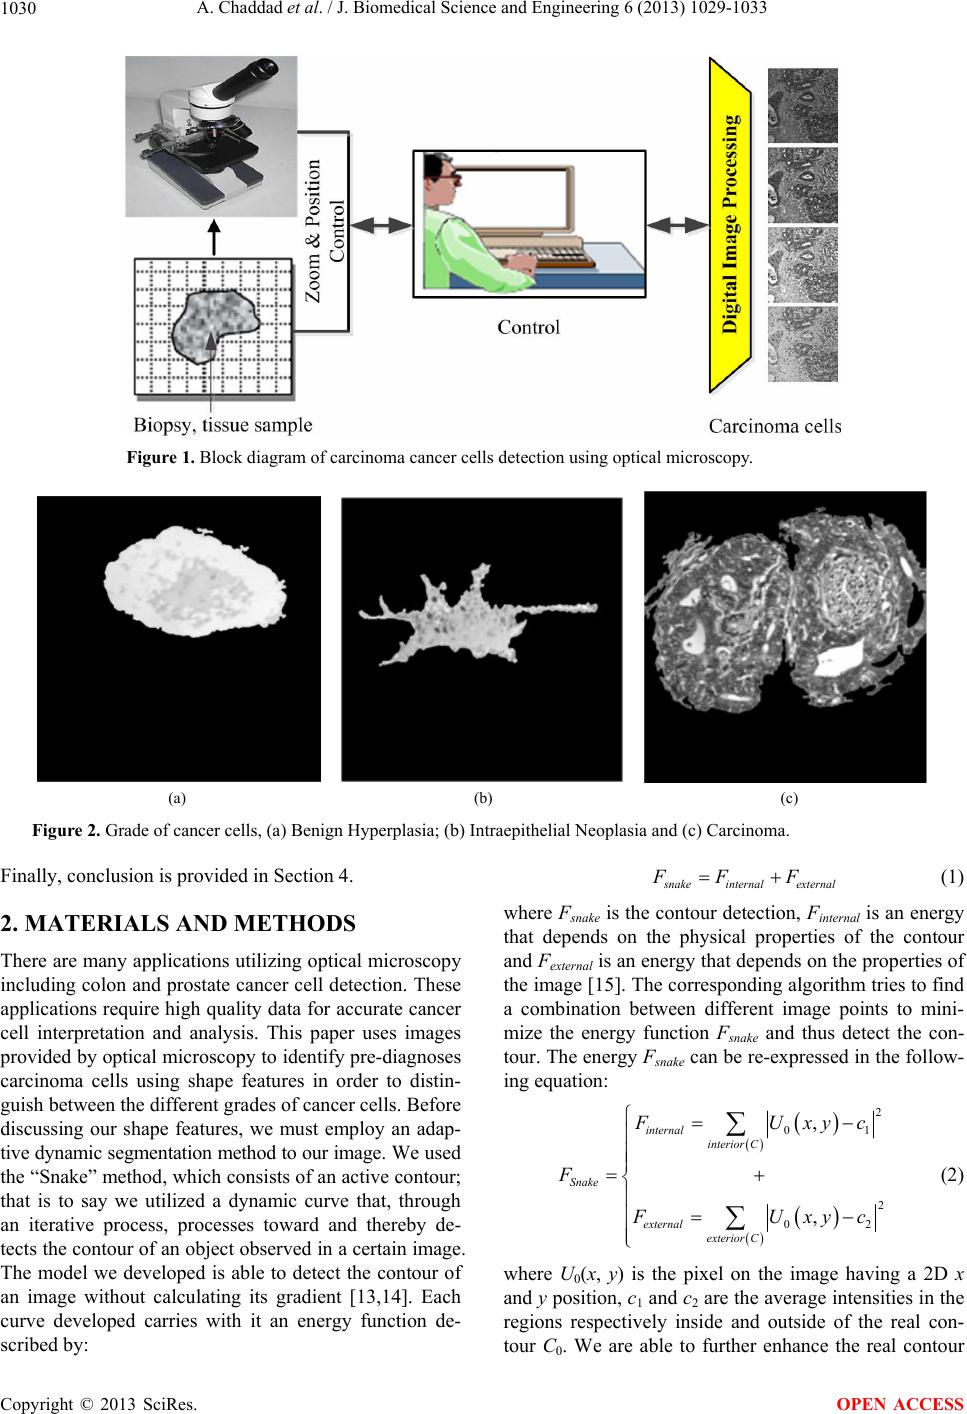 A. Chaddad et al. / J. Biomedical Science and Engineering 6 (2013) 1029-1033 1030 Figure 1. Block diagram of carcinoma cancer cells detection using optical microscopy. (a) (b) (c) Figure 2. Grade of cancer cells, (a) Benign Hyperplasia; (b) Intraepithelial Neoplasia and (c) Carcinoma. Finally, conclusion is provided in Section 4. 2. MATERIALS AND METHODS There are many applications utilizing optical microscopy including colon and prostate cancer cell detection. These applications require high quality data for accurate cancer cell interpretation and analysis. This paper uses images provided by optical microscopy to identify pre-diagnoses carcinoma cells using shape features in order to distin- guish between the different grades of cancer cells. Before discussing our shape features, we must employ an adap- tive dynamic segmentation method to our image. We used the “Snake” method, which consists of an active contour; that is to say we utilized a dynamic curve that, through an iterative process, processes toward and thereby de- tects the contour of an object observed in a certain image. The model we developed is able to detect the contour of an image without calculating its gradient [13,14]. Each curve developed carries with it an energy function de- scribed by : s nakeinternal external FF F (1) where Fsnake is the contour detection, Finternal is an energy that depends on the physical properties of the contour and Fexternal is an energy that depends on th e properties of the image [15]. The correspond ing algorithm tries to find a combination between different image points to mini- mize the energy function Fsnake and thus detect the con- tour. The energy Fsnake can be re-expressed in the follow- ing equation: 2 01 2 02 , , internal interior C Snake external exterior C F Uxy c F F Uxy c (2) where U0(x, y) is the pixel on the image having a 2D x and y position , c1 and c2 are the average intens ities in the regions respectively inside and outside of the real con- tour C0. We are able to further enhance the real contour Copyright © 2013 SciRes. OPEN ACCESS 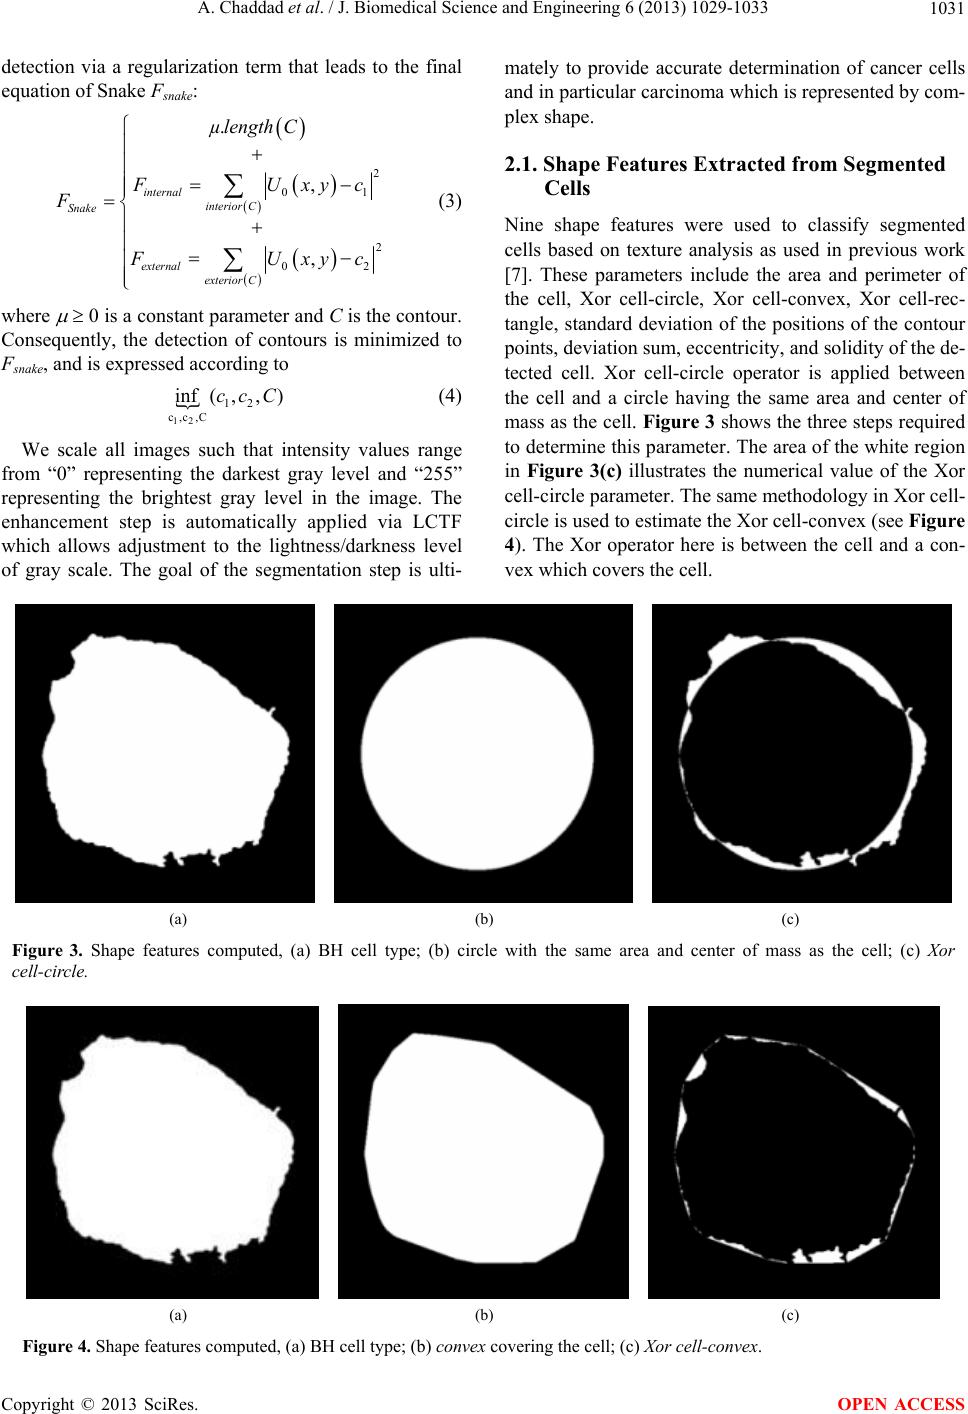 A. Chaddad et al. / J. Biomedical Science and Engineering 6 (2013) 1029-1033 1031 detection via a regularization term that leads to the final equation of Snake Fsnake: 2 0 2 02 . , , internal interior C Snake external exterior C µlengthC 1 F Uxy c F F Uxy c (3) where 0 is a constant parameter and C is the contour. Consequently, the detection of contours is minimized to Fsnake, and is expressed according to 12 12 c,c,C (,f,in ccC) (4) We scale all images such that intensity values range from “0” representing the darkest gray level and “255” representing the brightest gray level in the image. The enhancement step is automatically applied via LCTF which allows adjustment to the lightness/darkness level of gray scale. The goal of the segmentation step is ulti- mately to provide accurate determination of cancer cells and in particular carcinoma which is represented by com- plex shape. 2.1. Shape Features Extracted from Segmented Cells Nine shape features were used to classify segmented cells based on texture analysis as used in previous work [7]. These parameters include the area and perimeter of the cell, Xor cell-circle, Xor cell-convex, Xor cell-rec- tangle, standard deviation of the positions of the contour points, deviation sum, eccentricity, and solidity of the de- tected cell. Xor cell-circle operator is applied between the cell and a circle having the same area and center of mass as the cell. Figure 3 shows the three steps required to determine this parameter. The area of the white region in Figure 3(c) illustrates the numerical value of the Xor cell-circle parameter. The same methodology in Xor cell- circle is used to estimate the Xor cell-convex (see Figure 4). The Xor operator here is between the cell and a con- vex which covers the cell. (a) (b) (c) Figure 3. Shape features computed, (a) BH cell type; (b) circle with the same area and center of mass as the cell; (c) Xor cell-circle. (a) (b) (c) Figure 4. Shape features computed, (a) BH cell type; (b) convex covering the cell; (c) Xor cell-co nvex. Copyright © 2013 SciRes. OPEN ACCESS 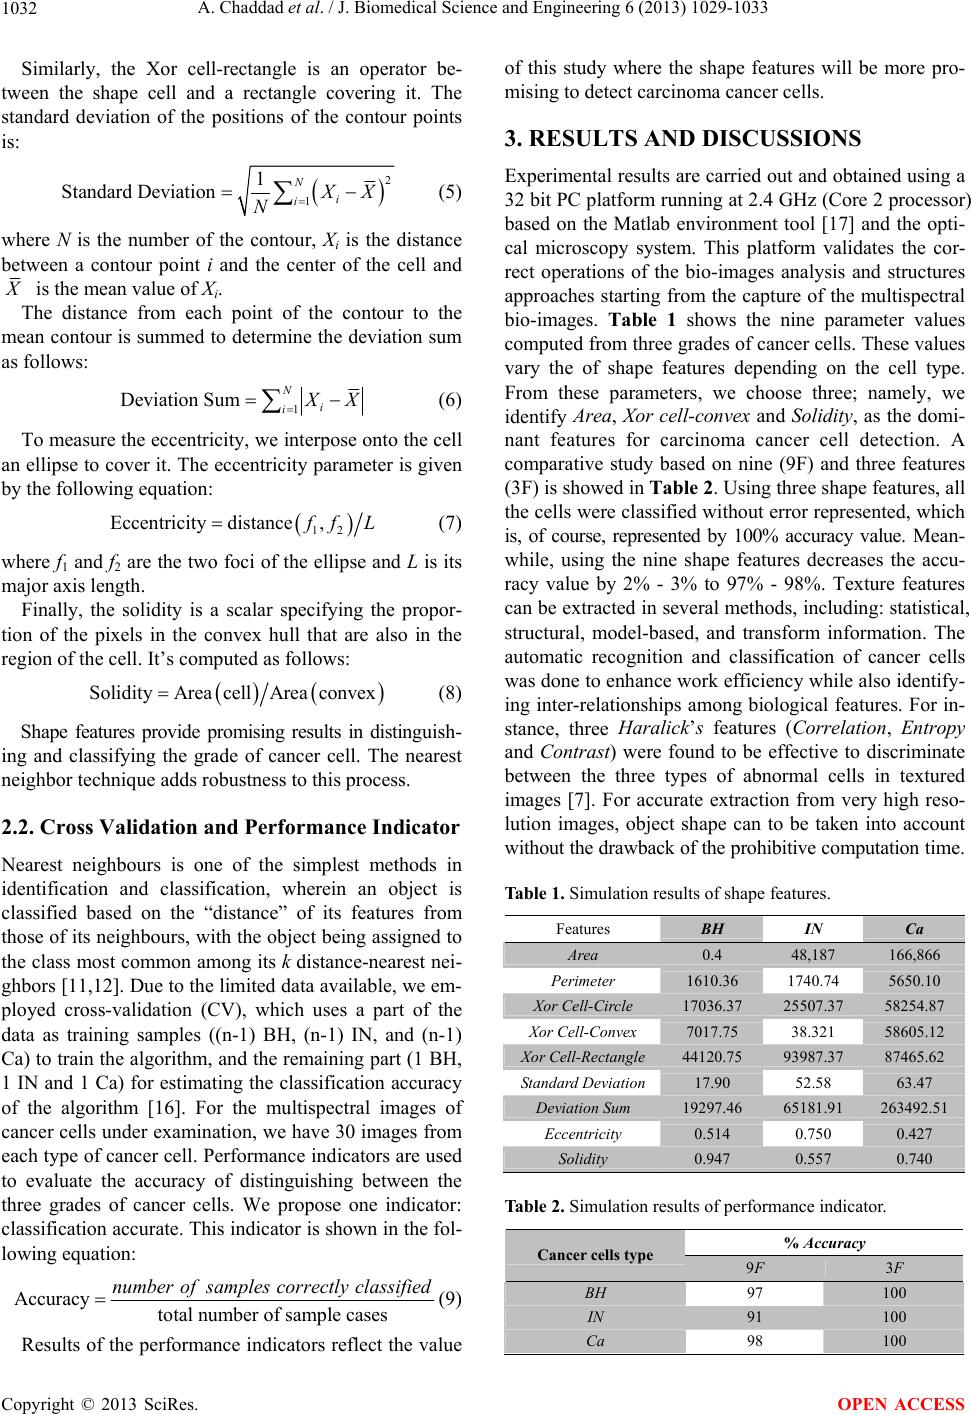 A. Chaddad et al. / J. Biomedical Science and Engineering 6 (2013) 1029-1033 1032 Similarly, the Xor cell-rectangle is an operator be- tween the shape cell and a rectangle covering it. The standard deviation of the positions of the contour points is: 2 1 1 Standard DeviationN i i X X N (5) where N is the number of the contour, Xi is the distance between a contour point i and the center of the cell and X is the mean value of Xi. The distance from each point of the contour to the mean contour is summed to determine the deviation su m as follows: 1 Deviation SumN i i X X (6) To measure the eccentricity, we interpose onto the cell an ellipse to cover it. The eccentricity p arameter is given by the following equation: 12 Eccentricity distance, f fL (7) where f1 and f2 are the two foci of the ellip se and L is its major axis length . Finally, the solidity is a scalar specifying the propor- tion of the pixels in the convex hull that are also in the region of the cell. It’s computed as follo ws: SolidityArea cellArea convex (8) Shape features provide promising results in distinguish- ing and classifying the grade of cancer cell. The nearest neighbor techniqu e adds robustness to this process. 2.2. Cross Validation and Performance Indicator Nearest neighbours is one of the simplest methods in identification and classification, wherein an object is classified based on the “distance” of its features from those of its neighbours, with the object being assigned to the class most common among its k distance-nearest nei- ghbors [11,12]. Due to th e limited data available, we em- ployed cross-validation (CV), which uses a part of the data as training samples ((n-1) BH, (n-1) IN, and (n-1) Ca) to train the algorithm, and th e remaining part (1 BH, 1 IN and 1 Ca) for estimating the classification accuracy of the algorithm [16]. For the multispectral images of cancer cells under examination, we have 30 images from each type of cancer cell. Performance indicators are used to evaluate the accuracy of distinguishing between the three grades of cancer cells. We propose one indicator: classification accurate. This indicator is shown in the fol- lowing equation: Accuracy total number of sample cases number ofsamples correctly classified (9) Results of the performance indicators reflect the value of this study where the shape features will be more pro- mising to detect carcinoma cancer cells. 3. RESULTS AND DISCUSSIONS Experimental results are carried out and obtained using a 32 bit PC platform running at 2.4 GHz (Core 2 processor) based on the Matlab environment tool [17] and the opti- cal microscopy system. This platform validates the cor- rect operations of the bio-images analysis and structures approaches starting from the capture of the multispectral bio-images. Table 1 shows the nine parameter values computed from three grades of cancer cells. These values vary the of shape features depending on the cell type. From these parameters, we choose three; namely, we identify Area, Xor cell-convex and Solidity, as the domi- nant features for carcinoma cancer cell detection. A comparative study based on nine (9F) and three features (3F) is showed in Table 2. Using three shape features, all the cells were classified without error represented, which is, of course, represented by 100% accuracy value. Mean- while, using the nine shape features decreases the accu- racy value by 2% - 3% to 97% - 98%. Texture features can be extracted in several methods, in cluding: statistical, structural, model-based, and transform information. The automatic recognition and classification of cancer cells was done to enhance work efficiency while also id entify- ing inter-relationships among biological features. For in- stance, three Haralick’s features (Correlation, Entropy and Contrast) were found to be effective to discriminate between the three types of abnormal cells in textured images [7]. For accurate extraction from very high reso- lution images, object shape can to be taken into account without the drawback of the prohibitive computation t i me . Table 1. Simulation results of shape features. Features BH IN Ca Area 0.4 48,187 166,866 Perimeter 1610.36 1740.74 5650.10 Xor Cell-Circle 17036.37 25507.37 58254.87 Xor Cell-Convex 7017.75 38.321 58605.12 Xor Cell-Rectangle 44120.75 93987.37 87465.62 Standard Deviation 17.90 52.58 63.47 Deviation Sum 19297.46 65181.91 263492.51 Eccentricity 0.514 0.750 0.427 Solidity 0.947 0.557 0.740 Table 2. Simulation results of performance indicator. % Accuracy Cancer cells type 9F 3F BH 97 100 IN 91 100 Ca 98 100 Copyright © 2013 SciRes. OPEN ACCESS  A. Chaddad et al. / J. Biomedical Science and Engineering 6 (2013) 1029-1033 1033 Thereby, shape features can be used to make the classi- fication of cancerous cells b ased on morphological image processing, i.e. the shape features in this paper. Never- theless, the cancer continuum is still a complex subject in which most laboratory research focuses on distinguishing between the cancer stages [18]. Unfortunately, the transi- tion from one stage to the next is still unclear. 4. CONCLUSION This paper proposed a method of carcinoma cancer cell detection using shape features and the nearest neighbour classifier technique. Shape features showed promising results for carcinoma cells detection. The three dominant features, Area, Xor Cell-Convex and Solidity, were found to be effective in detecting the carcinoma cells from the other grades of cancer cells, BH and IN. Performance in- dicators clearly describe our model as having higher ac- curacy and thereby lower false alarm. This proposed mo- del can be adapted to several applications in the assess- ment of both cancer and normal cells as shape features is one of the best methods in discriminating between cancer and normal cells. 5. ACKNOWLEDGEMENTS Authors would like to acknowledge the service Anapat of the CHU hospital of the Nancy-Brabois and the Architecture of Embedded Sys- tems and Smart Sensors (ASEC) team. REFERENCES [1] Seshadri Sriprasad, S., Fe neley, M.R. and Thomson, P.M. (2000) History of prostate cancer treatment. Surgical On- cology, 18, 185-191. http://dx.doi.org/10.1016/j.suronc.2009.07.001 [2] Yassin, A.Y., et al. (2006) Haematopoietic cell clusters quantification using image analysis. Biomedical Signal Processing and Control, 1, 282-288. [3] Lovisa, B., et al. (2007) Improvement of the contrast in cancer detection by autofluorescence bronchoscopy using a narrowband spectral violet excitation: A preliminary study. Biomedical Signal Processing and Control, 2, 234- 238. http://dx.doi.org/10.1016/j.bspc.2007.07.004 [4] Castanon, C.A.B., et al. (2007) Biological shape charac- terization for automatic image recognition and diagnosis of protozoan parasites of the genus Eimeria. Pattern Re- cognition, 40, 1899-910. http://dx.doi.org/10.1016/j.patcog.2006.12.006 [5] Wang, X., et al. (2008) Automated identification of ana- lyzable me taphase c hromosome s depicted on microscopic digital images. Journal of Biomedical Informatics, 41, 264-271. http://dx.doi.org/10.1016/j.jbi.2007.06.008 [6] Mayumi, D., et al. (2008) A texture approach to leuko- cyte recognition. Real-Time Imaging, 10, 205-216. [7] Chaddad, A., et al. (2011) Improving of colon cancer cells detection based on Haralick’s features on segmented histopathological images. IEEE Conference on Computer Applications and Industrial Electronics, 87-90. [8] Chaddad, A., et al. (2011) Classification of cancer cells based on morphological features from segmented multis- pectral bio-images. 4th International Conference on Bio- medical Electronics and Biomedical Informatics, 92-97. [9] Tosun, A.B., et al. (2009) Object oriented texture analysis for the unsupervised segmentation of biopsy images for cancer detection. Pattern Recognition, 42, 1104-1112. http://dx.doi.org/10.1016/j.patcog.2008.07.007 [10] Cataldo, S.D., et al. (2010) Achieving the way for auto- mated segmentation of nuclei in cancer tissue images through morphology-based approach: A quantitative eva- luation. Computerized Medical Imaging and Graphics, 34, 453-461. http://dx.doi.org/10.1016/j.compmedimag.2009.12.008 [11] Hodges, J. (1991) Nearest Neighbor (NN) Nor ms: NN Pat - tern Classification Techniques, chapter Nonparametric Dis- crimination: Small sample performance. IEEE Computer Society Press, Los Alamitos, Reprint of original work from 1952. [12] Hart, P. (1968) The condensed nearest neighbour rule. IEEE Transactions on Information Theory, 14, 515-516. http://dx.doi.org/10.1109/TIT.1968.1054155 [13] Kass, M., et al. (1988) Snakes: Active contour models. International Journal of Computer Vision, 1, 321-331. http://dx.doi.org/10.1007/BF00133570 [14] Caselles, V., et al. (1993) A geometric model for active contours in image processing. Numerische Mathematik, 66, 1-31. http://dx.doi.org/10.1007/BF01385685 [15] Malladi, R., et al. (1995) Shape modeling with front pro- pagation: A level set approach. IEEE Transactions on Pattern Analysis and Machine Intelligence, 17, 158-175. http://dx.doi.org/10.1109/34.368173 [16] Stone, M. (1974) Cross-validatory choice and assessment of statistical predictions. Journal of the Royal Statistical Society: Series B, 36, 111-147. [17] Mathworks, Matlab Software (2013) Ma thworks. [18] Chaddad, A., et al. (2013) Hardware implementation of active contour algorithm for fast cancer cells detection. IEEE, 29th Southern Biomedical Engineering Conference, 129-130. Copyright © 2013 SciRes. OPEN ACCESS |