

Paper Menu >>
Journal Menu >>
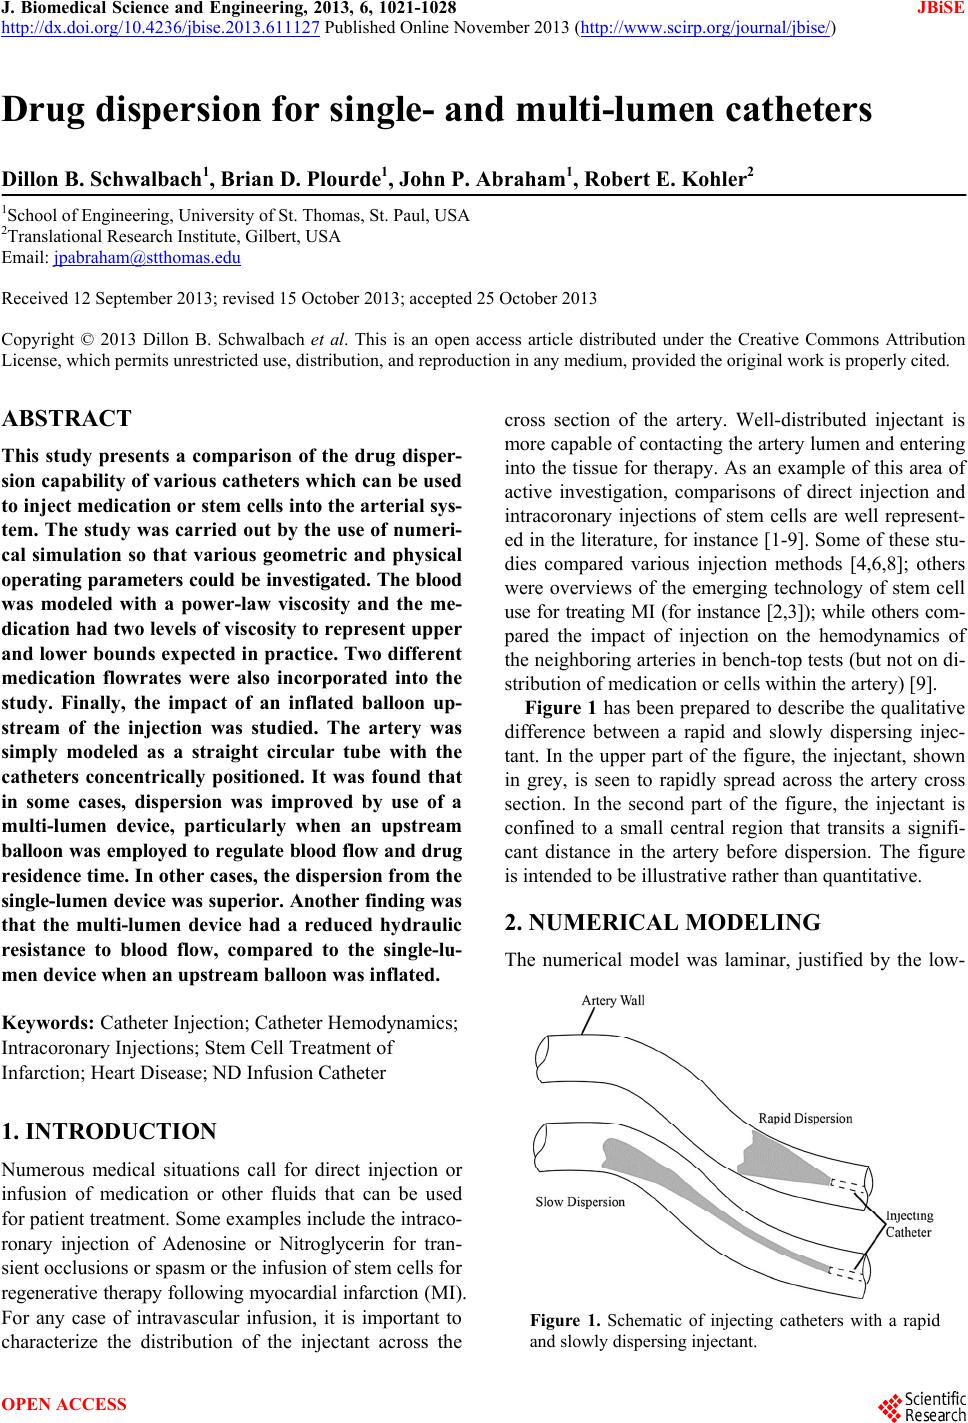 J. Biomedical Science and Engineering, 2013, 6, 1021-1028 JBiSE http://dx.doi.org/10.4236/jbise.2013.611127 Published Online November 2013 (http://www.scirp.org/journal/jbise/) Drug dispersion for single- and multi-lumen catheters Dillon B. Schwalbach1, Brian D. Plourde1, John P. Abraham1, Robert E. Kohler2 1School of Engineering, University of St. Thomas, St. Paul, USA 2Translational Research Institute, Gilbert, USA Email: [email protected] Received 12 September 2013; revised 15 October 2013; accepted 25 October 2013 Copyright © 2013 Dillon B. Schwalbach et al. This is an open access article distributed under the Creative Commons Attribution License, which permits unrestricted use, distribution, and reproduction in any medium, provided the original work is properly cited. ABSTRACT This study presents a comparison of the drug disper- sion capability of various catheters which can be used to inject medication or stem cells into the arterial sys- tem. The study was carried out by the use of numeri- cal simulation so that various geometric and physical operating parameters could be investigated. The blood was modeled with a power-law viscosity and the me- dication had two levels of viscosity to represent upper and lower bounds expected in practice. Two different medication flowrates were also incorporated into the study. Finally, the impact of an inflated balloon up- stream of the injection was studied. The artery was simply modeled as a straight circular tube with the catheters concentrically positioned. It was found that in some cases, dispersion was improved by use of a multi-lumen device, particularly when an upstream balloon was employed to regulate blood flow and drug residence time. In other cases, the dispersion from the single-lumen device was su perior. Another finding was that the multi-lumen device had a reduced hydraulic resistance to blood flow, compared to the single-lu- men device when an upstream balloon was inflated. Keywords: Catheter Injection; Catheter Hemodynamics; Intracoronary Injections; Stem Cell Treatment of Infarction; Heart Disease; ND Infusion Catheter 1. INTRODUCTION Numerous medical situations call for direct injection or infusion of medication or other fluids that can be used for patient treatment. Some examples include the intraco- ronary injection of Adenosine or Nitroglycerin for tran- sient occlusions or spasm or the infusion of stem cells for regenerative therapy following myocardial infarction (MI). For any case of intravascular infusion, it is important to characterize the distribution of the injectant across the cross section of the artery. Well-distributed injectant is more capable of contacting the artery lumen and entering into the tissue for therapy. As an example of this area of active investigation, comparisons of direct injection and intracoronary injections of stem cells are well represent- ed in the literature, for instance [1-9]. Some of these stu- dies compared various injection methods [4,6,8]; others were overviews of the emerging technology of stem cell use for treating MI (for instance [2,3]); while others com- pared the impact of injection on the hemodynamics of the neighboring arteries in bench-top tests (but not on di- stribution of medication or cells within the artery) [9]. Figure 1 has been prepared to describe the qualitative difference between a rapid and slowly dispersing injec- tant. In the upper part of the figure, the injectant, shown in grey, is seen to rapidly spread across the artery cross section. In the second part of the figure, the injectant is confined to a small central region that transits a signifi- cant distance in the artery before dispersion. The figure is intended to be illustrative rather than quantitative. 2. NUMERICAL MODELING The numerical model was laminar, justified by the low- Figure 1. Schematic of injecting catheters with a rapid and slowly dispersing injectant. OPEN ACCESS 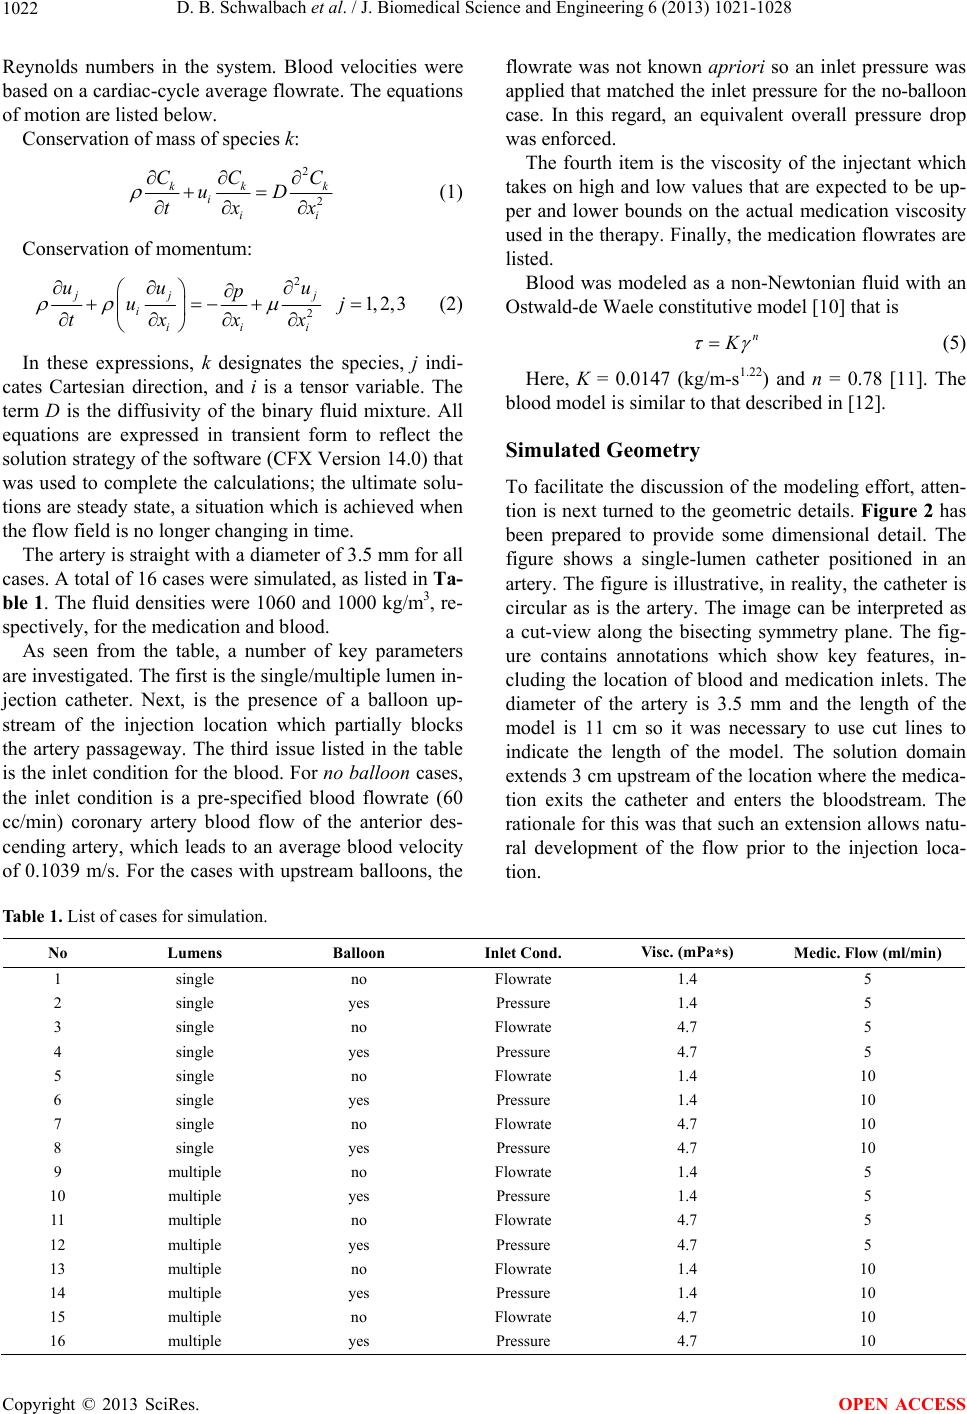 D. B. Schwalbach et al. / J. Biomedical Science and Engineering 6 (2013) 1021-1028 1022 Reynolds numbers in the system. Blood velocities were based on a cardiac-cycle average flowrate. The equations of motion are listed below. Conservation of mass of species k: 2 2 kk iii CC uD tx k C x (1) Conservation of momentum: 2 2 1,2,3 jj j iii i uu u p u txx x j (2) In these expressions, k designates the species, j indi- cates Cartesian direction, and i is a tensor variable. The term D is the diffusivity of the binary fluid mixture. All equations are expressed in transient form to reflect the solution strategy of the software (CFX Version 14.0) that was used to complete the calculations; the ultimate solu- tions are steady state, a situation which is achieved when the flow field is no longer changing in time. The artery is straight with a diameter of 3.5 mm for all cases. A total of 16 cases were simulated, as listed in Ta- ble 1. The fluid densities were 1060 and 1000 kg/m3, re- spectively, for the medication and blood. As seen from the table, a number of key parameters are investigated. The first is the single/multiple lumen in- jection catheter. Next, is the presence of a balloon up- stream of the injection location which partially blocks the artery passageway. The third issue listed in the table is the inlet condition for the blood. For no balloon cases, the inlet condition is a pre-specified blood flowrate (60 cc/min) coronary artery blood flow of the anterior des- cending artery, which leads to an average blood velocity of 0.1039 m/s. For the cases with upstream balloons, the flowrate was not known apriori so an inlet pressure was applied that matched the inlet pressure for the no-balloon case. In this regard, an equivalent overall pressure drop was enforced. The fourth item is the viscosity of the injectant which takes on high and low values that are expected to be up- per and lower bounds on the actual medication viscosity used in the therapy. Finally, the medication flowrates are listed. Blood was modeled as a non-Newtonian fluid with an Ostwald-de Waele constitutive model [10] that is n K (5) Here, K = 0.0147 (kg/m-s1.22) and n = 0.78 [11]. The blood model is similar to that described in [12]. Simulated Geometry To facilitate the discussion of the modeling effort, atten- tion is next turned to the geometric details. Figure 2 has been prepared to provide some dimensional detail. The figure shows a single-lumen catheter positioned in an artery. The figure is illustrative, in reality, the catheter is circular as is the artery. The image can be interpreted as a cut-view along the bisecting symmetry plane. The fig- ure contains annotations which show key features, in- cluding the location of blood and medication inlets. The diameter of the artery is 3.5 mm and the length of the model is 11 cm so it was necessary to use cut lines to indicate the length of the model. The solution domain extends 3 cm upstream of the location where the medica- tion exits the catheter and enters the bloodstream. The rationale for this was that such an extension allows natu- ral development of the flow prior to the injection loca- tion. Table 1. List of cases for simulation. No Lumens Balloon Inlet Cond. Visc. (mPa*s) Medic. Flow (ml/min) 1 single no Flowrate 1.4 5 2 single yes Pressure 1.4 5 3 single no Flowrate 4.7 5 4 single yes Pressure 4.7 5 5 single no Flowrate 1.4 10 6 single yes Pressure 1.4 10 7 single no Flowrate 4.7 10 8 single yes Pressure 4.7 10 9 multiple no Flowrate 1.4 5 10 multiple yes Pressure 1.4 5 11 multiple no Flowrate 4.7 5 12 multiple yes Pressure 4.7 5 13 multiple no Flowrate 1.4 10 14 multiple yes Pressure 1.4 10 15 multiple no Flowrate 4.7 10 16 multiple yes Pressure 4.7 10 Copyright © 2013 SciRes. OPEN ACCESS 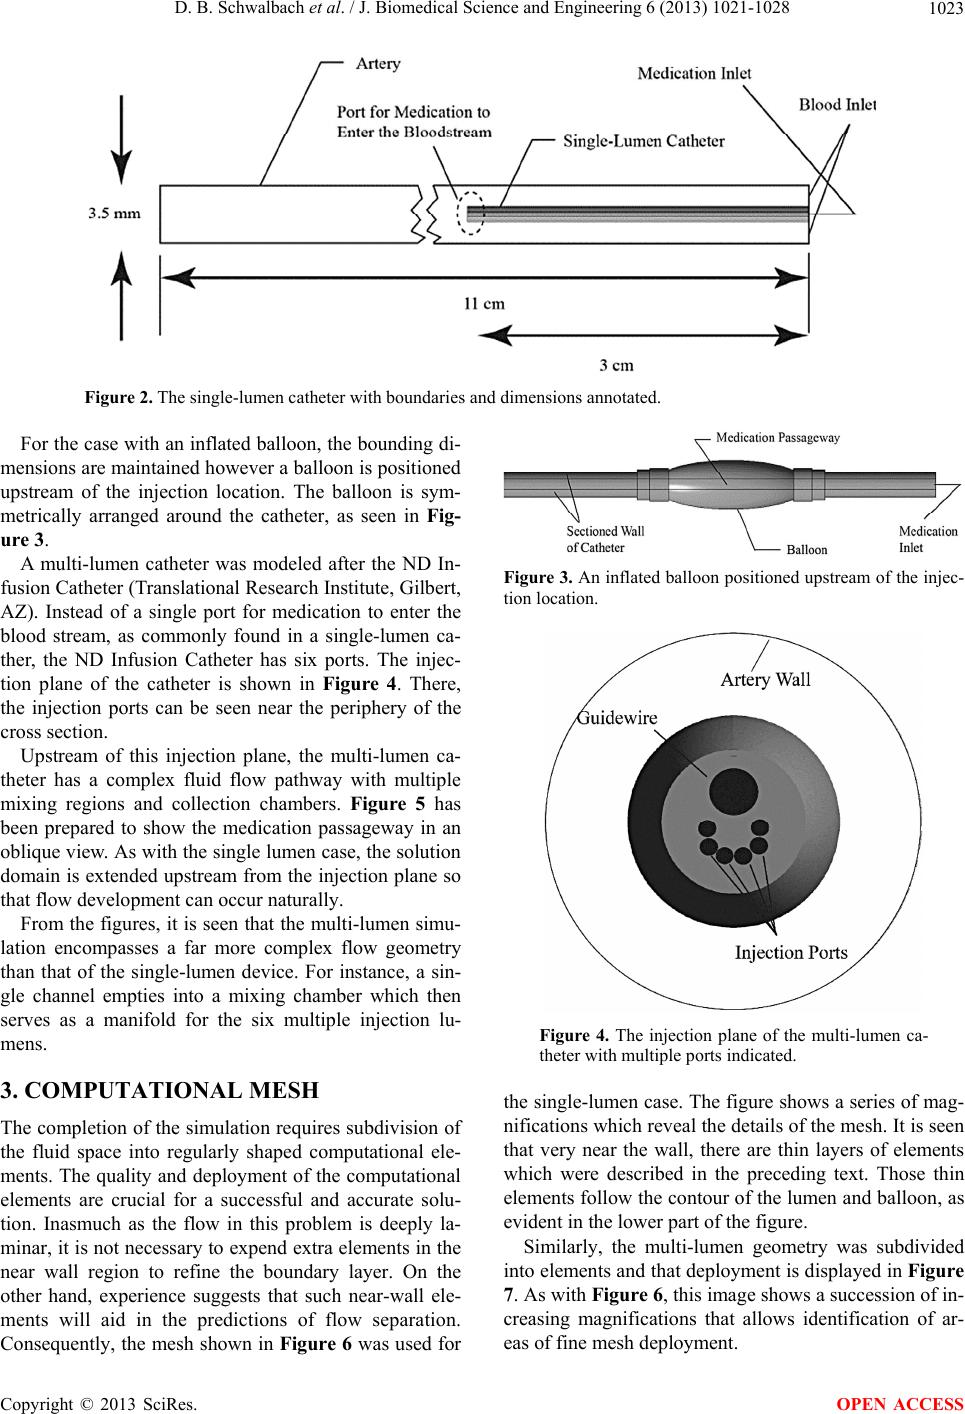 D. B. Schwalbach et al. / J. Biomedical Science and Engineering 6 (2013) 1021-1028 1023 Figure 2. The single-lumen catheter with boundaries and dimensions annotated. For the case with an inflated balloon, the bounding di- mensions are maintained however a balloon is positioned upstream of the injection location. The balloon is sym- metrically arranged around the catheter, as seen in Fig- ure 3. A multi-lumen catheter was modeled after the ND In- fusion Catheter (Translational Research Institute, Gilbert, AZ). Instead of a single port for medication to enter the blood stream, as commonly found in a single-lumen ca- ther, the ND Infusion Catheter has six ports. The injec- tion plane of the catheter is shown in Figure 4. There, the injection ports can be seen near the periphery of the cross section. Upstream of this injection plane, the multi-lumen ca- theter has a complex fluid flow pathway with multiple mixing regions and collection chambers. Figure 5 has been prepared to show the medication passageway in an oblique view. As with the single lumen case, the solution domain is extended upstream from the injection plane so that flow development can occur naturally. From the figures, it is seen that the multi-lumen simu- lation encompasses a far more complex flow geometry than that of the single-lumen device. For instance, a sin- gle channel empties into a mixing chamber which then serves as a manifold for the six multiple injection lu- mens. 3. COMPUTATIONAL MESH The completion of the simulation requires subdivision of the fluid space into regularly shaped computational ele- ments. The quality and deployment of the computational elements are crucial for a successful and accurate solu- tion. Inasmuch as the flow in this problem is deeply la- minar, it is not necessary to expend extra elements in the near wall region to refine the boundary layer. On the other hand, experience suggests that such near-wall ele- ments will aid in the predictions of flow separation. Consequently, the mesh shown in Figure 6 was used for Figure 3. An inflated balloon positioned upstream of the injec- tion location. Figure 4. The injection plane of the multi-lumen ca- theter with multiple ports indicated. the single-lumen case. The figure shows a series of mag- nifications which reveal the details of the mesh. It is seen that very near the wall, there are thin layers of elements which were described in the preceding text. Those thin elements follow the contour of the lumen and balloon, as evident in the lower part of the figure. Similarly, the multi-lumen geometry was subdivided into elements and that deployment is displayed in Figure 7. As with Figure 6, this image shows a succession of in- creasing magnifications that allows identification of ar- eas of fine mesh deployment. Copyright © 2013 SciRes. OPEN ACCESS 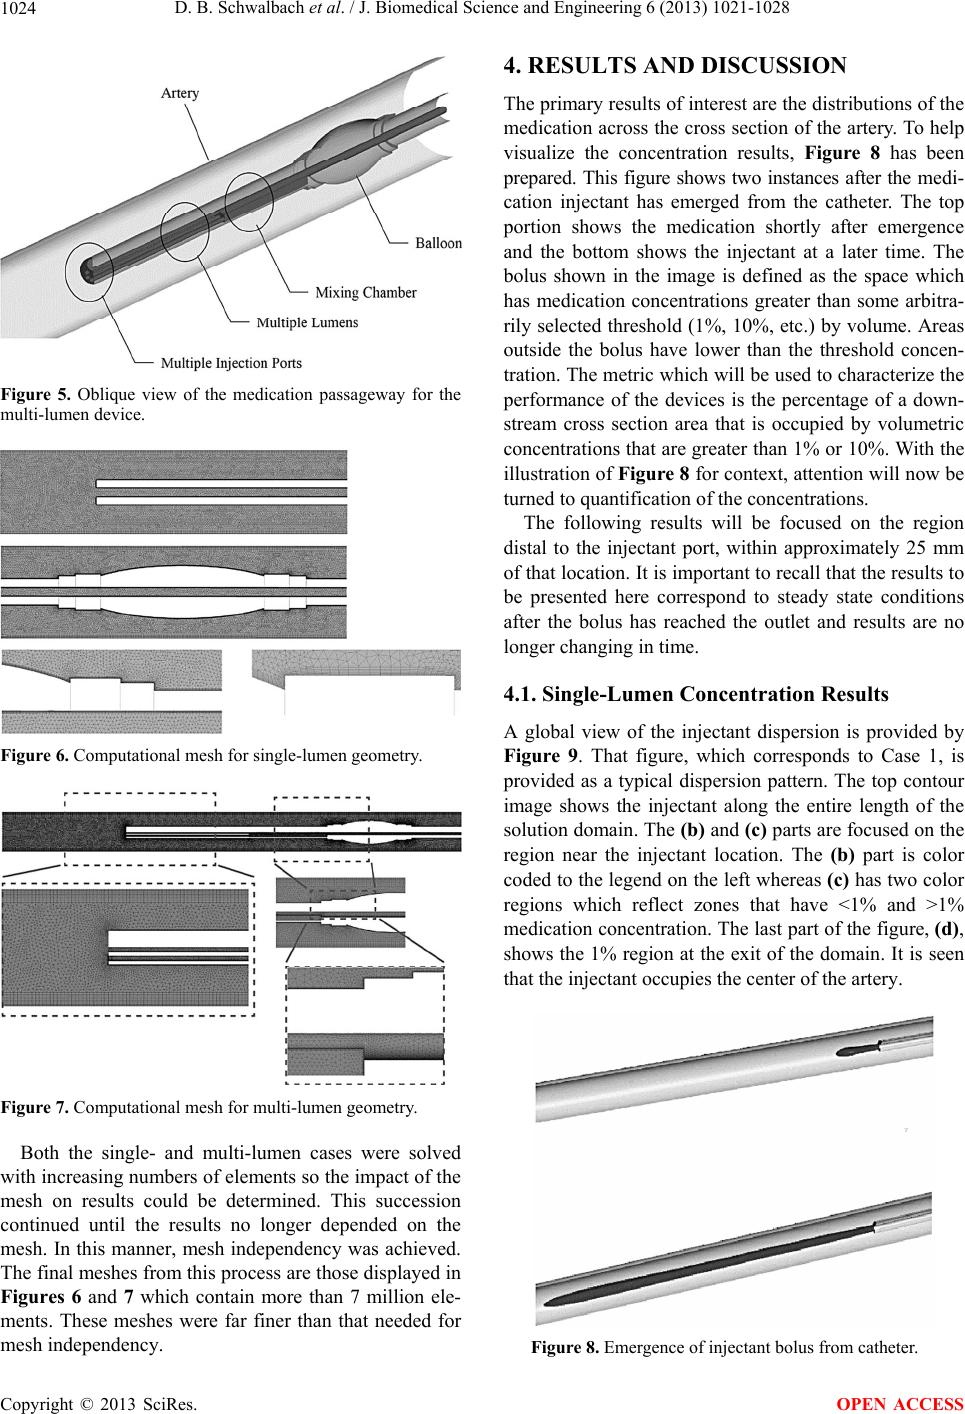 D. B. Schwalbach et al. / J. Biomedical Science and Engineering 6 (2013) 1021-1028 1024 Figure 5. Oblique view of the medication passageway for the multi-lumen device. Figure 6. Computational mesh for single-lumen geometry. Figure 7. Computational mesh for multi-lumen geometry. Both the single- and multi-lumen cases were solved with increasing numbers of elements so the impact of the mesh on results could be determined. This succession continued until the results no longer depended on the mesh. In this manner, mesh independency was achieved. The final meshes from this process are those displayed in Figures 6 and 7 which contain more than 7 million ele- ments. These meshes were far finer than that needed for mesh independency. 4. RESULTS AND DISCUSSION The primary results of interest are the distributions of the medication across the cross section of the artery. To help visualize the concentration results, Figure 8 has been prepared. This figure shows two instances after the medi- cation injectant has emerged from the catheter. The top portion shows the medication shortly after emergence and the bottom shows the injectant at a later time. The bolus shown in the image is defined as the space which has medication concentrations greater than some arbitra- rily selected threshold (1%, 10%, etc.) by volume. Areas outside the bolus have lower than the threshold concen- tration. The metric which will be used to characterize the performance of the devices is the percentage of a down- stream cross section area that is occupied by volumetric concentrations that are greater than 1% or 10%. With the illustration of Figure 8 for context, attention will now be turned to quantification of the concentrations. The following results will be focused on the region distal to the injectant port, within approximately 25 mm of that location. It is important to recall that the results to be presented here correspond to steady state conditions after the bolus has reached the outlet and results are no longer changing in time. 4.1. Single-Lumen Concentration Results A global view of the injectant dispersion is provided by Figure 9. That figure, which corresponds to Case 1, is provided as a typical dispersion pattern. The top contour image shows the injectant along the entire length of the solution domain. The (b) and (c) parts are focused on the region near the injectant location. The (b) part is color coded to the legend on the left whereas (c) has two color regions which reflect zones that have <1% and >1% medication concentration. The last part of the figure, (d), shows the 1% region at the exit of the domain. It is seen that the injectant occupies the center of the artery. Figure 8. Emergence of injectant bolus from catheter. Copyright © 2013 SciRes. OPEN ACCESS 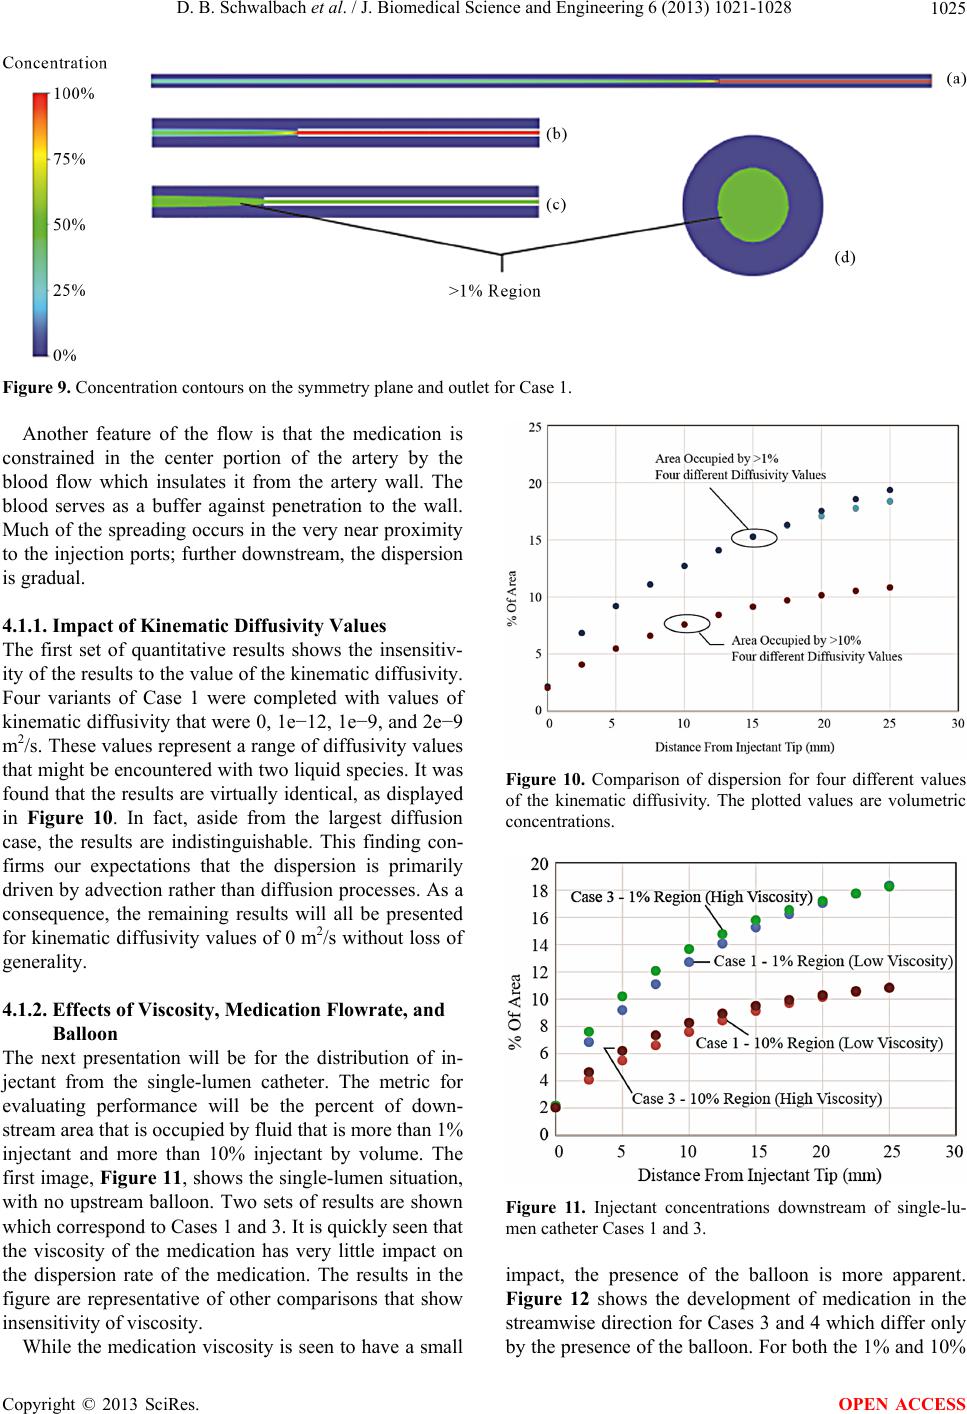 D. B. Schwalbach et al. / J. Biomedical Science and Engineering 6 (2013) 1021-1028 Copyright © 2013 SciRes. 1025 Figure 9. Concentration contours on the symmetry plane and outlet for Case 1. Another feature of the flow is that the medication is constrained in the center portion of the artery by the blood flow which insulates it from the artery wall. The blood serves as a buffer against penetration to the wall. Much of the spreading occurs in the very near proximity to the injection ports; further downstream, the dispersion is gradual. 4.1.1. Impact of Kinem ati c Di ff usi vit y Values The first set of quantitative results shows the insensitiv- ity of the results to the value of the kinematic diffusivity. Four variants of Case 1 were completed with values of kinematic diffusivity that were 0, 1e−12, 1e−9, and 2e−9 m2/s. These values represent a range of diffusivity values that might be encountered with two liquid species. It was found that the results are virtually identical, as displayed in Figure 10. In fact, aside from the largest diffusion case, the results are indistinguishable. This finding con- firms our expectations that the dispersion is primarily driven by advection rather than diffusion processes. As a consequence, the remaining results will all be presented for kinematic diffusivity values of 0 m2/s without loss of generality. Figure 10. Comparison of dispersion for four different values of the kinematic diffusivity. The plotted values are volumetric concentrations. 4.1.2. Effects of Viscosity, Medication Flowrate, and Balloon The next presentation will be for the distribution of in- jectant from the single-lumen catheter. The metric for evaluating performance will be the percent of down- stream area that is occupied by fluid that is more than 1% injectant and more than 10% injectant by volume. The first image, Figure 11, shows the single-lumen situation, with no upstream balloon. Two sets of results are shown which correspond to Cases 1 and 3. It is quickly seen that the viscosity of the medication has very little impact on the dispersion rate of the medication. The results in the figure are representative of other comparisons that show insensitivity of viscosity. Figure 11. Injectant concentrations downstream of single-lu- men catheter Cases 1 and 3. impact, the presence of the balloon is more apparent. Figure 12 shows the development of medication in the streamwise direction for Cases 3 and 4 which differ only by the presence of the balloon. For both the 1% and 10% While the medication viscosity is seen to have a small OPEN ACCESS 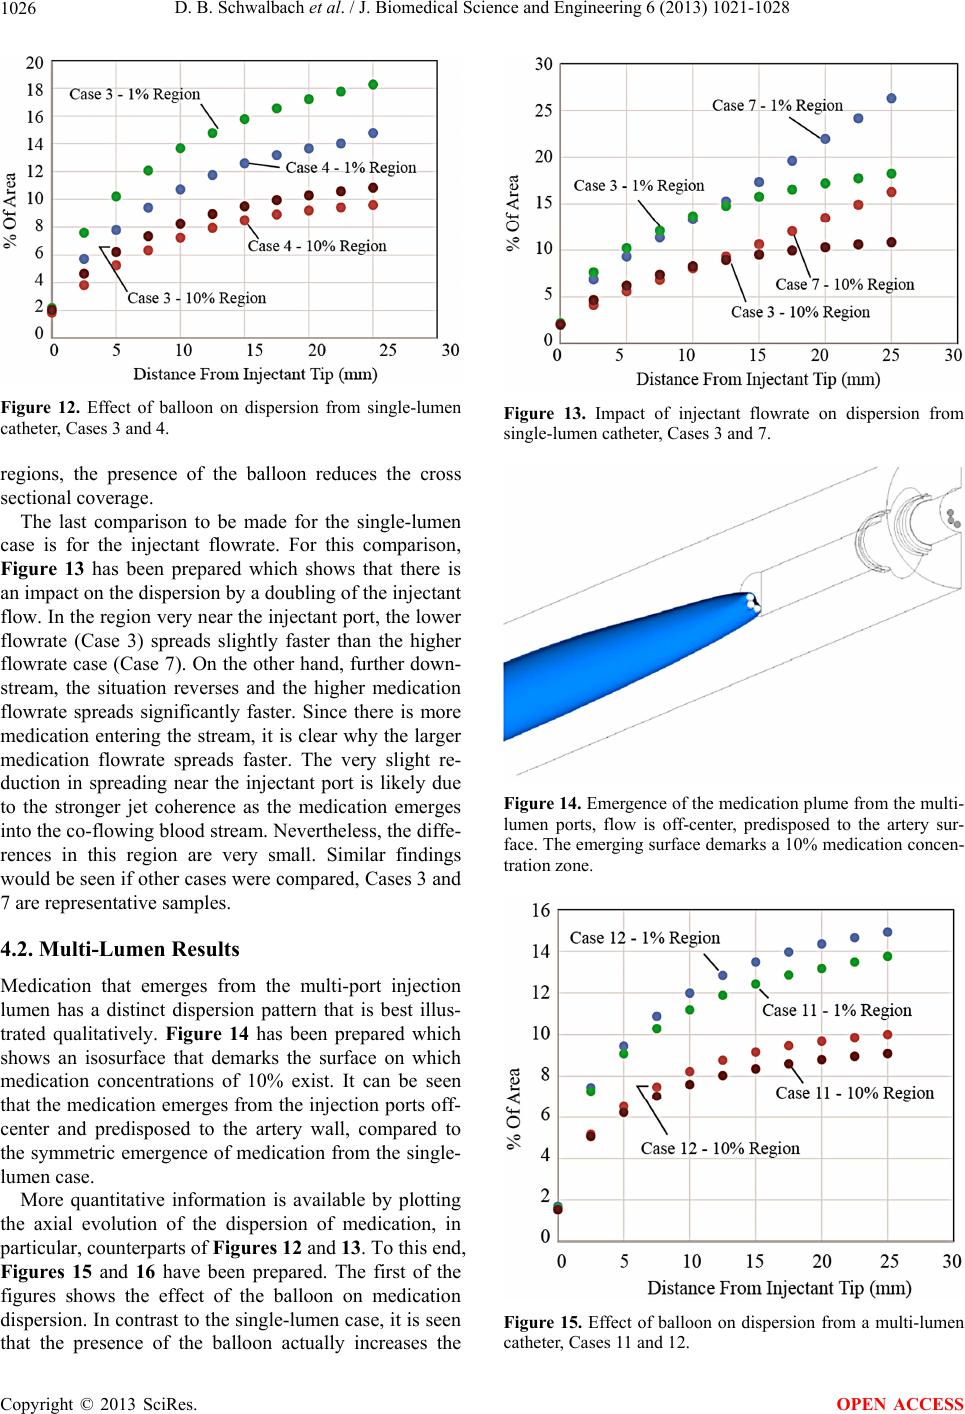 D. B. Schwalbach et al. / J. Biomedical Science and Engineering 6 (2013) 1021-1028 1026 Figure 12. Effect of balloon on dispersion from single-lumen catheter, Cases 3 and 4. regions, the presence of the balloon reduces the cross sectional coverage. The last comparison to be made for the single-lumen case is for the injectant flowrate. For this comparison, Figure 13 has been prepared which shows that there is an impact on the dispersion by a doubling of the injectant flow. In the region very near the injectant port, the lower flowrate (Case 3) spreads slightly faster than the higher flowrate case (Case 7). On the other hand, further down- stream, the situation reverses and the higher medication flowrate spreads significantly faster. Since there is more medication entering the stream, it is clear why the larger medication flowrate spreads faster. The very slight re- duction in spreading near the injectant port is likely due to the stronger jet coherence as the medication emerges into the co-flowing blood stream. Nevertheless, the diffe- rences in this region are very small. Similar findings would be seen if other cases were compared, Cases 3 and 7 are representative samples. 4.2. Multi-Lumen Results Medication that emerges from the multi-port injection lumen has a distinct dispersion pattern that is best illus- trated qualitatively. Figure 14 has been prepared which shows an isosurface that demarks the surface on which medication concentrations of 10% exist. It can be seen that the medication emerges from the injection ports off- center and predisposed to the artery wall, compared to the symmetric emergence of medication from the single- lumen case. More quantitative information is available by plotting the axial evolution of the dispersion of medication, in particular, counterparts of Figures 12 and 13. To this end, Figures 15 and 16 have been prepared. The first of the figures shows the effect of the balloon on medication dispersion. In contrast to the single-lumen case, it is seen that the presence of the balloon actually increases the Figure 13. Impact of injectant flowrate on dispersion from single-lumen catheter, Cases 3 and 7. Figure 14. Emergence of the medication plume from the multi- lumen ports, flow is off-center, predisposed to the artery sur- face. The emerging surface demarks a 10% medication concen- tration zone. Figure 15. Effect of balloon on dispersion from a multi-lumen catheter, Cases 11 and 12. Copyright © 2013 SciRes. OPEN ACCESS 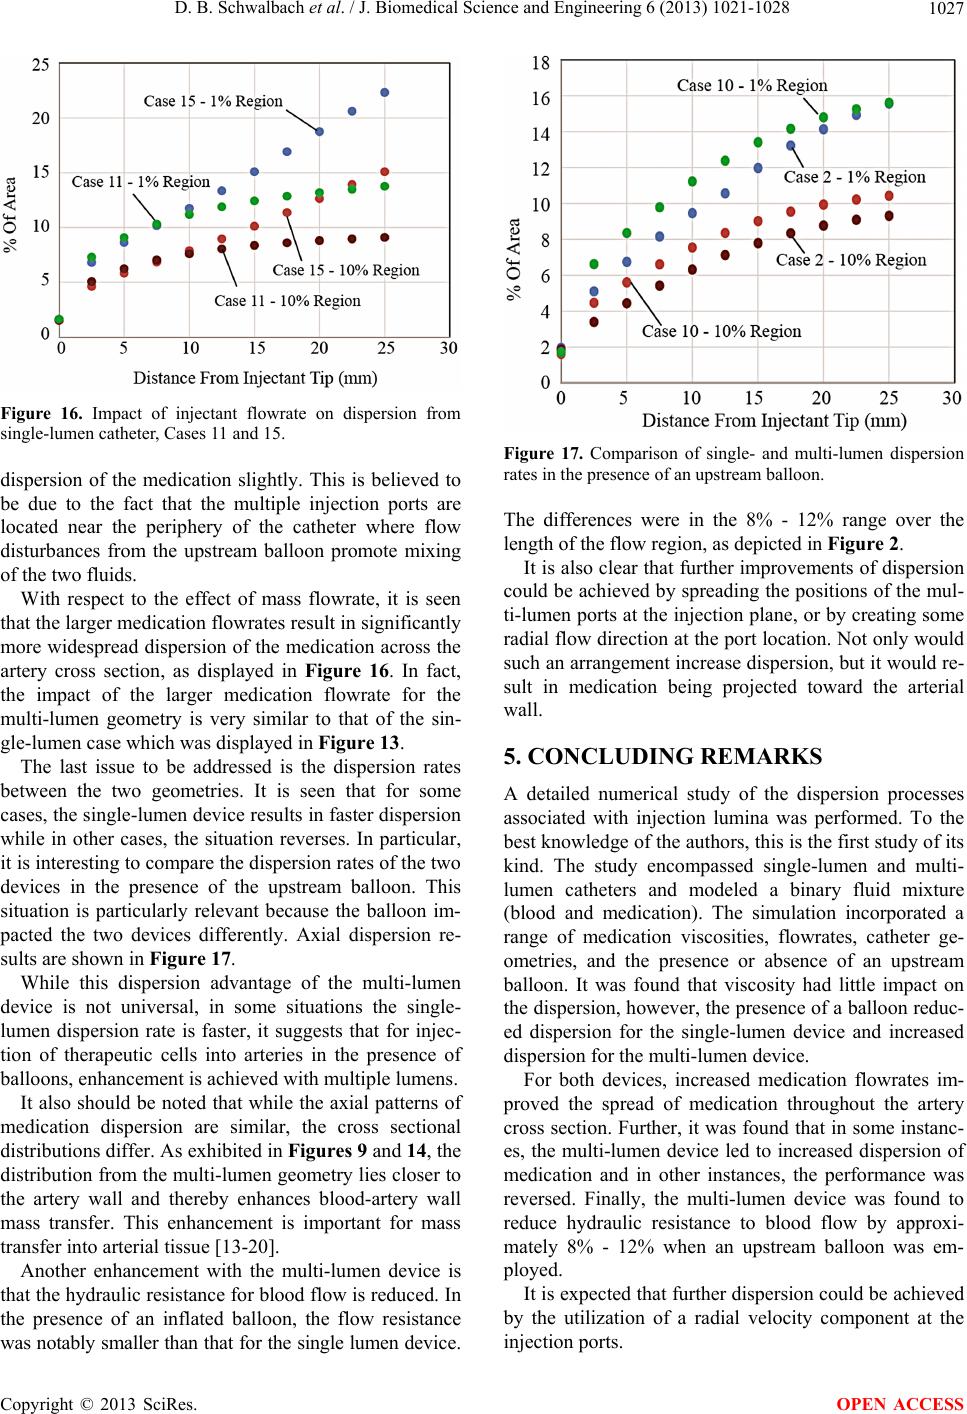 D. B. Schwalbach et al. / J. Biomedical Science and Engineering 6 (2013) 1021-1028 1027 Figure 16. Impact of injectant flowrate on dispersion from single-lumen catheter, Cases 11 and 15. dispersion of the medication slightly. This is believed to be due to the fact that the multiple injection ports are located near the periphery of the catheter where flow disturbances from the upstream balloon promote mixing of the two fluids. With respect to the effect of mass flowrate, it is seen that the larger medication flowrates result in significantly more widespread dispersion of the medication across the artery cross section, as displayed in Figure 16. In fact, the impact of the larger medication flowrate for the multi-lumen geometry is very similar to that of the sin- gle-lumen case which was displayed in Figure 13. The last issue to be addressed is the dispersion rates between the two geometries. It is seen that for some cases, the single-lumen device results in faster dispersion while in other cases, the situation reverses. In particular, it is interesting to compare the dispersion rates of the two devices in the presence of the upstream balloon. This situation is particularly relevant because the balloon im- pacted the two devices differently. Axial dispersion re- sults are shown in Figure 17. While this dispersion advantage of the multi-lumen device is not universal, in some situations the single- lumen dispersion rate is faster, it suggests that for injec- tion of therapeutic cells into arteries in the presence of balloons, enhancement is achieved with multiple lumens. It also should be noted that while the axial patterns of medication dispersion are similar, the cross sectional distributions differ. As exhibited in Figures 9 and 14, the distribution from the multi-lumen geometry lies closer to the artery wall and thereby enhances blood-artery wall mass transfer. This enhancement is important for mass transfer into arterial tissue [13-20]. Another enhancement with the multi-lumen device is that the hydraulic resistance for blood flow is reduced. In the presence of an inflated balloon, the flow resistance was notably smaller than that for the single lumen device. Figure 17. Comparison of single- and multi-lumen dispersion rates in the presence of an upstream balloon. The differences were in the 8% - 12% range over the length of the flow region, as depicted in Figure 2. It is also clear that further improvements of dispersion could be achieved by spreading the positions of the mul- ti-lumen ports at the injection plane, or by creating some radial flow direction at the port location. Not only would such an arrangement increase dispersion, but it would re- sult in medication being projected toward the arterial wall. 5. CONCLUDING REMARKS A detailed numerical study of the dispersion processes associated with injection lumina was performed. To the best knowledge of the authors, this is the first study of its kind. The study encompassed single-lumen and multi- lumen catheters and modeled a binary fluid mixture (blood and medication). The simulation incorporated a range of medication viscosities, flowrates, catheter ge- ometries, and the presence or absence of an upstream balloon. It was found that viscosity had little impact on the dispersion, however, the presence of a balloon reduc- ed dispersion for the single-lumen device and increased dispersion for the multi-lumen device. For both devices, increased medication flowrates im- proved the spread of medication throughout the artery cross section. Further, it was found that in some instanc- es, the multi-lumen device led to increased dispersion of medication and in other instances, the performance was reversed. Finally, the multi-lumen device was found to reduce hydraulic resistance to blood flow by approxi- mately 8% - 12% when an upstream balloon was em- ployed. It is expected that further dispersion could be achieved by the utilization of a radial velocity component at the injection ports. Copyright © 2013 SciRes. OPEN ACCESS 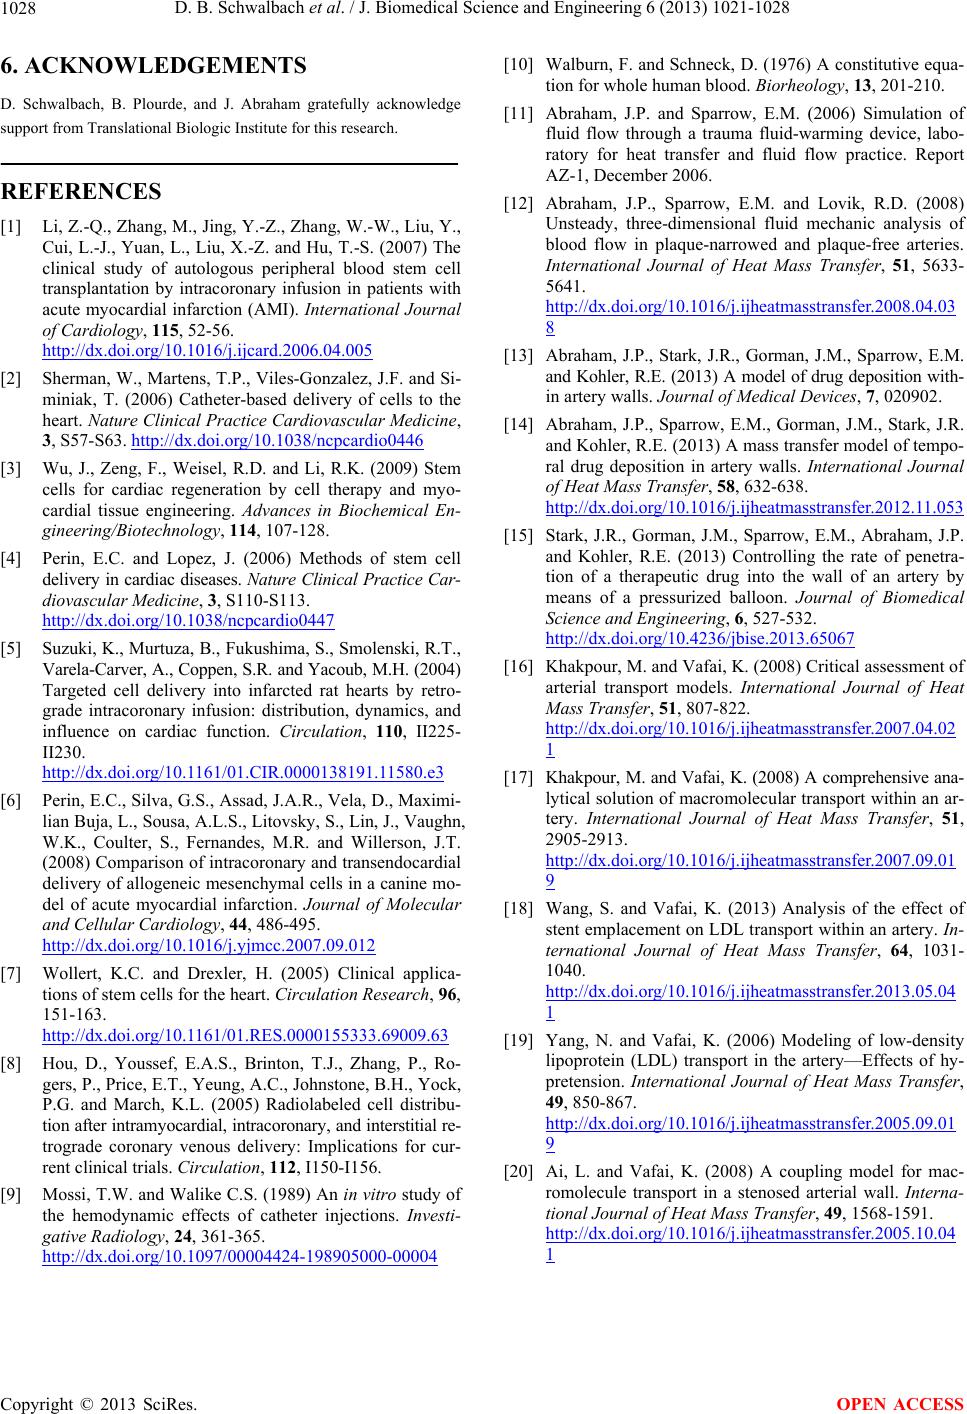 D. B. Schwalbach et al. / J. Biomedical Science and Engineering 6 (2013) 1021-1028 Copyright © 2013 SciRes. 1028 6. ACKNOWLEDGEMENTS [10] Walburn, F. and Schneck, D. (1976) A constitutive equa- tion for whole human blood. Biorheology, 13, 201-210. D. Schwalbach, B. Plourde, and J. Abraham gratefully acknowledge support from Translational Biologic Institute for this research. [11] Abraham, J.P. and Sparrow, E.M. (2006) Simulation of fluid flow through a trauma fluid-warming device, labo- ratory for heat transfer and fluid flow practice. Report AZ-1, December 2006. REFERENCES [12] Abraham, J.P., Sparrow, E.M. and Lovik, R.D. (2008) Unsteady, three-dimensional fluid mechanic analysis of blood flow in plaque-narrowed and plaque-free arteries. International Journal of Heat Mass Transfer, 51, 5633- 5641. http://dx.doi.org/10.1016/j.ijheatmasstransfer.2008.04.03 8 [1] Li, Z.-Q., Zhang, M., Jing, Y.-Z., Zhang, W.-W., Liu, Y., Cui, L.-J., Yuan, L., Liu, X.-Z. and Hu, T.-S. (2007) The clinical study of autologous peripheral blood stem cell transplantation by intracoronary infusion in patients with acute myocardial infarction (AMI). International Journal of Cardiology, 115, 52-56. http://dx.doi.org/10.1016/j.ijcard.2006.04.005 [13] Abraham, J.P., Stark, J.R., Gorman, J.M., Sparrow, E.M. and Kohler, R.E. (2013) A model of drug deposition with- in artery walls. Journal of Medical Devices, 7, 020902. [2] Sherman, W., Martens, T.P., Viles-Gonzalez, J.F. and Si- miniak, T. (2006) Catheter-based delivery of cells to the heart. Nature Clinical Practice Cardiovascular Medicine, 3, S57-S63. http://dx.doi.org/10.1038/ncpcardio0446 [14] Abraham, J.P., Sparrow, E.M., Gorman, J.M., Stark, J.R. and Kohler, R.E. (2013) A mass transfer model of tempo- ral drug deposition in artery walls. International Journal of Heat Mass Transfer, 58, 632-638. http://dx.doi.org/10.1016/j.ijheatmasstransfer.2012.11.053 [3] Wu, J., Zeng, F., Weisel, R.D. and Li, R.K. (2009) Stem cells for cardiac regeneration by cell therapy and myo- cardial tissue engineering. Advances in Biochemical En- gineering/Biotechnology, 114, 107-128. [15] Stark, J.R., Gorman, J.M., Sparrow, E.M., Abraham, J.P. and Kohler, R.E. (2013) Controlling the rate of penetra- tion of a therapeutic drug into the wall of an artery by means of a pressurized balloon. Journal of Biomedical Science and Engineering, 6, 527-532. http://dx.doi.org/10.4236/jbise.2013.65067 [4] Perin, E.C. and Lopez, J. (2006) Methods of stem cell delivery in cardiac diseases. Nature Clinical Practice Car- diovascular Medicine, 3, S110-S113. http://dx.doi.org/10.1038/ncpcardio0447 [5] Suzuki, K., Murtuza, B., Fukushima, S., Smolenski, R.T., Varela-Carver, A., Coppen, S.R. and Yacoub, M.H. (2004) Targeted cell delivery into infarcted rat hearts by retro- grade intracoronary infusion: distribution, dynamics, and influence on cardiac function. Circulation, 110, II225- II230. http://dx.doi.org/10.1161/01.CIR.0000138191.11580.e3 [16] Khakpour, M. and Vafai, K. (2008) Critical assessment of arterial transport models. International Journal of Heat Mass Transfer, 51, 807-822. http://dx.doi.org/10.1016/j.ijheatmasstransfer.2007.04.02 1 [17] Khakpour, M. and Vafai, K. (2008) A comprehensive ana- lytical solution of macromolecular transport within an ar- tery. International Journal of Heat Mass Transfer, 51, 2905-2913. http://dx.doi.org/10.1016/j.ijheatmasstransfer.2007.09.01 9 [6] Perin, E.C., Silva, G.S., Assad, J.A.R., Vela, D., Maximi- lian Buja, L., Sousa, A.L.S., Litovsky, S., Lin, J., Vaughn, W.K., Coulter, S., Fernandes, M.R. and Willerson, J.T. (2008) Comparison of intracoronary and transendocardial delivery of allogeneic mesenchymal cells in a canine mo- del of acute myocardial infarction. Journal of Molecular and Cellular Cardiology, 44, 486-495. http://dx.doi.org/10.1016/j.yjmcc.2007.09.012 [18] Wang, S. and Vafai, K. (2013) Analysis of the effect of stent emplacement on LDL transport within an artery. In- ternational Journal of Heat Mass Transfer, 64, 1031- 1040. http://dx.doi.org/10.1016/j.ijheatmasstransfer.2013.05.04 1 [7] Wollert, K.C. and Drexler, H. (2005) Clinical applica- tions of stem cells for the heart. Circulation Research, 96, 151-163. http://dx.doi.org/10.1161/01.RES.0000155333.69009.63 [19] Yang, N. and Vafai, K. (2006) Modeling of low-density lipoprotein (LDL) transport in the artery—Effects of hy- pretension. International Journal of Heat Mass Transfer, 49, 850-867. http://dx.doi.org/10.1016/j.ijheatmasstransfer.2005.09.01 9 [8] Hou, D., Youssef, E.A.S., Brinton, T.J., Zhang, P., Ro- gers, P., Price, E.T., Yeung, A.C., Johnstone, B.H., Yock, P.G. and March, K.L. (2005) Radiolabeled cell distribu- tion after intramyocardial, intracoronary, and interstitial re- trograde coronary venous delivery: Implications for cur- rent clinical trials. Circulation, 112, I150-I156. [20] Ai, L. and Vafai, K. (2008) A coupling model for mac- romolecule transport in a stenosed arterial wall. Interna- tional Journal of Heat Mass Transfer, 49, 1568-1591. http://dx.doi.org/10.1016/j.ijheatmasstransfer.2005.10.04 1 [9] Mossi, T.W. and Walike C.S. (1989) An in vitro study of the hemodynamic effects of catheter injections. Investi- gative Radiology, 24, 361-365. http://dx.doi.org/10.1097/00004424-198905000-00004 OPEN ACCESS |