

Paper Menu >>
Journal Menu >>
 iBusiness, 2013, 5, 90-95 http://dx.doi.org/10.4236/ib.2013.53B019 Published Online September 2013 (http://www.scirp.org/journal/ib) Nurse Staff Allocation in a Multi-stage Queuing System with Patients’ Feedback Flow for an Outpatient Department Huabo Zhu, Jiafu Tang, Jun Gong College of Information Science and Engineering, Northeastern University, State Key Laboratory of Synthetical Automation for Process Industries (Northeastern University), Shenyang, Liaoning 110819, China. Email: [email protected] Received July, 2013 ABSTRACT A general multi-stage queuing system model with patients’ feedback flow is developed to address the behavior of pa- tients’ flow in an Outpatient Department (OD) in a hospital. The whole process includes registration, diagnosis, chemi- cal examination, payment, and medicine-taking. Focusing on nurse resources, the formulas of performance indicators such as patient waiting times and nurse idle times are derived by using the system parameters. A mathematical pro- gramming model is developed to determine how many nurses should be allocated to each stage to minimize the total costs of patient waiting times and nurse idle times. The neighborhood search combined Simulated Annealing (NS-SA) is developed to solve the model, which is essentially a natural number decomposition problem. Numerical experiments are conducted to analyze the discipline of nurse allocation and the impact of patient arrival rates and the probability of patient’s feedback flow on the system costs. The research results will be helpful for hospital managers to make deci- sions on allocation of nurse staff in practice. Keywords: Queuing; Nurse Staff Allocation; Healthcare; Simulated Annealing 1. Introduction Over the years, hospital managers continually confront many challenges, such as providing better service quality, with less nurse staff and more patients. Especially, those conflicts are more severe in the out patient departments (OD)[1]. For example, there are 171,024 outpatients in a general hospital in Dalian, and 2,264,733 outpatients in a famous union hospital in Beijing, China in 2010. How to provide better service level with limited resources and increasing outpatients is a key problem in the hospital so that more and more researchers and practitioners begin to address it in recent years. Health care service systems are essentially queuing systems. Queuing theory as an efficient tool has been used frequently to address the behavior of health-care service systems since Jackson network model waspro- posed in 1957[2-5]. Nurse staff allocation in multi-stage queuing system with patients’ feedback flow for OD is mainly concerned in this paper. Around of the queuing system in hospital Jlassi (2010) made a review on multi- ple customer types in Emergency Department(ED)[6]. According to the performance indicators such as patient waiting times, and the probability of nurse idle times in the multi-severs queuing systems, Abadi(2000)[7] and Balsamo made some analysis[8]. A three tandem queuing system was founded by El-Darzi (1998) in a hospital geriatric department[9]. Koizumi (2005) formulated a model of patient flows using a queuing network with blocking with finite waiting space and the feedback pa- tients flow[10]. Carolina (2009) presented an analytic queuing network model which preserves the finite capac- ity of queues and used structural parameters to obtain the correlation between two stages[11]. The variation in pa- tient flows is described by Kurt (2011) with the help of the work of [10,11]. However he paid no attention to the structure of the queuing networks and the patients flow- variability[12]. Some insights of patient flows just as the feedback patients flow in hospital are derived by Hall (2006), Helm (2011), Price (2011)[13-15].Focusing on the staffing allocation Ruger(2007) identified high-risk patients for triage and resource allocation in ED[16]. Mohamed(2009)made a simulation optimization model for an emergency department healthcare unit in Ku- wait[17]. Navid(2012)set nurses staffing requirements for time dependent queuing network in ED with the square root method[18]. Kurt(2011)developed anew heu- Copyright © 2013 SciRes. IB 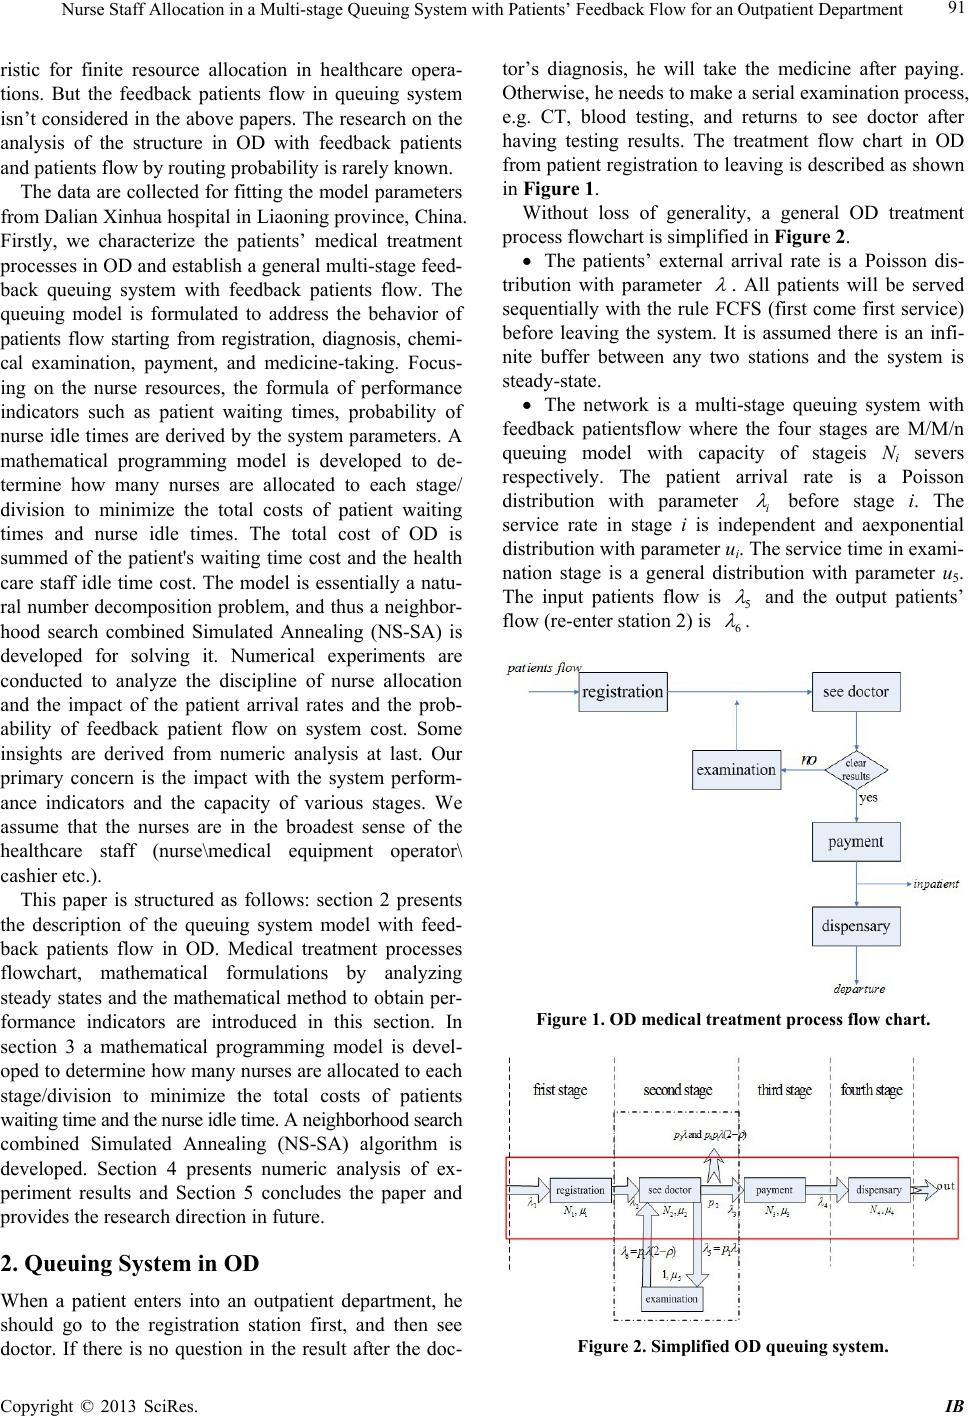 Nurse Staff Allocation in a Multi-stage Queuing System with Patients’ Feedback Flow for an Outpatient Department 91 ristic for finite resource allocation in healthcare opera- tions. But the feedback patients flow in queuing system isn’t considered in the above papers. The research on the analysis of the structure in OD with feedback patients and patients flow by routing probability is rarely known. The data are collected for fitting the model parameters from Dalian Xinhua hospital in Liaoning province, China. Firstly, we characterize the patients’ medical treatment processes in OD and establish a general multi-stage feed- back queuing system with feedback patients flow. The queuing model is formulated to address the behavior of patients flow starting from registration, diagnosis, chemi- cal examination, payment, and medicine-taking. Focus- ing on the nurse resources, the formula of performance indicators such as patient waiting times, probability of nurse idle times are derived by the system parameters. A mathematical programming model is developed to de- termine how many nurses are allocated to each stage/ division to minimize the total costs of patient waiting times and nurse idle times. The total cost of OD is summed of the patient's waiting time cost and the health care staff idle time cost. The model is essentially a natu- ral number decomposition problem, and thus a neighbor- hood search combined Simulated Annealing (NS-SA) is developed for solving it. Numerical experiments are conducted to analyze the discipline of nurse allocation and the impact of the patient arrival rates and the prob- ability of feedback patient flow on system cost. Some insights are derived from numeric analysis at last. Our primary concern is the impact with the system perform- ance indicators and the capacity of various stages. We assume that the nurses are in the broadest sense of the healthcare staff (nurse\medical equipment operator\ cashier etc.). This paper is structured as follows: section 2 presents the description of the queuing system model with feed- back patients flow in OD. Medical treatment processes flowchart, mathematical formulations by analyzing steady states and the mathematical method to obtain per- formance indicators are introduced in this section. In section 3 a mathematical programming model is devel- oped to determine how many nurses are allocated to each stage/division to minimize the total costs of patients waiting time and the nurse idle time. A neighborhood search combined Simulated Annealing (NS-SA) algorithm is developed. Section 4 presents numeric analysis of ex- periment results and Section 5 concludes the paper and provides the research direction in future. 2. Queuing System in OD When a patient enters into an outpatient department, he should go to the registration station first, and then see doctor. If there is no question in the result after the doc- tor’s diagnosis, he will take the medicine after paying. Otherwise, he needs to make a serial examination process, e.g. CT, blood testing, and returns to see doctor after having testing results. The treatment flow chart in OD from patient registration to leaving is described as shown in Figure 1. Without loss of generality, a general OD treatment process flowchart is simplified in Figure 2. The patients’ external arrival rate is a Poisson dis- tribution with parameter . All patients will be served sequentially with the rule FCFS (first come first service) before leaving the system. It is assumed there is an infi- nite buffer between any two stations and the system is steady-state. The network is a multi-stage queuing system with feedback patientsflow where the four stages are M/M/n queuing model with capacity of stageis Ni severs respectively. The patient arrival rate is a Poisson distribution with parameter i before stage i. The service rate in stage i is independent and aexponential distribution with parameter ui. The service time in exami- nation stage is a general distribution with parameter u5. The input patients flow is 5 and the output patients’ flow (re-enter station 2) is 6 . Figure 1. OD medical treatment process flow chart. Figure 2. Simplified OD queuing system. Copyright © 2013 SciRes. IB 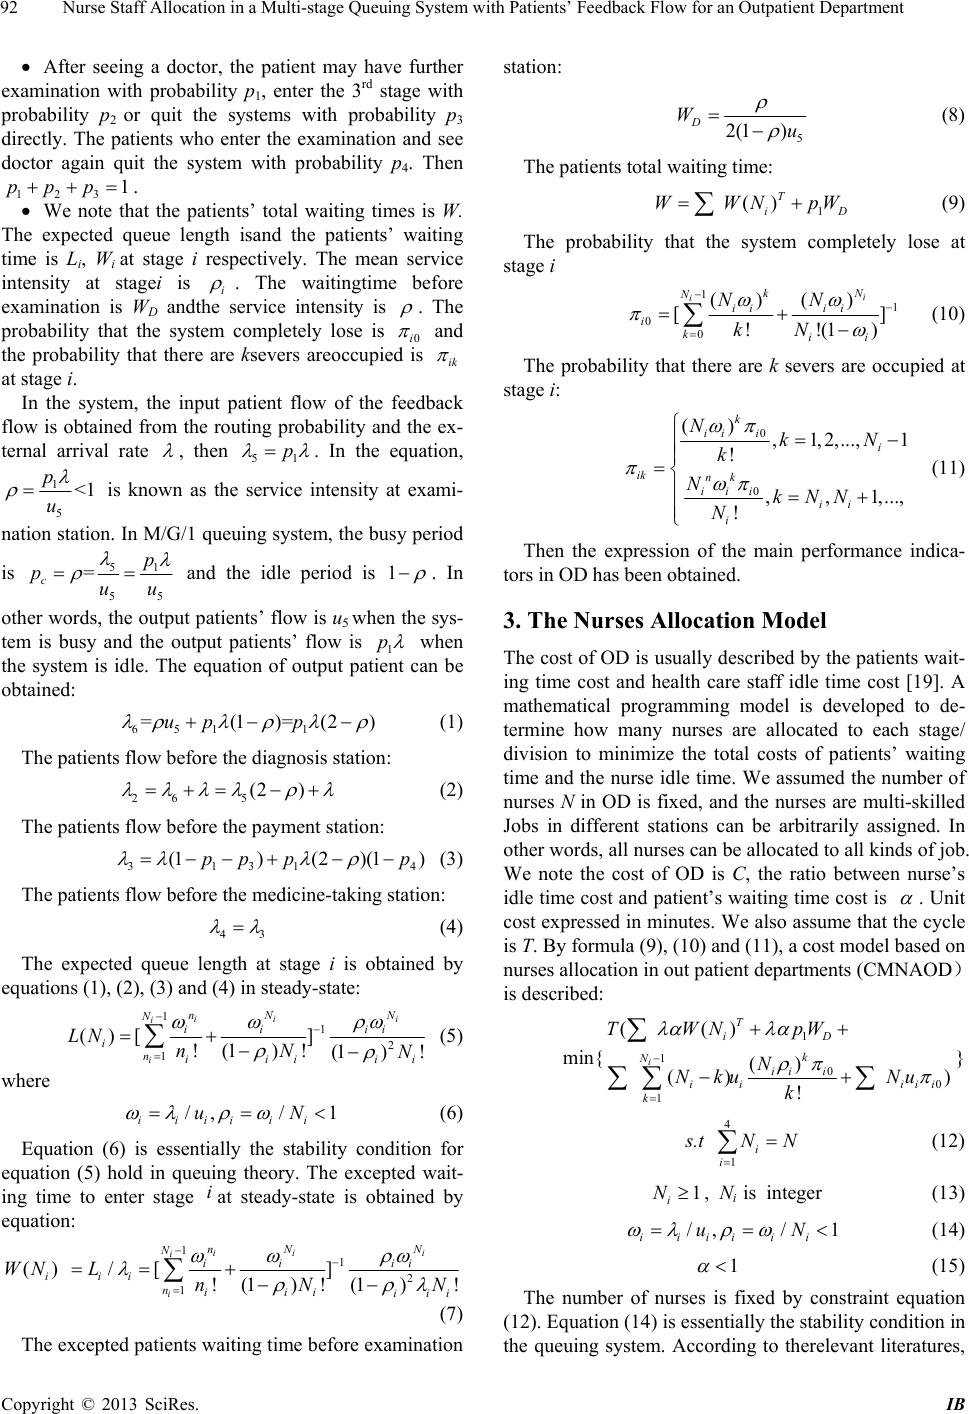 Nurse Staff Allocation in a Multi-stage Queuing System with Patients’ Feedback Flow for an Outpatient Department 92 After seeing a doctor, the patient may have further examination with probability p1, enter the 3rd stage with probability p2 or quit the systems with probability p3 directly. The patients who enter the examination and see doctor again quit the system with probability p4. Then 1. 123 We note that the patients’ total waiting times is W. The expected queue length isand the patients’ waiting time is Li, Wi at stage i respectively. The mean service intensity at stagei is i ppp . The waitingtime before examination is WD andthe service intensity is . The probability that the system completely lose is 0i and the probability that there are ksevers areoccupied is ik at stage i. In the system, the input patient flow of the feedback flow is obtained from the routing probability and the ex- ternal arrival rate , then 51 p . In the equation, 1 5 <1 p u is known as the service intensity at exami- nation station. In M/G/1 queuing system, the busy period is 51 55 = c p puu and the idle period is 1 . In other words, the output patients’ flow is u5 when the sys- tem is busy and the output patients’ flow is 1 p when the system is idle. The equation of output patient can be obtained: 651 1 =(1)=(2upp ) (1) The patients flow before the diagnosis station: 26 5 (2 ) (2) The patients flow before the payment station: 3131 (1)(2 )(1)pp pp 4 (3) The patients flow before the medicine-taking station: 43 (4) The expected queue length at stage i is obtained by equations (1), (2), (3) and (4) in steady-state: 1 1 2 1 ()[ ] !(1 )!(1) ! ii i i i nN N Nii ii iniiiii LN nN N (5) where /,/ 1 iiiiii uN (6) Equation (6) is essentially the stability condition for equation (5) hold in queuing theory. The excepted wait- ing time to enter stage at steady-state is obtained by equation: i 1 1 2 1 ()/ [] !(1 )!(1 )! ii i i i nN N Nii ii iii niiiiii WN LnN N (7) The excepted patients waiting time before examination station: 5 2(1 ) D Wu (8) The patients total waiting time: 1 () T i WWNpW D (9) The probability that the system completely lose at stage i 1 1 0 0 ()() [] !!(1) i iN k Nii ii ikii NN kN (10) The probability that there are k severs are occupied at stage i: 0 0 (),1, 2,...,1 ! ,, 1,..., ! k ii ii ik nk iii ii i NkN k NkNN N (11) Then the expression of the main performance indica- tors in OD has been obtained. 3. The Nurses Allocation Model The cost of OD is usually described by the patients wait- ing time cost and health care staff idle time cost [19]. A mathematical programming model is developed to de- termine how many nurses are allocated to each stage/ division to minimize the total costs of patients’ waiting time and the nurse idle time. We assumed the number of nurses N in OD is fixed, and the nurses are multi-skilled Jobs in different stations can be arbitrarily assigned. In other words, all nurses can be allocated to all kinds of job. We note the cost of OD is C, the ratio between nurse’s idle time cost and patient’s waiting time cost is . Unit cost expressed in minutes. We also assume that the cycle is T. By formula (9), (10) and (11), a cost model based on nurses allocation in out patient departments (CMNAOD) is described: min{ 1 1 0 0 1 (() () () ! i T iD k Nii i ii iii k TWN pW N Nku Nu k ) } s.t (12) 4 1 i i NN 1 i N, Ni is integer (13) /,/ 1 iiii ii uN (14) 1 (15) The number of nurses is fixed by constraint equation (12). Equation (14) is essentially the stability condition in the queuing system. According to therelevant literatures, Copyright © 2013 SciRes. IB 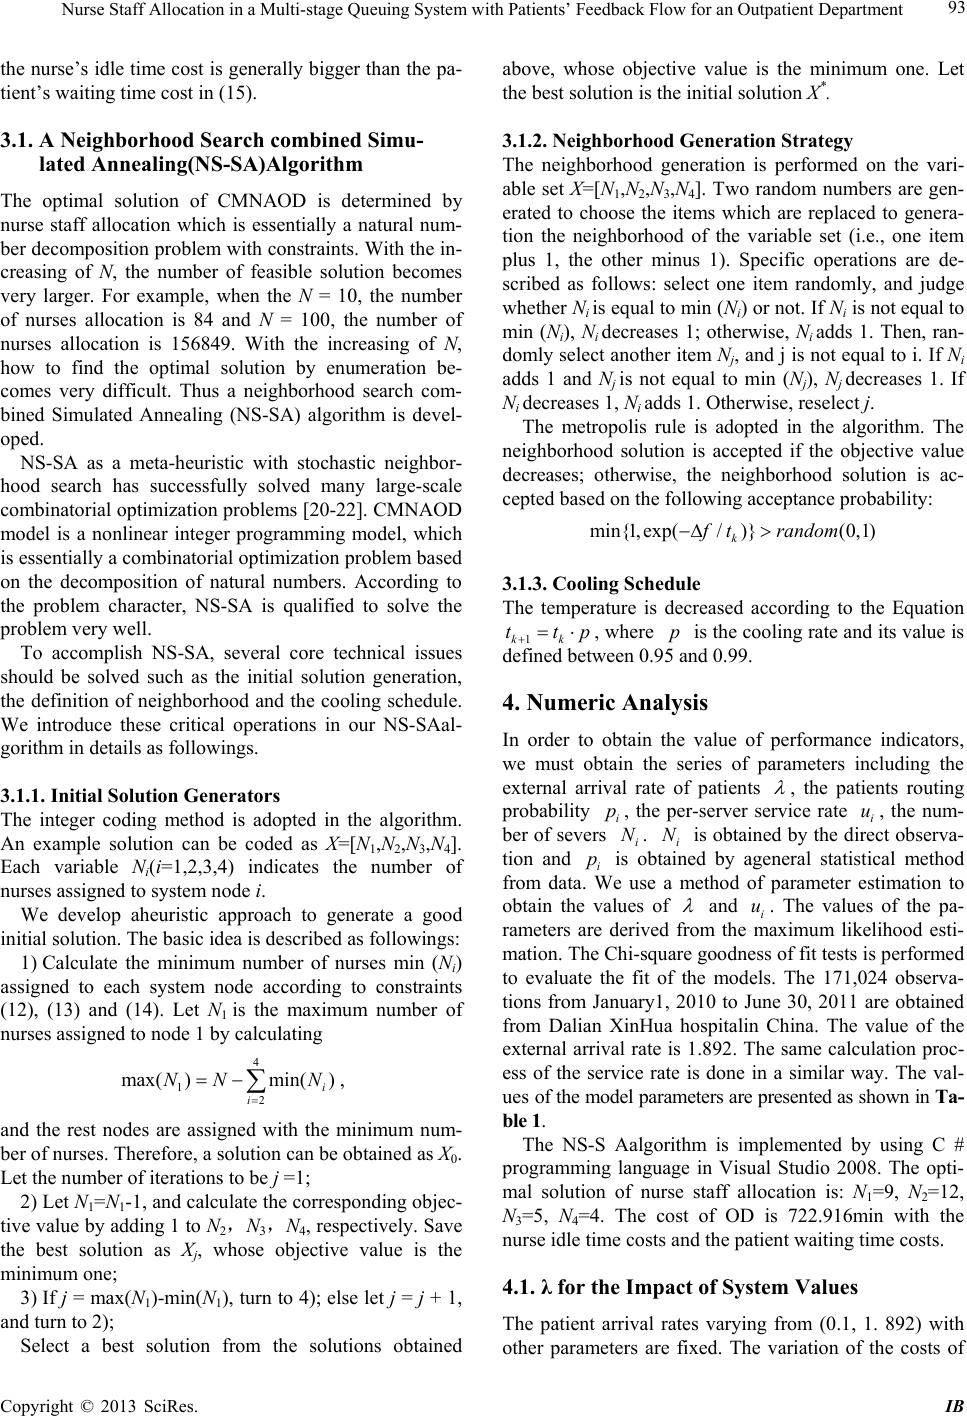 Nurse Staff Allocation in a Multi-stage Queuing System with Patients’ Feedback Flow for an Outpatient Department 93 the nurse’s idle time cost is generally bigger than the pa- tient’s waiting time cost in (15). 3.1. A Neighborhood Search combined Simu- lated Annealing(NS-SA)Algorithm The optimal solution of CMNAOD is determined by nurse staff allocation which is essentially a natural num- ber decomposition problem with constraints. With the in- creasing of N, the number of feasible solution becomes very larger. For example, when the N = 10, the number of nurses allocation is 84 and N = 100, the number of nurses allocation is 156849. With the increasing of N, how to find the optimal solution by enumeration be- comes very difficult. Thus a neighborhood search com- bined Simulated Annealing (NS-SA) algorithm is devel- oped. NS-SA as a meta-heuristic with stochastic neighbor- hood search has successfully solved many large-scale combinatorial optimization problems [20-22]. CMNAOD model is a nonlinear integer programming model, which is essentially a combinatorial optimization problem based on the decomposition of natural numbers. According to the problem character, NS-SA is qualified to solve the problem very well. To accomplish NS-SA, several core technical issues should be solved such as the initial solution generation, the definition of neighborhood and the cooling schedule. We introduce these critical operations in our NS-SAal- gorithm in details as followings. 3.1.1. Initial Solution Generators The integer coding method is adopted in the algorithm. An example solution can be coded as X=[N1,N2,N3,N4]. Each variable Ni(i=1,2,3,4) indicates the number of nurses assigned to system node i. We develop aheuristic approach to generate a good initial solution. The basic idea is described as followings: 1) Calculate the minimum number of nurses min (Ni) assigned to each system node according to constraints (12), (13) and (14). Let N1 is the maximum number of nurses assigned to node 1 by calculating 4 1 2 max( )min( ) i i NN N , and the rest nodes are assigned with the minimum num- ber of nurses. Therefore, a solution can be obtained as X0. Let the number of iterations to be j =1; 2) Let N1=N1-1, and calculate the corresponding objec- tive value by adding 1 to N2,N3,N4, respectively. Save the best solution as Xj, whose objective value is the minimum one; 3) If j = max(N1)-min(N1), turn to 4); else let j = j + 1, and turn to 2); Select a best solution from the solutions obtained above, whose objective value is the minimum one. Let the best solution is the initial solution X*. 3.1.2. Neighborhood Generation Strategy The neighborhood generation is performed on the vari- able set X=[N1,N2,N3,N4]. Two random numbers are gen- erated to choose the items which are replaced to genera- tion the neighborhood of the variable set (i.e., one item plus 1, the other minus 1). Specific operations are de- scribed as follows: select one item randomly, and judge whether Ni is equal to min (Ni) or not. If Ni is not equal to min (Ni), Ni decreases 1; otherwise, Ni adds 1. Then, ran- domly select another item Nj, and j is not equal to i. If Ni adds 1 and Nj is not equal to min (Nj), Nj decreases 1. If Ni decreases 1, Ni adds 1. Otherwise, reselect j. The metropolis rule is adopted in the algorithm. The neighborhood solution is accepted if the objective value decreases; otherwise, the neighborhood solution is ac- cepted based on the following acceptance probability: min{1, exp(/)}(0,1) k f trandom 3.1.3. Cooling Schedule The temperature is decreased according to the Equation 1kk tt p , where is the cooling rate and its value is defined between 0.95 and 0.99. p 4. Numeric Analysis In order to obtain the value of performance indicators, we must obtain the series of parameters including the external arrival rate of patients , the patients routing probability , the per-server service rate i, the num- ber of severs i. i is obtained by the direct observa- tion and i is obtained by ageneral statistical method from data. We use a method of parameter estimation to obtain the values of i pNu N p and i u. The values of the pa- rameters are derived from the maximum likelihood esti- mation. The Chi-square goodness of fit tests is performed to evaluate the fit of the models. The 171,024 observa- tions from January1, 2010 to June 30, 2011 are obtained from Dalian XinHua hospitalin China. The value of the external arrival rate is 1.892. The same calculation proc- ess of the service rate is done in a similar way. The val- ues of the model parameters are presented as shown in Ta - ble 1. The NS-S Aalgorithm is implemented by using C # programming language in Visual Studio 2008. The opti- mal solution of nurse staff allocation is: N1=9, N2=12, N3=5, N4=4. The cost of OD is 722.916min with the nurse idle time costs and the patient waiting time costs. 4.1. λ for the Impact of System Values The patient arrival rates varying from (0.1, 1. 892) with other parameters are fixed. The variation of the costs of Copyright © 2013 SciRes. IB 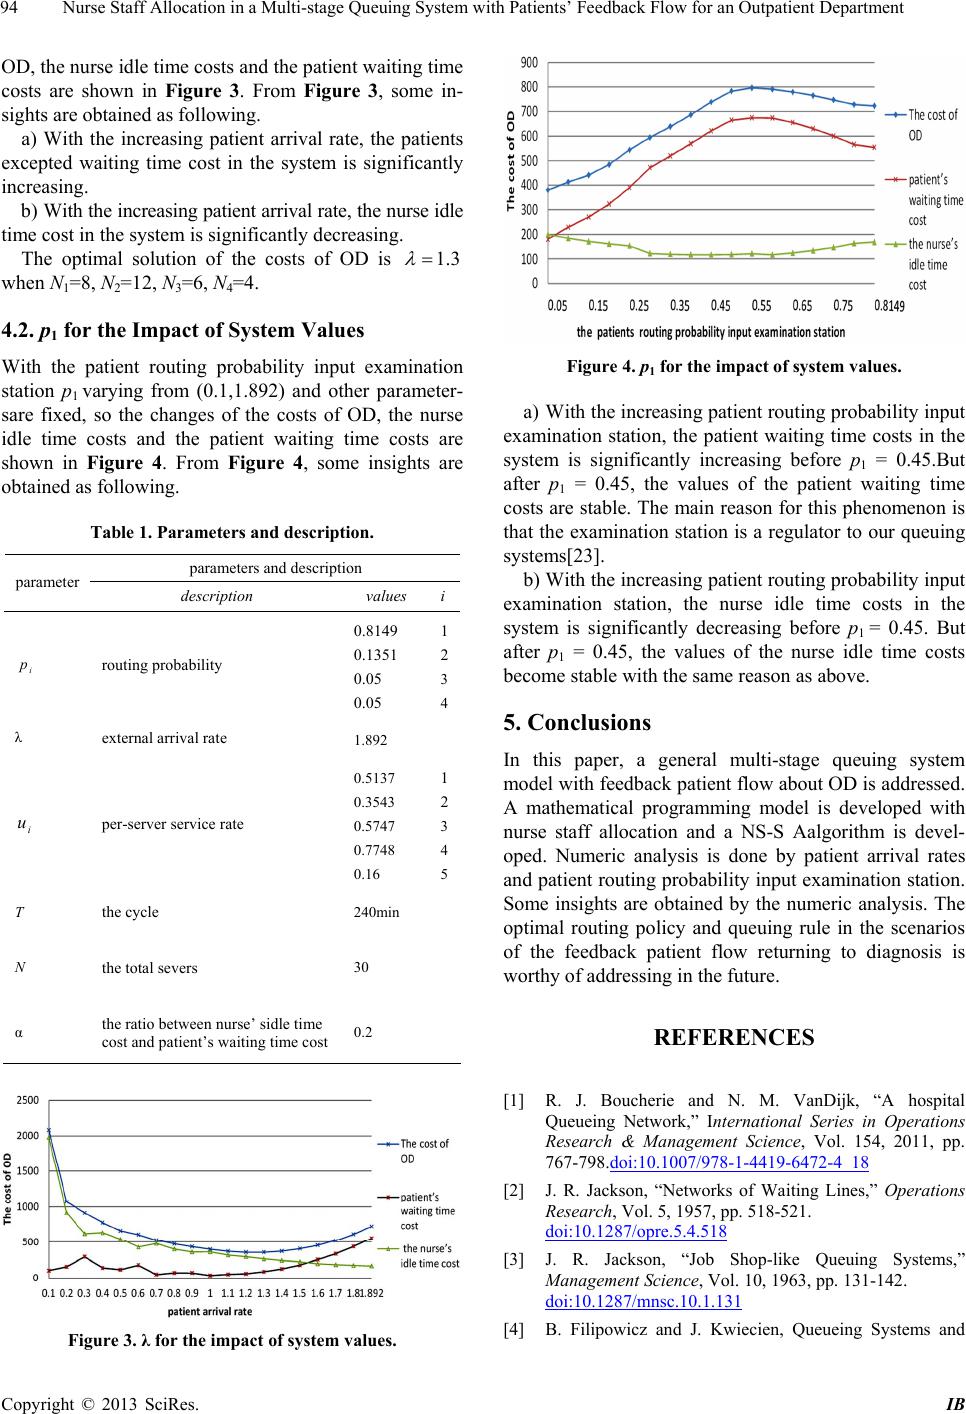 Nurse Staff Allocation in a Multi-stage Queuing System with Patients’ Feedback Flow for an Outpatient Department 94 OD, the nurse idle time costs and the patient waiting time costs are shown in Figure 3. From Figure 3, some in- sights are obtained as following. a) With the increasing patient arrival rate, the patients excepted waiting time cost in the system is significantly increasing. b) With the increasing patient arrival rate, the nurse idle time cost in the system is significantly decreasing. The optimal solution of the costs of OD is 1.3 when N1=8, N2=12, N3=6, N4=4. 4.2. p1 for the Impact of System Values With the patient routing probability input examination station p1 varying from (0.1,1.892) and other parameter- sare fixed, so the changes of the costs of OD, the nurse idle time costs and the patient waiting time costs are shown in Figure 4. From Figure 4, some insights are obtained as following. Table 1. Parameters and description. parameters and description parameter description values i i p routing probability 0.8149 0.1351 0.05 0.05 1 2 3 4 λ external arrival rate 1.892 i u per-server service rate 0.5137 0.3543 0.5747 0.7748 0.16 1 2 3 4 5 T the cycle 240min N the total severs 30 α the ratio between nurse’ sidle time cost and patient’s waiting time cost 0.2 Figure 3. λ for the impact of system values. Figure 4. p1 for the impact of system values. a) With the increasing patient routing probability input examination station, the patient waiting time costs in the system is significantly increasing before p1 = 0.45.But after p1 = 0.45, the values of the patient waiting time costs are stable. The main reason for this phenomenon is that the examination station is a regulator to our queuing systems[23]. b) With the increasing patient routing probability input examination station, the nurse idle time costs in the system is significantly decreasing before p1 = 0.45. But after p1 = 0.45, the values of the nurse idle time costs become stable with the same reason as above. 5. Conclusions In this paper, a general multi-stage queuing system model with feedback patient flow about OD is addressed. A mathematical programming model is developed with nurse staff allocation and a NS-S Aalgorithm is devel- oped. Numeric analysis is done by patient arrival rates and patient routing probability input examination station. Some insights are obtained by the numeric analysis. The optimal routing policy and queuing rule in the scenarios of the feedback patient flow returning to diagnosis is worthy of addressing in the future. REFERENCES [1] R. J. Boucherie and N. M. VanDijk, “A hospital Queueing Network,” International Series in Operations Research & Management Science, Vol. 154, 2011, pp. 767-798.doi:10.1007/978-1-4419-6472-4_18 [2] J. R. Jackson, “Networks of Waiting Lines,” Operations Research, Vol. 5, 1957, pp. 518-521. doi:10.1287/opre.5.4.518 [3] J. R. Jackson, “Job Shop-like Queuing Systems,” Management Science, Vol. 10, 1963, pp. 131-142. doi:10.1287/mnsc.10.1.131 [4] B. Filipowicz and J. Kwiecien, Queueing Systems and Copyright © 2013 SciRes. IB 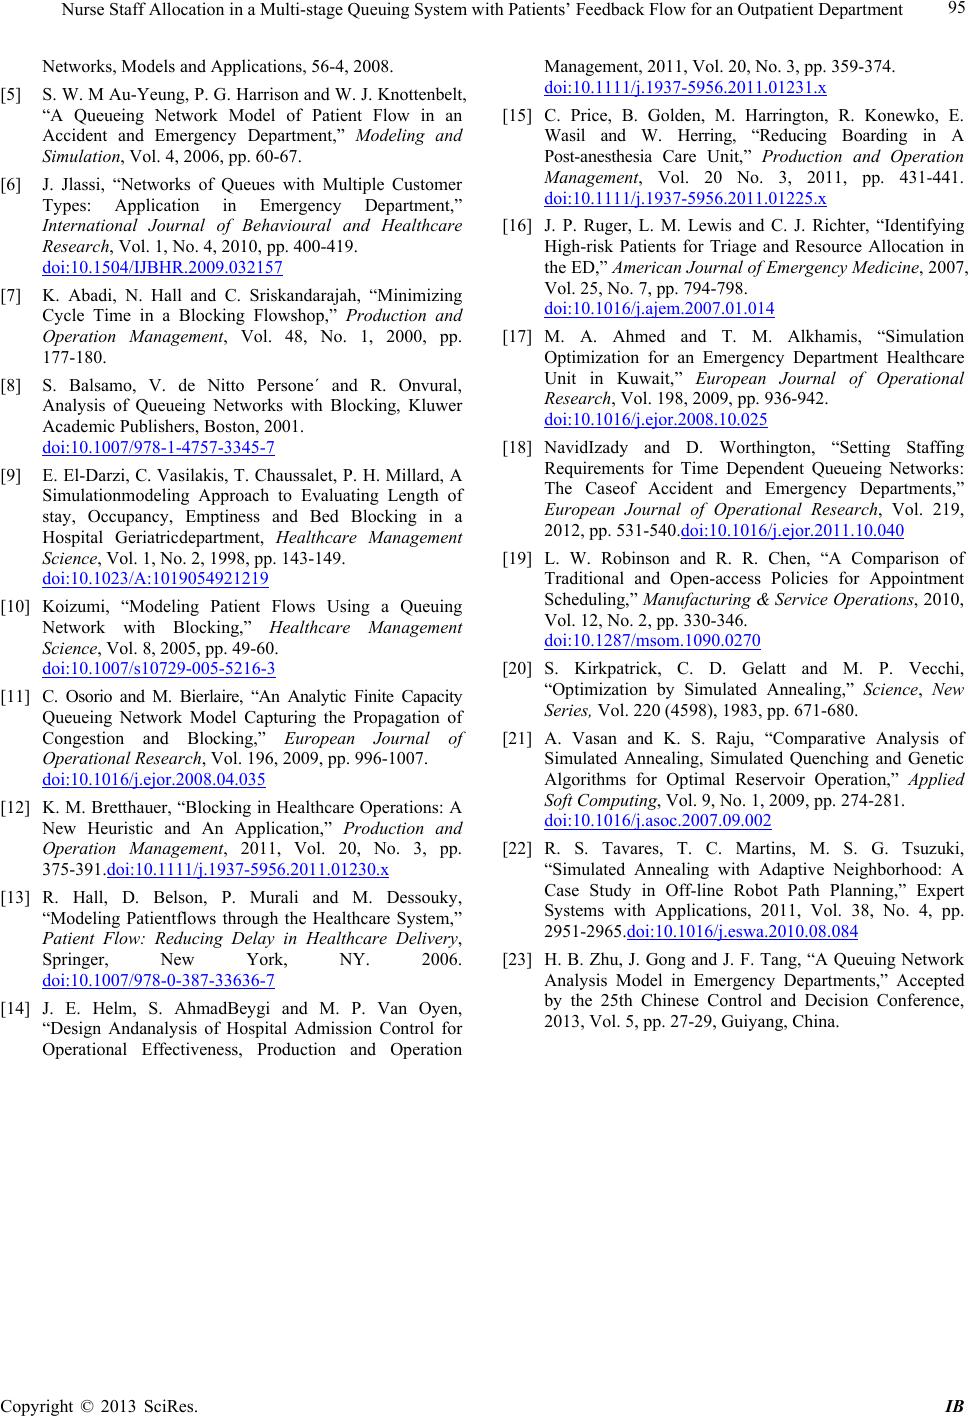 Nurse Staff Allocation in a Multi-stage Queuing System with Patients’ Feedback Flow for an Outpatient Department Copyright © 2013 SciRes. IB 95 Networks, Models and Applications, 56-4, 2008. [5] S. W. M Au-Yeung, P. G. Harrison and W. J. Knottenbelt, “A Queueing Network Model of Patient Flow in an Accident and Emergency Department,” Modeling and Simulation, Vol. 4, 2006, pp. 60-67. [6] J. Jlassi, “Networks of Queues with Multiple Customer Types: Application in Emergency Department,” International Journal of Behavioural and Healthcare Research, Vol. 1, No. 4, 2010, pp. 400-419. doi:10.1504/IJBHR.2009.032157 [7] K. Abadi, N. Hall and C. Sriskandarajah, “Minimizing Cycle Time in a Blocking Flowshop,” Production and Operation Management, Vol. 48, No. 1, 2000, pp. 177-180. [8] S. Balsamo, V. de Nitto Persone´ and R. Onvural, Analysis of Queueing Networks with Blocking, Kluwer Academic Publishers, Boston, 2001. doi:10.1007/978-1-4757-3345-7 [9] E. El-Darzi, C. Vasilakis, T. Chaussalet, P. H. Millard, A Simulationmodeling Approach to Evaluating Length of stay, Occupancy, Emptiness and Bed Blocking in a Hospital Geriatricdepartment, Healthcare Management Science, Vol. 1, No. 2, 1998, pp. 143-149. doi:10.1023/A:1019054921219 [10] Koizumi, “Modeling Patient Flows Using a Queuing Network with Blocking,” Healthcare Management Science, Vol. 8, 2005, pp. 49-60. doi:10.1007/s10729-005-5216-3 [11] C. Osorio and M. Bierlaire, “An Analytic Finite Capacity Queueing Network Model Capturing the Propagation of Congestion and Blocking,” European Journal of Operational Research, Vol. 196, 2009, pp. 996-1007. doi:10.1016/j.ejor.2008.04.035 [12] K. M. Bretthauer, “Blocking in Healthcare Operations: A New Heuristic and An Application,” Production and Operation Management, 2011, Vol. 20, No. 3, pp. 375-391.doi:10.1111/j.1937-5956.2011.01230.x [13] R. Hall, D. Belson, P. Murali and M. Dessouky, “Modeling Patientflows through the Healthcare System,” Patient Flow: Reducing Delay in Healthcare Delivery, Springer, New York, NY. 2006. doi:10.1007/978-0-387-33636-7 [14] J. E. Helm, S. AhmadBeygi and M. P. Van Oyen, “Design Andanalysis of Hospital Admission Control for Operational Effectiveness, Production and Operation Management, 2011, Vol. 20, No. 3, pp. 359-374. doi:10.1111/j.1937-5956.2011.01231.x [15] C. Price, B. Golden, M. Harrington, R. Konewko, E. Wasil and W. Herring, “Reducing Boarding in A Post-anesthesia Care Unit,” Production and Operation Management, Vol. 20 No. 3, 2011, pp. 431-441. doi:10.1111/j.1937-5956.2011.01225.x [16] J. P. Ruger, L. M. Lewis and C. J. Richter, “Identifying High-risk Patients for Triage and Resource Allocation in the ED,” American Journal of Emergency Medicine, 2007, Vol. 25, No. 7, pp. 794-798. doi:10.1016/j.ajem.2007.01.014 [17] M. A. Ahmed and T. M. Alkhamis, “Simulation Optimization for an Emergency Department Healthcare Unit in Kuwait,” European Journal of Operational Research, Vol. 198, 2009, pp. 936-942. doi:10.1016/j.ejor.2008.10.025 [18] NavidIzady and D. Worthington, “Setting Staffing Requirements for Time Dependent Queueing Networks: The Caseof Accident and Emergency Departments,” European Journal of Operational Research, Vol. 219, 2012, pp. 531-540.doi:10.1016/j.ejor.2011.10.040 [19] L. W. Robinson and R. R. Chen, “A Comparison of Traditional and Open-access Policies for Appointment Scheduling,” Manufacturing & Service Operations, 2010, Vol. 12, No. 2, pp. 330-346. doi:10.1287/msom.1090.0270 [20] S. Kirkpatrick, C. D. Gelatt and M. P. Vecchi, “Optimization by Simulated Annealing,” Science, New Series, Vol. 220 (4598), 1983, pp. 671-680. [21] A. Vasan and K. S. Raju, “Comparative Analysis of Simulated Annealing, Simulated Quenching and Genetic Algorithms for Optimal Reservoir Operation,” Applied Soft Computing, Vol. 9, No. 1, 2009, pp. 274-281. doi:10.1016/j.asoc.2007.09.002 [22] R. S. Tavares, T. C. Martins, M. S. G. Tsuzuki, “Simulated Annealing with Adaptive Neighborhood: A Case Study in Off-line Robot Path Planning,” Expert Systems with Applications, 2011, Vol. 38, No. 4, pp. 2951-2965.doi:10.1016/j.eswa.2010.08.084 [23] H. B. Zhu, J. Gong and J. F. Tang, “A Queuing Network Analysis Model in Emergency Departments,” Accepted by the 25th Chinese Control and Decision Conference, 2013, Vol. 5, pp. 27-29, Guiyang, China. |