

Paper Menu >>
Journal Menu >>
 Pharmacology & Pharmacy, 2013, 4, 567-572 Published Online November 2013 (http://www.scirp.org/journal/pp) http://dx.doi.org/10.4236/pp.2013.48081 Open Access PP 567 Quality Assessment of Artemether/Lumefantrine Tablets Sampled from Pharmacies in Accra, Using the MVHimagePCv8.exe Color Software Ebenezer Adu Nyarko, Henry Nettey Department of Pharmaceutics and Microbiology, School of Pharmacy, College of Health Sciences, University of Ghana, Legon, Ghana. Email: [email protected] Received August 21st, 2013; revised September 25th, 2013; accepted October 5th, 2013 Copyright © 2013 Ebenezer Adu Nyarko, Henry Nettey. This is an open access article distributed under the Creative Commons At- tribution License, which permits unrestricted use, distribution, and reproduction in any medium, provided the original work is prop- erly cited. ABSTRACT Background: Widespread resistance has been recorded with the use of mono-therapy in the management of malaria. In 2000, Ghana initiated the process of using Artemisinin-based combination therapy (ACT) following the World Health Organization’s (WHO) recommendation. Globally and in Ghana, there stands a high risk of development of resistance to the ACTs due to the act of counterfeiting or substandard drugs. In 2009, there was a report that fake Coartem, an ACT had been found in Ghana by the Drug Quality and Information (DQI) Program; this is a serious national problem that needs redress thus the need to conduct this study to check if there are any substandard or counterfeit Artemether/ Lumefantrine tablets on the Ghanaian market. Method: Using Representative sampling method, a total of nine different brands or samples of artemether/lumefantrine tablets were sampled from nine different Pharmacies in Accra. The sam- ples were analyzed using a validated MVHimagePCv8.exe colour software technology. Results: The International Con- ference on Harmonization (ICH) and United States Pharmacopoeia (USP) recommend that for assay of tablets, the per- centage concentration should fall within 80% - 120%. After the analysis, seven out of the nine samples passed the test to varying degrees. Two samples (AL-S4 and AL-S6) however failed the test with AL-S4 recording artemether concen- tration (126.07%) above and Lumefantrine concentration (78.38%) below the recommended figure while AL-S6’s 51.53% failed to meet the minimum allowable concentration for lumefantrine in a tablet. Conclusion: The results pre- sented show that some Artemether/Lumefantrine tablets on the Ghanaian market still have issues with regards to quality or level of active ingredients. There would therefore be the need for further studies to be conducted into these products especially those that failed the test. Keywords: Artemisinin-Based Combination Therapy; Resistance; Counterfeit or Substandard Drugs 1. Introduction Malaria is a potentially fatal blood-borne disease caused by a eukaryotic protoctist of the genus Plasmodium, a parasite that is transmitted to human and animal hosts by the female Anopheles mosquito. There are four main species of the parasite (P. falci- parum, vivax, ovale, and malariae) that are known to affect man [1]. Malaria caused by P. falciparum is the most deadly and prevalent (90% - 98%). It is the most common in Africa, south of the Sahara, accounting in large part for the extremely high mortality in this region [2]. In Ghana, malaria has been reported to account for about 33.45% of all outpatient attendances and 30.3% of all hospital admissions [2]. Management of the disease in Ghana and other parts of the continent has moved from single drug therapies like chloroquine to the new artemisinin based combination therapy (ACT) due to the issue of resistance to mono- therapy. Fixed-combination and multiple-drug therapies are used to exploit the synergistic and additive potential of individual drugs. The aim is to improve efficacy and to retard the development of resistance to the individual components of the combination. In Africa, countries which are currently deploying  Quality Assessment of Artemether/Lumefantrine Tablets Sampled from Pharmacies in Accra, Using the MVHimagePCv8.exe Color Software 568 ACTs in the general health services include: Burundi, Comoros, Ethiopia, Ghana, Liberia, Mozambique, Sao Tome and Principe, Sierra Leone, South Africa, Sudan, Zambia and Zanzibar. The first and second lines of treat- ment are artesunate/Amodiaquine, Artemether/Lumefan- trine and rarely artesunate/sulfadoxine-pyrimethamine depending on the cost and the country in question [3]. In Ghana, the first line of treatment is Artesunate/Amodia- quine (AA) but due to widely reported cases of unbear- able side effects, most prescribers and patients as such are now opting for the relatively expensive Artemether/ Lumefantrine (AL). In view of this, the Ghanaian market is dominated by this product (AL) with many generics available [4]. In Ghana and other parts of Africa, there stands a high risk of development of resistance to the ACTs due to the act of non-compliance, counterfeiting or substandard drugs. The global nature of counterfeiting has since 1982 been documented by the World Health Organization [5]. For example, study on the quality of antimalarial drugs sup- plied by Nigerian pharmacies was conducted using vali- dated HPLC methods against British Pharmacopoeia (BP) specifications. Overall 48% (279/581) of drugs analyzed failed to comply with BP specifications [6]. In 2009, there was a report that fake Coartem had been found in Ghana by the Drug Quality and Information (DQI) Program. These reports and many others pose serious health threats to the nation and therefore need the attention and vigilance of every individual. This study was therefore aimed at assessing the quality of the various brands of Artemether/lumefantrine prod- ucts available at Pharmacies in Accra using very simple analytical tools easily accessible to all. In a quest to de- termine the possible presence of counterfeit or substan- dard products on the Ghanaian market, the simplicity of the method can be adopted by all pharmacies or indi- viduals and used as a first-line screening method to weed out poor quality drugs. 2. Materials and Methods There are many experimental methods available in lit- erature for the assay of artemether/lumefantrine tablets. High Performance Liquid Chromatography (HPLC) ana- lysis has been widely used in such analysis due to its sen- sitivity, accuracy and precision. However for rapid ana- lysis of such tablets, simple, effective, and validated me- thods like the one used in this work can be employed. Sampling: A representative sampling procedure was employed. In this technique, a list of all the samples known randomly to be still available on the Ghanaian market was made. Representative samples of each ge- neric/brand were obtained from different pharmacies within Accra. In all, a total of nine different samples of artemether/lumefantrine products were obtained from nine different pharmacies in Accra. 3. Assay Preparation of artemether standard: Exactly 60 mg of pure artemether and 360 mg of pure lumefantrine (Table 1) were weighed, put together and thoroughly mixed. A quantity of the mixture containing 24 mg of artemether was weighed and dissolved in 2 ml of methanol to make a 12 mg/ml solution. Portions of this solution were taken and serially diluted to obtain 10 mg/ml and 8 mg/ml stan- dard artemether solutions. The colorimetric method of drug analysis was validated by Green et al. [7]. Preparation of samples for assay of artemether: Six (6) tablets of each artemether/lumefantrine sample were weighed and the average weight determined. The tablets were crushed with a pestle in a mortar into powder. An amount of the powder containing 20 mg of artemether was weighed into each of 3 separate test tubes and la- beled A1, A2, and A3. Exactly 2 ml of methanol was added to each test tube to make a 10 mg/ml concentra- tion. Assay of artemether content in samples: Exactly 0.2 ml of each of the samples labeled A1, A2 and A3 was pipet- ted into 3 separate wells of a 48-well plate taking note of the sample placed in each well. Then 0.2 ml triplicates of each concentration of the standards prepared were also placed in their respective wells. 0.2 ml of 85% O-phos- phoric acid was added to the samples and standards in the wells and shaken gently and carefully on the bench to ensure complete mixing. The mixture was allowed to stand on the bench for 4 - 5 hours. The measurement of color intensity through image analysis was performed as outlined by Green et al. [8]. Briefly, the 48-well plate was placed on a battery-oper- ated light box (Visual Plus SV-650, Taiwan). A plastic hood with apertures in the upper and lower ends was placed over the light box. A digital camera was placed over the upper orifice of the hood and set for “macro” and “no flash”. This setup gave a consistent background illumination for each plate analyzed. The picture re- corded was transferred to a computer for digital image analysis using MVHimagePCv8.exe color software. The picture was then analyzed with the red vs. blue pixels Table 1. Properties of drug standards. Standard Batch number Man. date Exp. date Percentage purity (%) Artemether 20111125 Nov. 2011 Nov. 2014 95.3 Lumefantrine L20100804Aug. 2010 Aug. 2013 98.6 Open Access PP 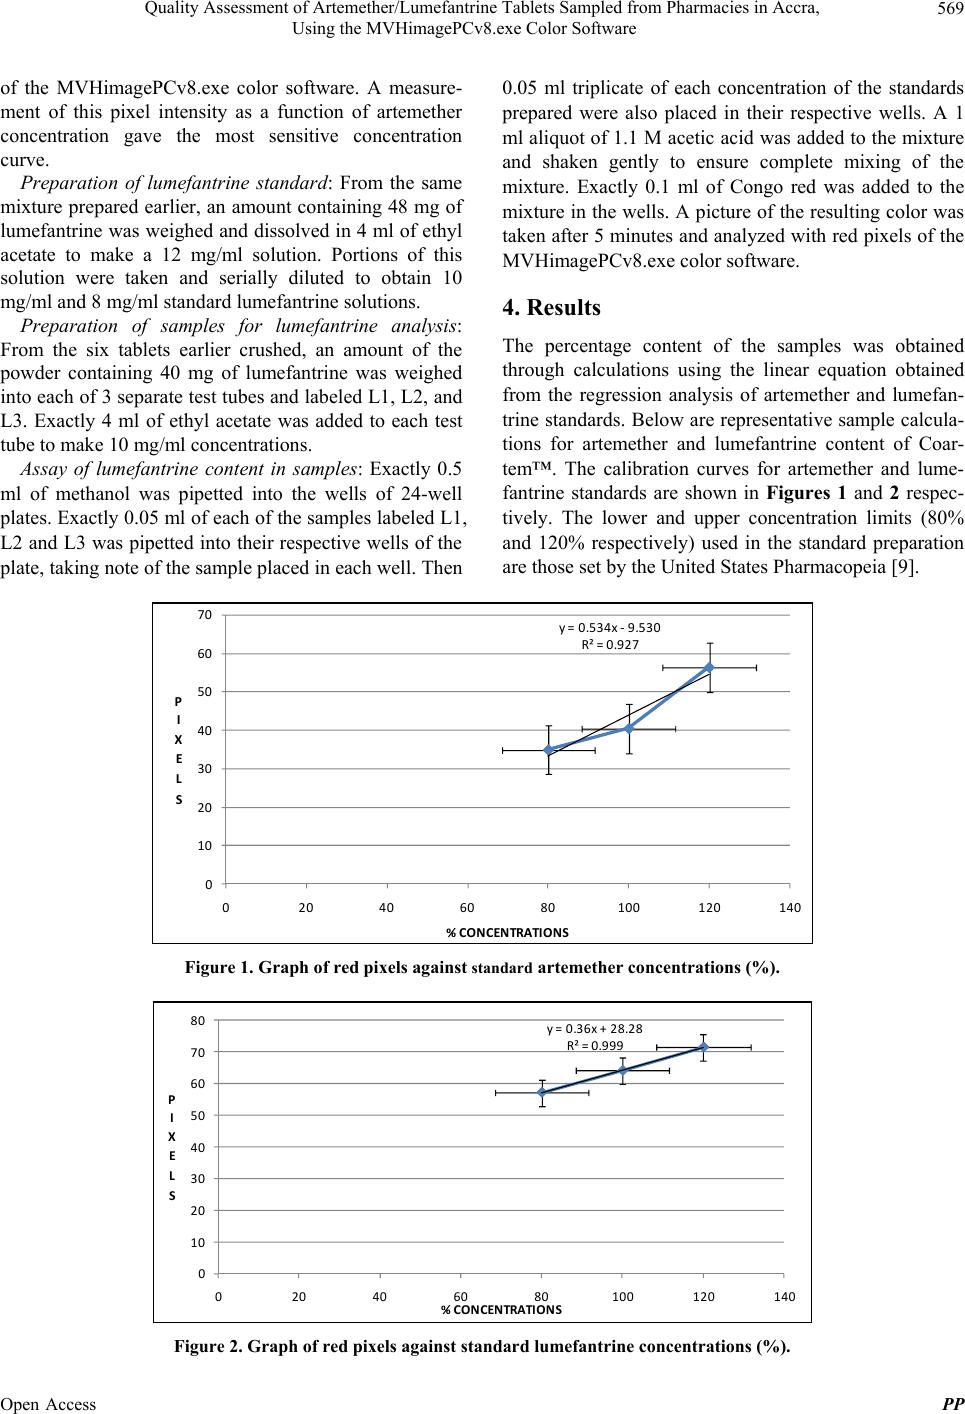 Quality Assessment of Artemether/Lumefantrine Tablets Sampled from Pharmacies in Accra, Using the MVHimagePCv8.exe Color Software Open Access PP 569 of the MVHimagePCv8.exe color software. A measure- ment of this pixel intensity as a function of artemether concentration gave the most sensitive concentration curve. 0.05 ml triplicate of each concentration of the standards prepared were also placed in their respective wells. A 1 ml aliquot of 1.1 M acetic acid was added to the mixture and shaken gently to ensure complete mixing of the mixture. Exactly 0.1 ml of Congo red was added to the mixture in the wells. A picture of the resulting color was taken after 5 minutes and analyzed with red pixels of the MVHimagePCv8.exe color software. Preparation of lumefantrine standard: From the same mixture prepared earlier, an amount containing 48 mg of lumefantrine was weighed and dissolved in 4 ml of ethyl acetate to make a 12 mg/ml solution. Portions of this solution were taken and serially diluted to obtain 10 mg/ml and 8 mg/ml standard lumefantrine solutions. 4. Results Preparation of samples for lumefantrine analysis: From the six tablets earlier crushed, an amount of the powder containing 40 mg of lumefantrine was weighed into each of 3 separate test tubes and labeled L1, L2, and L3. Exactly 4 ml of ethyl acetate was added to each test tube to make 10 mg/ml concentrations. The percentage content of the samples was obtained through calculations using the linear equation obtained from the regression analysis of artemether and lumefan- trine standards. Below are representative sample calcula- tions for artemether and lumefantrine content of Coar- tem™. The calibration curves for artemether and lume- fantrine standards are shown in Figures 1 and 2 respec- tively. The lower and upper concentration limits (80% and 120% respectively) used in the standard preparation are those set by the United States Pharmacopeia [9]. Assay of lumefantrine content in samples: Exactly 0.5 ml of methanol was pipetted into the wells of 24-well plates. Exactly 0.05 ml of each of the samples labeled L1, L2 and L3 was pipetted into their respective wells of the plate, taking note of the sample placed in each well. Then y=0.534x‐ 9.530 R²=0.927 0 10 20 30 40 50 60 70 020406080100 120 140 P I X E L S %CONCENTRATIONS Figure 1. Graph of red pixels against standard artemether concentrations (%). y=0.36x+28.28 R²=0.999 0 10 20 30 40 50 60 70 80 020406080100 120 140 P I X E L S %CONCENTRATIONS Figure 2. Graph of red pixels against standard lumefantrine concentrations (%). 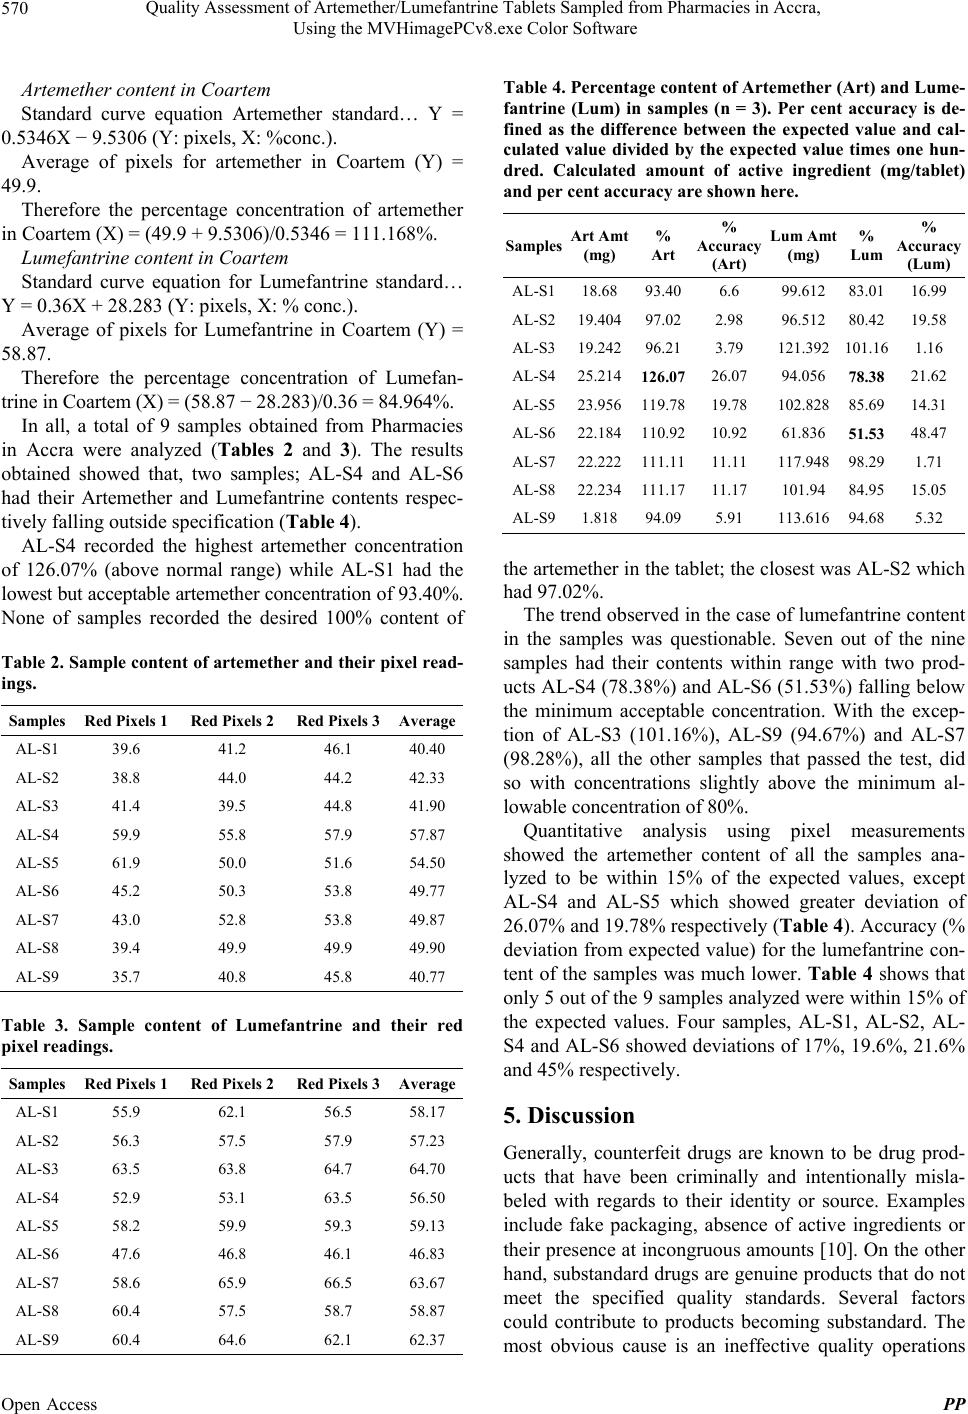 Quality Assessment of Artemether/Lumefantrine Tablets Sampled from Pharmacies in Accra, Using the MVHimagePCv8.exe Color Software 570 Artemether content in Coartem Standard curve equation Artemether standard… Y = 0.5346X − 9.5306 (Y: pixels, X: %conc.). Average of pixels for artemether in Coartem (Y) = 49.9. Therefore the percentage concentration of artemether in Coartem (X) = (49.9 + 9.5306)/0.5346 = 111.168%. Lumefantrine content in Coartem Standard curve equation for Lumefantrine standard… Y = 0.36X + 28.283 (Y: pixels, X: % conc.). Average of pixels for Lumefantrine in Coartem (Y) = 58.87. Therefore the percentage concentration of Lumefan- trine in Coartem (X) = (58.87 − 28.283)/0.36 = 84.964%. In all, a total of 9 samples obtained from Pharmacies in Accra were analyzed (Tables 2 and 3). The results obtained showed that, two samples; AL-S4 and AL-S6 had their Artemether and Lumefantrine contents respec- tively falling outside specification (Table 4). AL-S4 recorded the highest artemether concentration of 126.07% (above normal range) while AL-S1 had the lowest but acceptable artemether concentration of 93.40%. None of samples recorded the desired 100% content of Table 2. Sample content of artemether and their pixel read- ings. Samples Red Pixels 1 Red Pixels 2 Red Pixels 3Average AL-S1 39.6 41.2 46.1 40.40 AL-S2 38.8 44.0 44.2 42.33 AL-S3 41.4 39.5 44.8 41.90 AL-S4 59.9 55.8 57.9 57.87 AL-S5 61.9 50.0 51.6 54.50 AL-S6 45.2 50.3 53.8 49.77 AL-S7 43.0 52.8 53.8 49.87 AL-S8 39.4 49.9 49.9 49.90 AL-S9 35.7 40.8 45.8 40.77 Table 3. Sample content of Lumefantrine and their red pixel readings. Samples Red Pixels 1 Red Pixels 2 Red Pixels 3Average AL-S1 55.9 62.1 56.5 58.17 AL-S2 56.3 57.5 57.9 57.23 AL-S3 63.5 63.8 64.7 64.70 AL-S4 52.9 53.1 63.5 56.50 AL-S5 58.2 59.9 59.3 59.13 AL-S6 47.6 46.8 46.1 46.83 AL-S7 58.6 65.9 66.5 63.67 AL-S8 60.4 57.5 58.7 58.87 AL-S9 60.4 64.6 62.1 62.37 Table 4. Percentage content of Artemether (Art) and Lume- fantrine (Lum) in samples (n = 3). Per cent accuracy is de- fined as the difference between the expected value and cal- culated value divided by the expected value times one hun- dred. Calculated amount of active ingredient (mg/tablet) and per cent accuracy are shown here. Samples Art Amt (mg) % Art % Accuracy (Art) Lum Amt (mg) % Lum % Accuracy (Lum) AL-S118.68 93.406.6 99.612 83.0116.99 AL-S219.40497.022.98 96.512 80.4219.58 AL-S319.24296.213.79 121.392 101.161.16 AL-S425.214 126.07 26.07 94.056 78.38 21.62 AL-S523.956119.7819.78 102.828 85.6914.31 AL-S622.184110.9210.92 61.836 51.53 48.47 AL-S722.222111.1111.11 117.948 98.291.71 AL-S822.234111.1711.17 101.94 84.9515.05 AL-S91.818 94.095.91 113.616 94.685.32 the artemether in the tablet; the closest was AL-S2 which had 97.02%. The trend observed in the case of lumefantrine content in the samples was questionable. Seven out of the nine samples had their contents within range with two prod- ucts AL-S4 (78.38%) and AL-S6 (51.53%) falling below the minimum acceptable concentration. With the excep- tion of AL-S3 (101.16%), AL-S9 (94.67%) and AL-S7 (98.28%), all the other samples that passed the test, did so with concentrations slightly above the minimum al- lowable concentration of 80%. Quantitative analysis using pixel measurements showed the artemether content of all the samples ana- lyzed to be within 15% of the expected values, except AL-S4 and AL-S5 which showed greater deviation of 26.07% and 19.78% respectively (Table 4). Accuracy (% deviation from expected value) for the lumefantrine con- tent of the samples was much lower. Table 4 shows that only 5 out of the 9 samples analyzed were within 15% of the expected values. Four samples, AL-S1, AL-S2, AL- S4 and AL-S6 showed deviations of 17%, 19.6%, 21.6% and 45% respectively. 5. Discussion Generally, counterfeit drugs are known to be drug prod- ucts that have been criminally and intentionally misla- beled with regards to their identity or source. Examples include fake packaging, absence of active ingredients or their presence at incongruous amounts [10]. On the other hand, substandard drugs are genuine products that do not meet the specified quality standards. Several factors could contribute to products becoming substandard. The most obvious cause is an ineffective quality operations Open Access PP  Quality Assessment of Artemether/Lumefantrine Tablets Sampled from Pharmacies in Accra, Using the MVHimagePCv8.exe Color Software 571 system. Production plants with ineffective quality opera- tions that do not operate according to Good Manufactur- ing Practice (GMP) may end up manufacturing products that would not meet specifications and thus considered substandard. However it is important to state that a drug or product may lose its quality after production if trans- portation, storage and other post production protocols are not effective or followed effectively. For a product to pass quality test, analytical results obtained in laboratory experiment or calculated from experimental measurements are compared with stated acceptance criteria in internationally accepted compendia (e.g. USP). The acceptance criteria are mostly set to make room for analytical errors, unavoidable variations in manufacturing and compounding and for deterioration to an extent considered acceptable under practical condi- tions [9]. An official standard product shall be formulated with the intent to provide 100% of the quantity of each active ingredient stated on the label. Variations are however possible and do occur no matter how carefully the proc- essing was done. In view of this, the International Con- ference of Harmonization (ICH) and the United States Pharmacopoeia (USP) recommend that assay of a drug substance or finished product shall range from 80% to 120% of the test concentration [11]. In reference to the above stated criteria, the analysis employed in this study used the above mentioned range to determine the acceptability or otherwise of both Arte- mether and Lumefantrine in the tablet samples analyzed. Thus any sample that had their percentage concentrations falling within the range was said to be satisfactory. Sam- ples that fell below or above the range were said to have questionable states of quality. AL-S4 failed artemether content, not because there was not enough active drug ingredient, but because there was more than the allowable amount. This could have happened because of poor quality control measures at the manufacturing facility, or a deliberate attempt to increase the content of one ingredient (most likely the cheaper) to make up for a lower amount of the second ingredient. The lumefantrine content of AL-S6 is of grave concern. Although it is difficult to ascertain the cause of the very low lumefantrine content, drug degradation cannot be used as a reason for this observation. The sample was well within the expiry date and it is highly unlikely that the active ingredient will degrade by almost 50%. It could be attributed to poor manufacturing practice or a deliberate attempt to decrease the amount of the Lume- fantrine content. Most of the samples analyzed showed a percent error of 15% or less. Very few, however, showed very high variability. A further modification of the method, for example, use of a better solvent for both ingredients might improve the product yield. The method used here has been shown in other experiments in our lab (results not shown here) to be reliable and robust. 6. Conclusions The results showed a trend that looked like artemether concentrations are being increased at the expense of lumefantrine probably due to cost. However, this is an unacceptable practice because the role of lumefantrine in its right amount is important in this combination therapy and cannot be compromised. In addition to augmenting the effect of highly effective artemether, lumefantrine also prevents the development of resistance against the artemisinins, a group of antima- larials that the world is trying hard to protect against re- sistance to their use. Malaria is a deadly disease that affects people of all ages and it is a major cause of morbidity and mortality in Ghana. Since its discovery many drugs have been used to manage the disease with a lot of changes being made over the years due to the development of resistance. This problem has been largely attributed to non com- pliance and the availability and use of substandard or counterfeit products on the market resulting in treatment failure and the subsequent development of resistance. Methods for drug analysis have been confined to well equip laboratories with expensive and sophisticated equip- ments thus making it difficult to quickly and easily ana- lyze and detect possible substandard drugs entering the market. With the development of such simple methods of drug analysis, more drugs can be tested quickly and easily to help do away with the substandard ones. The MVHimagePCv8.ex colour technology for drug analysis was used in this project to analyze Artemether/ Lumefantrine products obtained from Community Phar- macies in Accra, Ghana. The results after the analysis revealed that, two out of the 9 samples (AL-S4 and AL- S6), failed the test. These results therefore show that there may still be antimalarials on the market that are substandard and thus need to be investigated and dealt with. REFERENCES [1] A. O. Ajibola, “Essential Medicinal Chemistry,” 3rd Edi- tion, Hope, Ibadan, 2005, pp. 404-429. [2] Hazel, et al., “Malaria Case Management in Ghana, Training Manual for Pharmacist,” 2009, p. 8. http://en.wikipedia.org/wiki/Malaria#History [3] WHO, “Report of an Informal Consultation,” Geneva, 13-17 November 2000. Open Access PP  Quality Assessment of Artemether/Lumefantrine Tablets Sampled from Pharmacies in Accra, Using the MVHimagePCv8.exe Color Software Open Access PP 572 [4] GHS, “Training Manual for the Management of Malaria at Health Facilities in Ghana,” 2009, pp. 7-10. [5] J. D. Michele Forzley, “Combating Counterfeit Drugs: A Concept Paper for Effective International Collaboration,” 2005, p. 2. [6] R. B. Taylor, O. Shakoor, R. H. Behrens, M. Everard, A. S. Low, J. Wangboonskul, R. G. Reid and J. A. Kolawole, “Pharmacopoeial Quality of Drugs Supplied by Nigerian Pharmacies,” Lancet, Vol. 357, No. 9272, 2001, pp. 1933-1936. http://dx.doi.org/10.1016/S0140-6736(00)05065-0 [7] M. D. Green, H. Nettey, O. V. Rojas, C. Pamanivong, L. Khounsaknalath, M. G. Ortiz, P. N. Newton, F. M. Fernández, L. Vongsack and O. Manolin, “Use of Re- fractometry and Colorimetry as Field Methods to Rapidly Assess Antimalarial Drug Quality,” Journal of Pharma- ceutical and Biomedical Analysis, Vol. 43, No. 1, 2007, pp. 105-110. http://dx.doi.org/10.1016/j.jpba.2006.06.047 [8] M. D. Green, F. Atieli and M. Akogbeto, “Rapid Colori- metric Field Test to Determine Levels of Deltametrin on PermaNet Surfaces: Association with Mosquito Bioactiv- ity,” Tropical Medicine and International Health, Vol. 14, No. 4, 2009, pp. 381-388. http://dx.doi.org/10.1111/j.1365-3156.2009.02247.x [9] United States Pharmacopeia, 2009. [10] J.-M. Caudron, N. Ford, M. Henkens, C. Mace, R. Kid- dle-Monroe and J. Pinel, “Substandard Medicines in Re- source-Poor Settings: A Problem That Can No Longer Be Ignored,” Tropical Medicine & International Health, Vol. 13, No. 8, 2008, pp. 1062-1072. [11] F. E. Lytle, et al., “Incurred Sample Reanalysis: Enhanc- ing the Bland-Altman Approach with Tolerance Inter- vals,” Bioanalysis, Vol. 1, No. 4, 2009, pp. 705-714. |