

Paper Menu >>
Journal Menu >>
 iBusiness, 2013, 5, 36-40 http: //dx.doi.org/10.4236/ib.201 3.53B008 Published Online September 2013 (http://www.scirp.org/journal/ib) Simulation Based Prospective Productivity Assessment of Complex Services Andreas Petz, Sönke Duckwitz, Susanne Mütze-Niewöhner, Christopher M. Schlick Work Organization Department, Chair and Institute of Industrial Engineering and Ergonomics at the RWTH Aachen University, Aachen, Germany. Email: [email protected] Received May, 2013 ABSTRACT Although services play a crucial role in developed countries, service productivity management is not as much re- searched as productivity management in production systems. Especially complex, knowledge inten sive service systems have specific characteristics that have to be considered, in order to comprehensively evaluate their performance. A novel productivity model considering quantitative as well as qualitative aspects from both customer and provider side lays the foundation for a simulation based prospective productivity assessment of complex services. The paper con- cludes by presenting a use case scenario from the chemical industry. Keywords: Complex Service Productivity; Key Performance Indicators; Simulation 1. Introduction Services, especially complex, knowledge intensive services are gaining more and more importance not only because of the high workforce rate in this sector but also due to their cont ribut ion on grow th and w elf are in emerg ing an d developed countries. In Germany, the gross added value in this sector is growing slower than the workforce rate and offers an evidence for slower productivity gains in comparison to the production sector [13]. Although ser- vices play an important role, service productivity man- agement is not as much investigated as productivity management in the production industry mostly due to the specific characteristics of services and due to a meas- urement mismatch [4,13]. 1.1. Complex, Knowledge Intensive Services Defining services is a challenging task. The most suitable approach is given by Donabedian and Hilke [1,16]. Ac- cording to them, services can be specified from three dimensions: the potential, the process and the outcome dimension. From the potential perspective a service is defined as the availability of resources for service provi- sion or the willingness to perform a specific service. In the process dimension, services are defined as joint or standalone activities during the service provision. Finally, from the outcome perspective, services are defined as the material or immaterial result of the service prov ision. The traditional definition is supp lemented by generally accepted service specific characteristics known as the IHIP characteristics: Intangibility, Heterogeneity, In- separability and Perishab ility [9]. Following this three dimensional differentiation, com- plex services such as research and development or con- sultancy are characterized by a high degree of these spe- cific attributes and are usually organized in projects. In the potential dimension the amount of the composing elements (input factors), their heterogeneity as well as their interrelations are highly time and space dependent resulting in an increase of complexity [10,11]. In the process dimension an intensive customer to service pro- vider interaction and thereby the induced uncertainty and changeability of the process over time (dynamics) in- creases complexity. Finally, the outcome is also hetero- geneous, vague beforehand and the service perception is highly immaterial as an evidence of high complexity. 1.2. Service Productivity The traditional productivity definition as a ratio of vol- umes of output and input has its origins in the assessment of isolated production systems [6]. Thus, service inherent characteristics like customer integration and the simulta- neity of production and consumption (service perishabil- ity) are not considered at all. In complex service systems the simultaneity is considered especially when exchang- ing information in terms of communication or collabora- tion. Some scholars tried to close this gap by developing service specific productivity models with focus on some Copyright © 2013 SciRes. IB 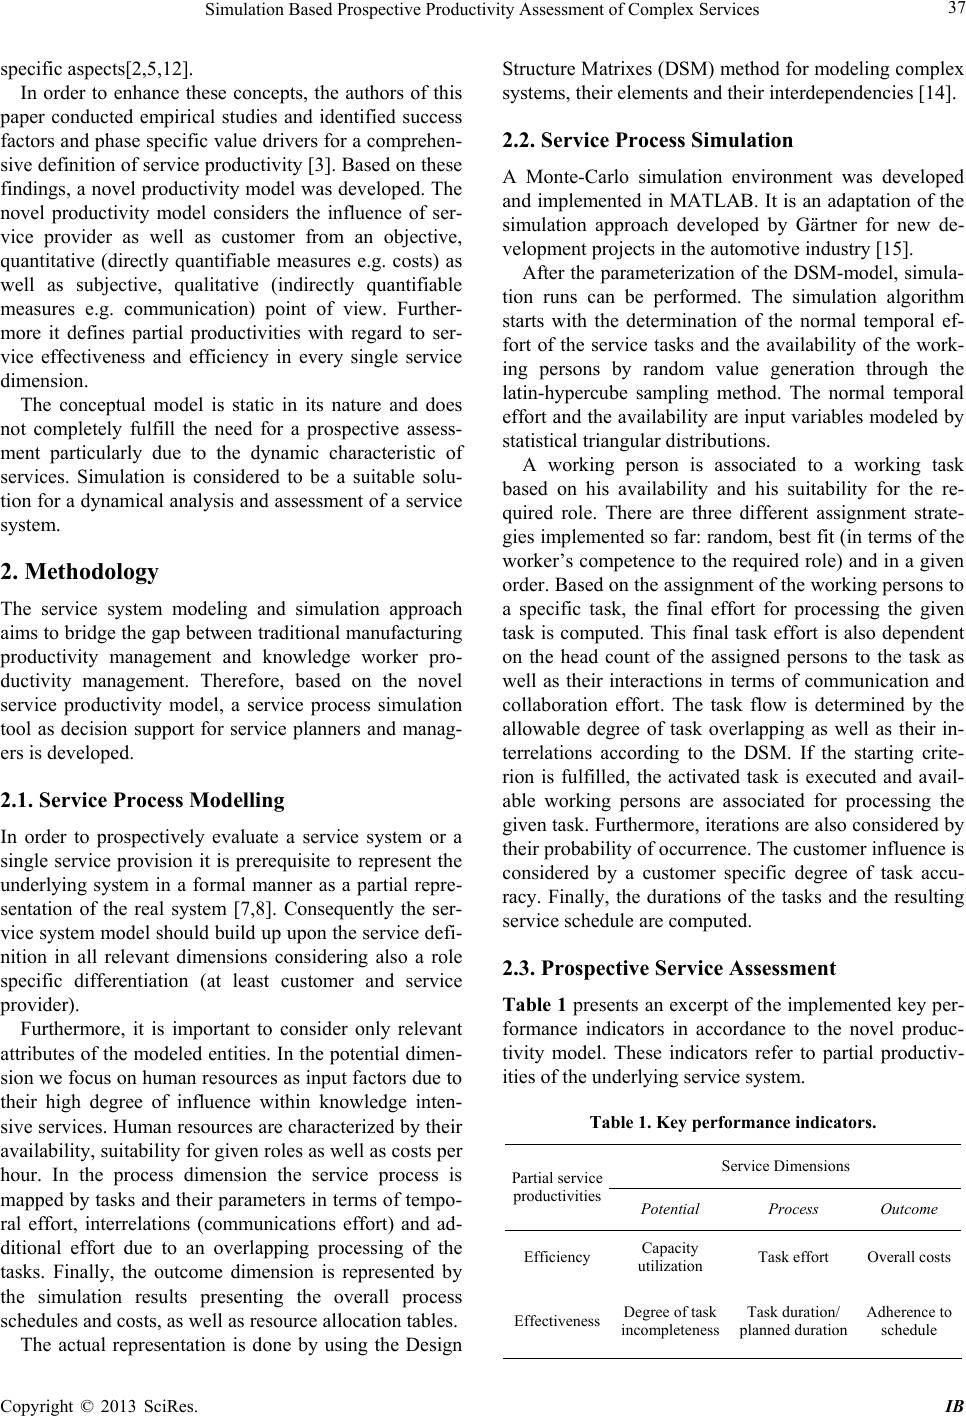 Simulation Based Prospective Productivity Assessment of Complex Services 37 specific aspects[2,5,12]. In order to enhance these concepts, the authors of this paper conducted empirical studies and identified success factors and phase specific value drivers for a comprehen- sive definition of service productiv ity [3]. Based on these findings, a novel p roductivity model was develope d. The novel productivity model considers the influence of ser- vice provider as well as customer from an objective, quantitative (directly quantifiable measures e.g. costs) as well as subjective, qualitative (indirectly quantifiable measures e.g. communication) point of view. Further- more it defines partial productivities with regard to ser- vice effectiveness and efficiency in every single service dimension. The conceptual model is static in its nature and does not completely fulfill the need for a prospective assess- ment particularly due to the dynamic characteristic of services. Simulation is considered to be a suitable solu- tion for a dynamical analysis and assessment of a service system. 2. Methodology The service system modeling and simulation approach aims to bridge the gap b etween traditional manufacturing productivity management and knowledge worker pro- ductivity management. Therefore, based on the novel service productivity model, a service process simulation tool as decision support for service planners and manag- ers is developed. 2.1. Service Process Modelling In order to prospectively evaluate a service system or a single service provision it is prerequisite to represent the underlying system in a formal manner as a partial repre- sentation of the real system [7,8]. Consequently the ser- vice system model should build up upon the service defi- nition in all relevant dimensions considering also a role specific differentiation (at least customer and service provider). Furthermore, it is important to consider only relevant attributes of the modeled en tities. In the potential dimen- sion we focus on human resources as input factors due to their high degree of influence within knowledge inten- sive services. Human resources are characterized by their availability, suitability for given roles as well as costs per hour. In the process dimension the service process is mapped by tasks and their parameters in terms of tempo- ral effort, interrelations (communications effort) and ad- ditional effort due to an overlapping processing of the tasks. Finally, the outcome dimension is represented by the simulation results presenting the overall process schedules and costs, as well as resource allocation tables. The actual representation is done by using the Design Structure Matrixes (DSM) method for modeling complex systems, their elements and their interdependencies [14]. 2.2. Service Process Simulation A Monte-Carlo simulation environment was developed and implemented in MATLAB. It is an adaptation of the simulation approach developed by Gärtner for new de- velopment projects in the automotive industry [15]. After the parameterization of the DSM-model, simula- tion runs can be performed. The simulation algorithm starts with the determination of the normal temporal ef- fort of the service tasks and the availability of the work- ing persons by random value generation through the latin-hypercube sampling method. The normal temporal effort and the availability are inpu t variables modeled by statistical triangular distribution s. A working person is associated to a working task based on his availability and his suitability for the re- quired role. There are three different assignment strate- gies implemented so far: random, best fit (in terms of the worker’s competence to the required role) and in a given order. Based on the assignment of the working persons to a specific task, the final effort for processing the given task is computed. This final task effort is also dependent on the head count of the assigned persons to the task as well as their interactions in terms of communication and collaboration effort. The task flow is determined by the allowable degree of task overlapping as well as their in- terrelations according to the DSM. If the starting crite- rion is fulfilled, the activated task is executed and avail- able working persons are associated for processing the given task. Furthermore, iterations are also considered by their probability of occu rren ce. The cu stomer influ ence is considered by a customer specific degree of task accu- racy. Finally, the durations of the tasks and the resulting service schedule are computed. 2.3. Prospective Service Assessment Table 1 presents an excerpt of the implemented key per- formance indicators in accordance to the novel produc- tivity model. These indicators refer to partial productiv- ities of the underlying service system. Table 1. Key performance indic a tor s. Service Dimensions Partial service productivities Potential Process Outcome Efficiency Capacity utilization Task effort Overall costs Effectiveness Degree of task incompleteness Task duration/ planned duration Adherence to schedule Copyright © 2013 SciRes. IB 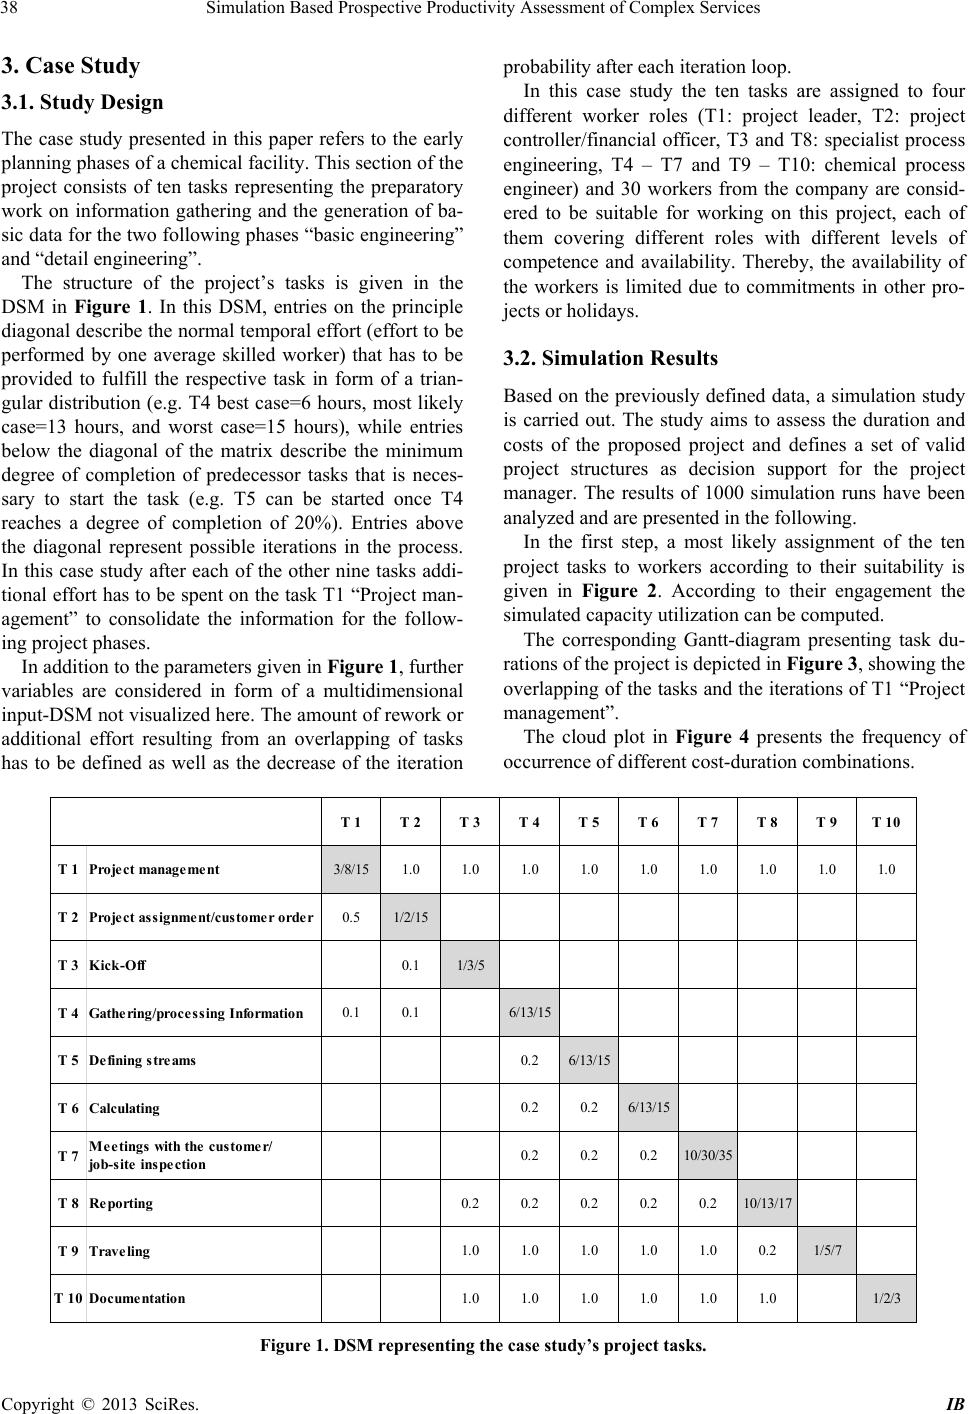 Simulation Based Prospective Productivity Assessment of Complex Services Copyright © 2013 SciRes. IB 38 3. Case Study probability after each iteration loop. In this case study the ten tasks are assigned to four different worker roles (T1: project leader, T2: project controller/financial officer, T3 and T8: specialist process engineering, T4 – T7 and T9 – T10: chemical process engineer) and 30 workers from the company are consid- ered to be suitable for working on this project, each of them covering different roles with different levels of competence and availability. Thereby, the availability of the workers is limited due to commitments in other pro- jects or holidays. 3.1. Study Design The case study presented in this paper refers to the early planning phases of a chemical facility. This section of the project consists of ten tasks representing the preparatory work on information gathering and the generation of ba- sic data for the two following phases “basic engineering” and “detail engineering”. The structure of the project’s tasks is given in the DSM in Figure 1. In this DSM, entries on the principle diagonal describe the normal temporal effort (effort to be performed by one average skilled worker) that has to be provided to fulfill the respective task in form of a trian- gular distribution (e.g. T4 best case=6 hours, most likely case=13 hours, and worst case=15 hours), while entries below the diagonal of the matrix describe the minimum degree of completion of predecessor tasks that is neces- sary to start the task (e.g. T5 can be started once T4 reaches a degree of completion of 20%). Entries above the diagonal represent possible iterations in the process. In this case study after each of the other nine tasks addi- tional effort has to be spen t on the task T1 “Project man- agement” to consolidate the information for the follow- ing project pha ses. 3.2. Simulation Results Based on the previously defined data, a simulation study is carried out. The study aims to assess the duration and costs of the proposed project and defines a set of valid project structures as decision support for the project manager. The results of 1000 simulation runs have been analyzed and are presented in the following. In the first step, a most likely assignment of the ten project tasks to workers according to their suitability is given in Figure 2. According to their engagement the simulated capacity utilizatio n can be computed. The corresponding Gantt-diagram presenting task du- rations of the project is depicted in Figure 3, showing the overlapping of the tasks and the iterations of T1 “Proj ect management”. In addition to the parameters given in Figure 1, further variables are considered in form of a multidimensional input-DSM not visualized here. The amount of rework or additional effort resulting from an overlapping of tasks has to be defined as well as the decrease of the iteration The cloud plot in Figure 4 presents the frequency of occurrence of different cost-d urat i o n c ombinations. T 1T 2T 3T 4T 5T 6T 7T 8T 9T 10 T 1Projec t management3/8/151.0 1.0 1.0 1.0 1.0 1.01.0 1.0 1.0 T 2Pro jec t assignment / cust omer order0.5 1/2/15 T 3Kick- Off0.1 1/3/5 T 4Gathering/ pro cessing Info rmation0.1 0.16/13/15 T 5Defining streams0.2 6/13/15 T 6Calculating0.20.2 6/13/15 T 7Meetings with the customer/ job-site inspection0.2 0.2 0.210/30/35 T 8Reporting0.2 0.2 0.2 0.2 0.210/13/17 T 9Traveling1.0 1.0 1.0 1.0 1.0 0.21/5/7 T 1 0Do cumentation1.0 1.0 1.0 1.0 1.0 1.01/2/3 Figure 1. DSM representing the case study’s project tasks. 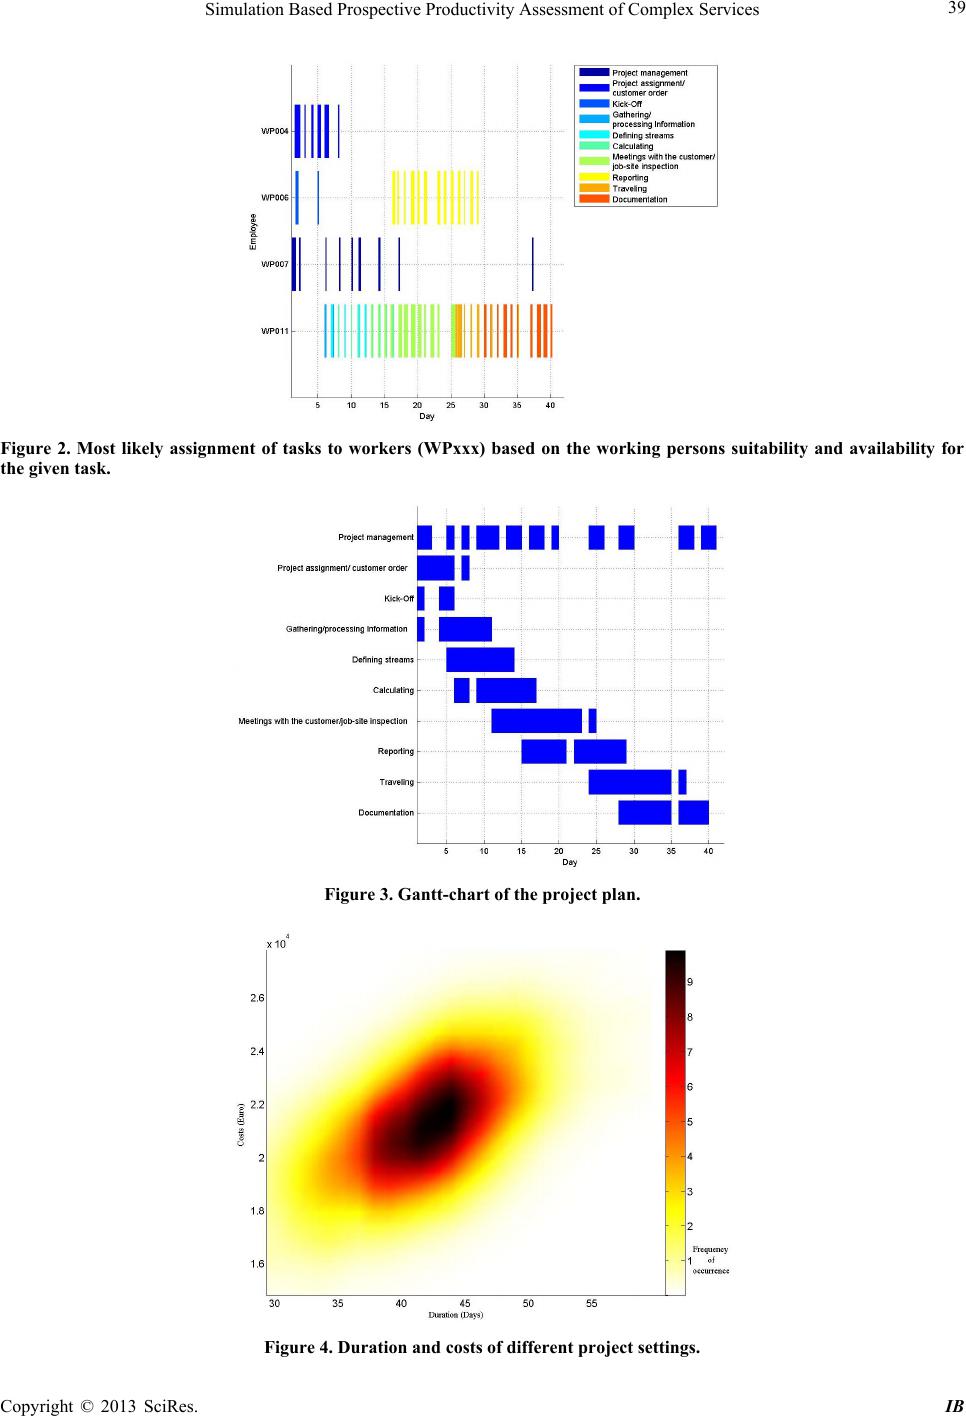 Simulation Based Prospective Productivity Assessment of Complex Services 39 Figure 2. Most likely assignment of tasks to workers (WPxxx) based on the working persons suitability and availability for the given task. Figure 3. Gantt-chart of the project plan. Figure 4. Duration and costs of different project settings. Copyright © 2013 SciRes. IB  Simulation Based Prospective Productivity Assessment of Complex Services 40 Based on this information, the project duration is ap- proximately between 33 and 48 days, the most likely duration is 41 days. The costs of the project vary between 17 and 25 thousand Euros and are most likely 21 thou- sand Euros. These results represent valuable information for the project planner. He is able to assess the risk of the project and select a project organization that will with a high probability lead to a successful project outco me. 4. Outlook In order to verify and validate the conceptual productiv- ity model and the simulation system broader studies will be conducted. Furthermore, more detailed use cases from our project partners will be gathered and will assist to prove the usefulness of a dynamical assessment of ser- vice productivity. This will enable service planners and managers to take reliable decisions based on a system- atical support. As a further enhancement an optimization algorithm will be developed and connected to the simulation tool. This will close the loop by identifying optimal organiza- tional settings under given circumstances of uncertainty. 5. Acknowledgements The research is funded by the German Federal Ministry of Education and Research (BMBF), Project: ProLoDi, according to Grant No. 01FL10050, Research Program “Productivity of Services” supervised by the Project Management Agency of the German Aerospace Center (PT-DLR). The authors would like to express their grati- tude for the support given. REFERENCES [1] A. Donabedian, “The Definition of Quality and Ap- proaches to Its Assess ment,” Health Administration Press MI, Vol. 1, 1980. [2] A. Parasuraman “Service Quality and Productivity: A Synergistic Perspective,” Managing Service Quality, Vol. 12, No. 1, 2002, pp. 6-9. doi:10.1108/096045202104 [3] A. Petz, S. Duckwitz, C. Schmalz, S. Mütze-Niewöhner and C. M. Schlick, “Development and Evaluation of a Novel Service Productivity Model,” Proceedings of the 5th CIRP International Conference on Industrial Prod- uct-Service Systems, Bochum, Germany, 14-15 March, 2013, pp. 383-394. [4] A. Wölfl, “Productivity Growth in Service Industries,” OECD Science, Technology and Industry Working Pa- pers, OECD Publishing, 2003. doi:10.1787/086461104618 [5] C. Grönroos and K. Ojasalo, “Service Productivity to- wards a Conceptualization of the Trans-formation of In- puts into Economic Results in Services” Journal of Busi- ness Research, Vol. 57, 2004, pp. 414-432. doi:10.1016/S0148-2963(02)00275-8 [6] H. Corsten and R. Gössinger, “Dienstle is Tungs Management,” 5th Edition, Oldenburg Verlag, München, 2007. [7] H. Stachowiak, “Modelle – Konstruktion der Wirklichkeit, ” Wilhelm Fink Verlag, Munich, 1983, pp. 130-133. [8] J. Banks, “Handbook of Simulation,” John Wiley & Sons Ltd., Atlanta, 1998. doi:10.1002/9780470172445 [9] J. Fitzsimmons and M. Fitzsimmons, “Service Manage- ment: Operations, Strategy and Information Technology,” 7. Edition, McGraw-Hill, London 2011. [10] J. Güthoff, “Qualität Komplexer Dienstleistungen,” Ph. D. Thesis, Rostock University, Gabler, Wiesbaden, 1995. [11] M. Bruhn and M.-O. Blockus, “Komplexität und Produktivität bei Dienstleistungen,” In: M. Bruhn, K. Hadwich, Dienstleistungsproduktivität: Management, Prozessgestaltung, Kundenperspektive, Gabler Verlag, Wiesbaden, Vol. 1, 2011, pp. 59-89. [12] R. Johnston and P. Jones, “Service Productivity – To- wards Understanding the Relationship between Opera- tional and Customer Productivity,” International Journal of Productivity and Performance Management Vol. 53, No. 3, 2004, pp. 201-213. doi:10.1108/17410400410523756 [13] Rheinisch-Westfälisches Institut für Wirtschaftsforschung, “Potenziale des Dienstleistungssektors für Wachstum von Bruttowertschöpfung und Beschäftigung,” Final Report, RWI, Essen, 2008. [14] S. D. Eppinger and T. R. Browning, “Design Structure Matrix Methods and Applications,” MIT Press, Cam- bridge, 2012. [15] T. Gärtner, “Simulationsmodell für das Projekt- und Änderungsmanagement in der Automobilentwicklung auf Basis der Design Structure Matrix,” Ph.D. Thesis, RWTH Aachen University, Shaker Verlag, Aachen, 2011. [16] W. Hilke, “Grundprobleme und Entwicklungstendenzen des Dienstleistungs-Marketing,” In: W. Hilke, Ed. Dienstleistungsmarketing, Gabler, Wiesbaden, 1989. Copyright © 2013 SciRes. IB |