

Paper Menu >>
Journal Menu >>
 Engineering, 2013, 5, 877-880 Published Online November 2013 (http://www.scirp.org/journal/eng) http://dx.doi.org/10.4236/eng.2013.511107 Open Access ENG Performance Evaluation for Gas Production Units Based on ANP Jianhong Gou1,2, Anqi Li3, Zhibin Liu1, Xinhai Kong4, Haohan Liu1,5* 1School of Graduate, Southwest Petroleum University, Chengdu, China 2The No. 1 Gas Production Plant, PetroChina Changqing Oilfield Company, Yinchuan, China 3PetroChina Changqing Oilfield Company, Xi’an, China 4Department of Petroleum Engineering, Guang’an Vocational & Technical College, Guang’an, China 5Sichuan College of Architectural Technology, Deyang, China, Email: *[email protected] Received August 25, 2013; revised September 25, 2013; accepted October 5, 2013 Copyright © 2013 Jianhong Gou et al. This is an open access article distributed under the Creative Commons Attribution License, which permits unrestricted use, distribution, and reproduction in any medium, provided the original work is properly cited. ABSTRACT In view of the existing situation of gas field development, one kind of method to evaluate the production performance of gas production units (GPUs) was presented in this paper. Among the commonly used indicators of gas field devel- opment, we select 11 indicators from the three aspects of production task, gas reservoir management, and production technology. According to the principle of analytic network process (ANP), this paper introduced one kind of new method to get the weights of indicators. By means of the method of TOPSIS, it is easy to obtain the rankings for all the GPUs through calculating the weighted Eu clidean distance between each GPU and the positive or negative ideal point. This evaluation method could constantly improve the management level of gas production units and deepen the delicacy management of gas field deve lopment . Keywords: Gas Production Unit (GPU); Performance Evaluation; Analytic Network Process (ANP); TOPSIS 1. Introduction The oil and gas field companies mostly take the man- agement concept of “Benchmarking” during the process of gas field development [1]. According to the dynamic analysis of gas reservoir development, the technical sec- tion provides a kind of development scheme and sets some feasible goals that should be achieved. And the gas production units (GPUs) must achieve the production goals in accordance with the development requirements [2]. Currently, the development department in the proc- ess of gas field development evaluates the production performance of GPUs based on their own statistics data and the assessment results calculated by themselves [3]. It means that the evaluation accuracy is not high enough and the crosswise contrast is not enough. In order to make the development department accurate and timely, and grasp the current situation of development and man- agement of GPUs, it needs to establish a relatively per- fect evaluation system to really respond to the manage- ment level, efficiency, and development effect of GPUs, promoting the delicacy management of gas field develop- ment. In this paper, we first present the evaluation indi- cators and their computing methods. In order to reasona- bly decide the weight of each indicator, this method of ANP is introduced. Next, we introduce the method of TOPSIS to decide the comprehensive ranking of GPUs and use the Euclidean distance to describe the proximity between two GPUs. 2. Use Evaluation Indicators and Their Computing Methods Through the analysis, the production performance eva- luation indicators of GPU are divided into three aspects of production task, gas reservoir management, and pro- duction technology [1-5] (see Figure 1), including 11 indicators in the following. 2.1. Production Task The production task [4,5], denoted as B1, contains the completion rate of gas production (C11) , the completion ate of water injection (C12), and the completion rate of r *Corresponding a uthor. 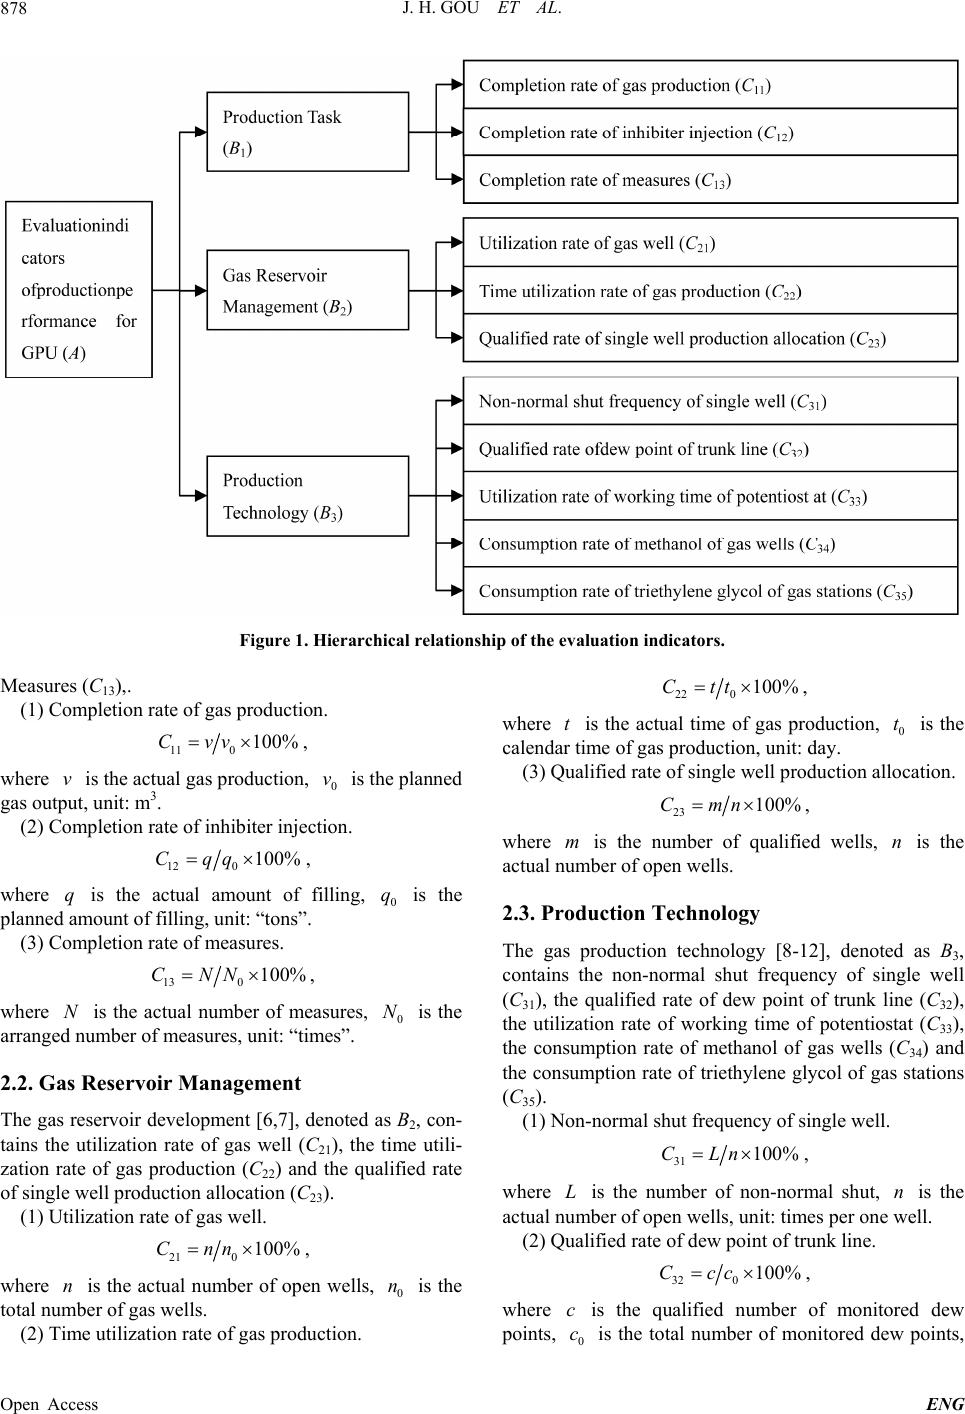 J. H. GOU ET AL. 878 Figure 1. Hierarchical relationship of the evaluation indicators. Measures (C13),. (1) Completion rate of gas production. 110 100%Cvv , where is the actual gas production, is the planned gas output, unit: m3. v0 v (2) Completion rate of inhibiter injection. 120 100%Cqq , where is the actual amount of filling, is the planned amount of filling, unit: “tons”. q0 q (3) Completion rate of measures. 130 100%CNN, where is the actual number of measures, is the arranged number of measures, unit: “times”. N0 N 2.2. Gas Reservoir Management The gas reservoir development [6,7], denoted as B2, con- tains the utilization rate of gas well (C21), the time utili- zation rate of gas production (C22) and the qualified rate of single well production allocatio n (C23). (1) Utilization rate of gas well. 210 100%Cnn , where is the actual number of open wells, is the total number of gas wells. n0 n (2) Time utilization rate of gas production. 220 100%Ctt , where is the actual time of gas production, is the calendar time of gas productio n, unit: day. t0 t (3) Qualified rate of single well production allocation. 23 100%Cmn , where is the number of qualified wells, is the actual number of open wells. m n 2.3. Production Technology The gas production technology [8-12], denoted as B3, contains the non-normal shut frequency of single well (C31), the qualified rate of dew point of trunk line (C32), the utilization rate of working time of potentiostat (C33), the consumption rate of methanol of gas wells (C34) and the consumption rate of triethylene glycol of gas stations (C35). (1) Non-normal shut frequency of single well. 31 100%CLn , where is the number of non-normal shut, is the actual number of open wells, unit: times per one well. Ln (2) Qualified rate of dew point of trunk line. 320 100%Ccc , where is the qualified number of monitored dew points, is the total number of monitored dew points, c 0 c Open Access ENG 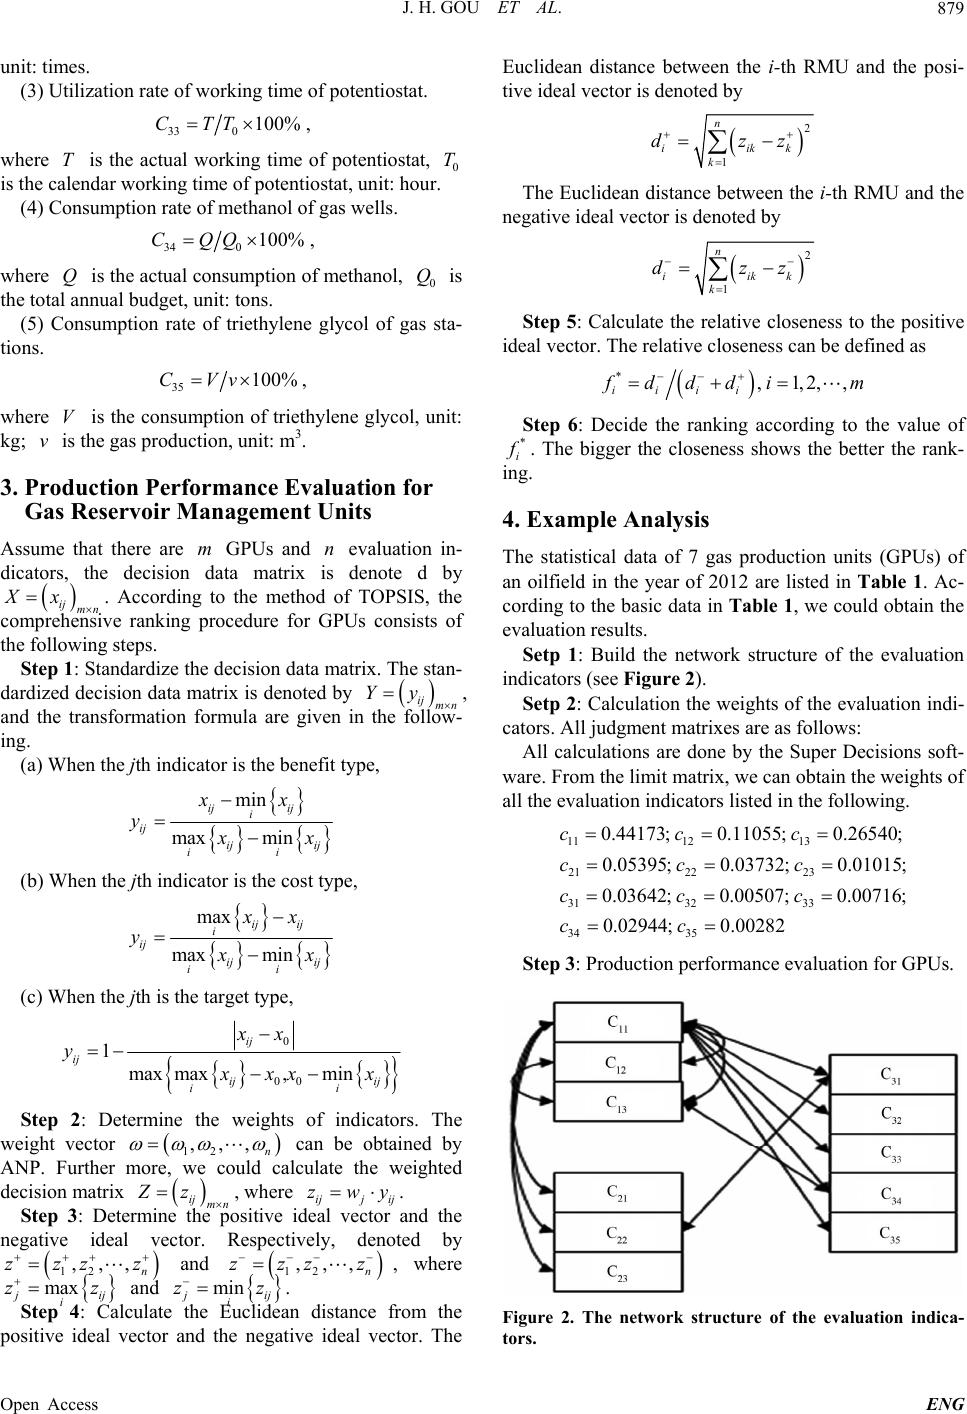 J. H. GOU ET AL. 879 unit: times. (3) Utilization rate of working time of potentiostat. 330 100%CTT , where is the actual working time of potentiostat, is the calendar working time of potentiostat, unit: hour. T0 T (4) Consumption rate of me t han ol o f gas wells. 340 100%CQQ, where is the actual consumptio n of methanol, is the total annual b udget, unit: tons. Q0 Q (5) Consumption rate of triethylene glycol of gas sta- tions. 35 100%CVv , where is the consumption of triethylene glycol, unit: kg; is the gas production, unit: m3. V v 3. Production Performance Evaluation for Gas Reservoir Management Units Assume that there are GPUs and evaluation in- dicators, the decision data matrix is denote d by mn. According to the method of TOPSIS, the comprehensive ranking procedure for GPUs consists of the following steps. m n ij Xx Step 1: Standardize the decision data matrix. The stan- dardized decision data matrix is denoted by ij Yy mn , and the transformation formula are given in the follow- ing. (a) When the jth indicator is the benefit type, min max min ij ij i ij ij ij i i xx y x x (b) When the jth indicator is the cost type, max max min ij ij i ij ij ij i i xx y x x (c) When the jth is the targe t type, 0 00 1max max,min ij ij ij ij i i xx y x xx x Step 2: Determine the weights of indicators. The weight vector 12 ,,, n ij Zz can be obtained by ANP. Further more, we could calculate the weighted decision matrix , where . mn ijj ij Step 3: Determine the positive ideal vector and the negative ideal vector. Respectively, denoted by and zwy 12 ,,, n zzzz 12 ,,, n zzzz , where max j ij zz i and min j ij i Step 4: Calculate the Euclidean distance from the positive ideal vector and the negative ideal vector. The Euclidean distance between the i-th RMU and the posi- tive ideal vector is denoted by zz . 2 1 n iik k dzz k The Euclidean distance between the i-th RMU and th e negative ideal vector is denoted by 2 1 n iik k dzz k Step 5: Calculate the relative closeness to the positive ideal vector. The relative closeness can be defined as *,1,2,, iiii f dddi m Step 6: Decide the ranking according to the value of * i f . The bigger the closeness shows the better the rank- ing. 4. Example Analysis The statistical data of 7 gas production units (GPUs) of an oilfield in the year of 2012 are listed in Table 1. Ac- cording to the basic data in Table 1 , we could obtain the evaluation results. Setp 1: Build the network structure of the evaluation indicators (see Figure 2). Setp 2: Calculation the weights of the evaluation indi- cators. All judgment matrixes are as follows: All calculations are done by the Super Decisions soft- ware. From the limit matrix, we can obtain the weights of all the evaluation indicators listed in the following. 11 1213 21 2223 31 3233 34 35 0.44173; 0.11055;0.26540; 0.05395; 0.03732; 0.01015; 0.03642; 0.00507;0.00716; 0.02944;0.00282 ccc ccc ccc cc Step 3: Production performance evaluation for GPUs. Figure 2. The network structure of the evaluation indica- ors. t Open Access ENG 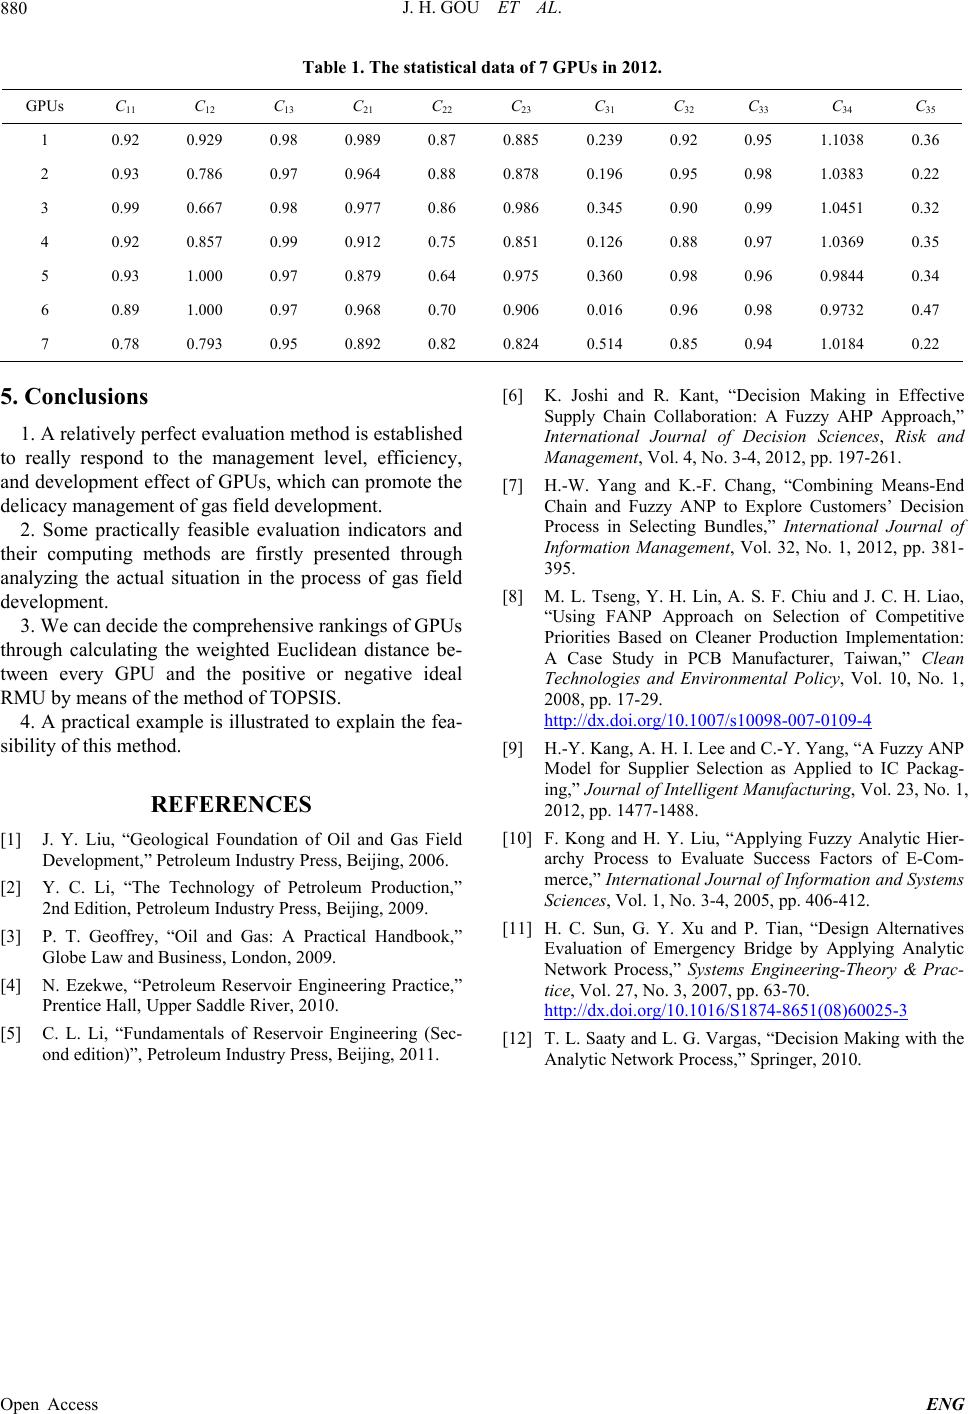 J. H. GOU ET AL. Open Access ENG 880 Table 1. The statistical data of 7 GPUs in 2012. GPUs C11 C12 C13 C21 C22 C23 C31 C32 C33 C34 C35 1 0.92 0.929 0.98 0.989 0.87 0.885 0.239 0.92 0.95 1.1038 0.36 2 0.93 0.786 0.97 0.964 0.88 0.878 0.196 0.95 0.98 1.0383 0.22 3 0.99 0.667 0.98 0.977 0.86 0.986 0.345 0.90 0.99 1.0451 0.32 4 0.92 0.857 0.99 0.912 0.75 0.851 0.126 0.88 0.97 1.0369 0.35 5 0.93 1.000 0.97 0.879 0.64 0.975 0.360 0.98 0.96 0.9844 0.34 6 0.89 1.000 0.97 0.968 0.70 0.906 0.016 0.96 0.98 0.9732 0.47 7 0.78 0.793 0.95 0.892 0.82 0.824 0.514 0.85 0.94 1.0184 0.22 5. Conclusions 1. A relatively perfect evaluation method is established to really respond to the management level, efficiency, and development effect of GPUs, which can promote the delicacy management of gas field development. 2. Some practically feasible evaluation indicators and their computing methods are firstly presented through analyzing the actual situation in the process of gas field development. 3. We can decide the comprehensive rankings of GPUs through calculating the weighted Euclidean distance be- tween every GPU and the positive or negative ideal RMU by means of the method of TOPSIS. 4. A practical example is illustrated to explain the fea- sibility of this method. REFERENCES [1] J. Y. Liu, “Geological Foundation of Oil and Gas Field Development,” Petroleum Industry Press, Beijing, 2006. [2] Y. C. Li, “The Technology of Petroleum Production,” 2nd Edition, Petroleum Industry Press, Beijing, 2009. [3] P. T. Geoffrey, “Oil and Gas: A Practical Handbook,” Globe Law and Business, London, 2009. [4] N. Ezekwe, “Petroleum Reservoir Engineering Practice,” Prentice Hall, Upper Saddle River, 2010. [5] C. L. Li, “Fundamentals of Reservoir Engineering (Sec- ond edition)”, Petroleum Industry Press, Beijing, 2011. [6] K. Joshi and R. Kant, “Decision Making in Effective Supply Chain Collaboration: A Fuzzy AHP Approach,” International Journal of Decision Sciences, Risk and Management, Vol. 4, No. 3-4, 2012, pp. 197-261. [7] H.-W. Yang and K.-F. Chang, “Combining Means-End Chain and Fuzzy ANP to Explore Customers’ Decision Process in Selecting Bundles,” International Journal of Information Management, Vol. 32, No. 1, 2012, pp. 381- 395. [8] M. L. Tseng, Y. H. Lin, A. S. F. Chiu and J. C. H. Liao, “Using FANP Approach on Selection of Competitive Priorities Based on Cleaner Production Implementation: A Case Study in PCB Manufacturer, Taiwan,” Clean Technologies and Environmental Policy, Vol. 10, No. 1, 2008, pp. 17-29. http://dx.doi.org/10.1007/s10098-007-0109-4 [9] H.-Y. Kang, A. H. I. Lee and C.-Y. Yang, “A Fuzzy ANP Model for Supplier Selection as Applied to IC Packag- ing,” Journal of Intelligent Manufacturing, Vol. 23, No. 1, 2012, pp. 1477-1488. [10] F. Kong and H. Y. Liu, “Applying Fuzzy Analytic Hier- archy Process to Evaluate Success Factors of E-Com- merce,” International Journal of Information and Systems Sciences, Vol. 1, No. 3-4, 2005, pp. 406-412. [11] H. C. Sun, G. Y. Xu and P. Tian, “Design Alternatives Evaluation of Emergency Bridge by Applying Analytic Network Process,” Systems Engineering-Theory & Prac- tice, Vol. 27, No. 3, 2007, pp. 63-70. http://dx.doi.org/10.1016/S1874-8651(08)60025-3 [12] T. L. Saaty and L. G. Vargas, “Decision Making with the Analytic Network Process,” Springer, 2010. |