

Paper Menu >>
Journal Menu >>
 Engineering, 2013, 5, 870-876 Published Online November 2013 (http://www.scirp.org/journal/eng) http://dx.doi.org/10.4236/eng.2013.511106 Open Access ENG Optimization of the Annealing Parameters for Improved Tensile Properties in Cold Draw n 0.12 wt% C Steel Nurudeen A. Raji, Oluleke O. Oluwole Mechanical Engineering Department, University of Ibadan, Ibadan, Nigeria Email: [email protected], [email protected] Received July 29, 2013; revised August 29, 2013; accepted September 7, 2013 Copyright © 2013 Nurudeen A. Raji, Oluleke O. Oluwole. This is an open access article distributed under the Creative Commons Attribution License, which permits unrestricted use, distribution, and reproduction in any medium, provided the original work is properly cited. ABSTRACT Drawn low carbon steel is characterized by brittle fracture. These defects are associated with the poor ductility and high strain hardening due to the cold work. There is a need therefore to determine optimum heat treatment parameters that could ensure improved toughness and ductility. Determining the optimum annealing parameters ensures valued recrys- tallization and also minimizes grain growth that could be detrimental to the resulting product. 40% and 55% cold drawn steels were annealed at temperatures 500˚C to 650˚C at intervals of 50˚C and soaked for 10 to 60 minutes at interval of 10 minutes to identify the temperature range and soaking time where optimum combination of properties could be ob- tained. Tensile test and impact toughness experiments were done to determine the required properties of the steel. Po- lynomial regression analysis was used to fit the properties relationship with soaking time and temperatures and the clas- sical optimization technique was used to determine the minimum soaking time and temperature required for improved properties of the steel. Annealing treatment at 588˚C for 11 minutes at grain size of 44.7 m can be considered to be the optimum annealing treatment for the 40% cold drawn 0.12 wt% C steel and 539˚C for 17 minutes at grain size of 19.5 m for the 55% cold drawn 0.12 wt% C steel. Keywords: Annealing; Steel; Cold Drawn; Soaking Time; Strength; Optimization 1. Introduction Structural change occurs during cold drawn deformation of metals in which the grains forming the basic matrix of the metal are gradually stretched in the direction of the principal deformation with directional arrangement of the crystallographic lattice. The drawing process is consid- ered to be one of the most effective and flexible methods to improve surface finish, to obtain precise dimension and to obtain the specified mechanical properties of a product [1]. The individual grain of a polycrystalline materials changes relative to the direction of applied stress during the deformation which is distributed het- erogeneously among the individual grains [2]. The ex- tension of grains in the drawing direction also occurs [3,4]. A typical feature of such deformed structure is anisotropy of the metal mechanical properties [5]. An initially isotropic material responds by developing ani- sotropy when subjected to inelastic deformation. The metal is strain hardened with the strength and hardness increasing with increasing degree of the cold-work and reducing ductility and impact value. Also unstable defect structures are retained after the cold deformation includ- ing accumulation of dislocation [6]. Effects of such cold work on the properties of poly- crystalline structures have been studied extensively [7-17]. It has been established that cold working and subsequent aging enhances the hardness and tensile strength (UTS) of the material but significantly deterio- rate the ductility and impact energy [18]. The poor im- pact property could be as a result of inhomogeneous de- formation within some parts of the material and high stress concentrations at points where the dislocations are concentrated. Impact of cold deformation and annealing on the mechanical properties of HSLA steel had been studied [19]. Several studies follow to investigate the effect of deformation and treatment on the properties of materials. Finite element method was used [20] to deter- mine the proportion of contribution of die radius, blank holder force and friction coefficient in the deep-drawing process. The study provided an insight into the deep drawing of stainless steel blank sheet. The quality of the  N. A. RAJI, O. O. OLUWOLE 871 drawn part was found to depend on the forming condi- tions, the optimal value of process parameters and their favorable combination. Investigation on the mechanical properties variation in drawn wires of high-alloy steel and special alloys for optimum ranges of deformation has been determined [21]. The non-uniformity of properties on the cross-section of drawn wire was found to depend individually on the grade of the drawn material. Mechanical properties distributions on the cross sec- tions of drawn products were investigated [22]. Specific effective strain non-uniformities were found to influence the distribution of mechanical properties in the final product of the drawn bars. It was noticed that the non- uniformity of mechanical properties in bars before de- formation and different character of strain hardening of the bars after deformation was contributing factor to the influenced mechanical properties of the resulting product. It is also evident that the rate of deformation as defined by the die angle contributes to the state of the non-uni- formity of the bar. Strain hardening is the work harden- ing effect experienced by a metal which is deformed plastically. It is a phenomenon whereby a ductile metal becomes harder and stronger as it is plastically deformed [23]. The strain hardening causes increase in the internal stress of the material structure. The increase in the inter- nal energy is associated with the increase in the disloca- tion density of the metal structure due to the plastic de- formation. Other defects such as vacancies and intersti- tials could also generate due to the deformation [24,25]. Strengthening occurring at large strain plastic deforma- tions has been discussed both experimentally [26] and theoretically [27] in search of the relevant microscopic strengthening processes. The strain hardening effect was found to be due mainly to the movement of dislocation within the metal crystal structure as deformation pro- gresses. It is possible to influence considerably a complex of mechanical properties of particular steel by suitable combination of size of previous cold deformation and parameters of annealing properties. There is a need there- fore to optimize so that the heat treatment process pa- rameters can be defined to achieve best combination of the metal properties [28,29]. Determining the optimum annealing parameters can ensure valued recrystallization and also minimize grain growth that could be detrimental to the nails. The grain growth could be minimized by doing the heat treatment at the lowest possible tempera- ture and time. The optimum combination of the mini- mum soaking time and temperature of annealing could achieve recrystallized structures required for the im- proved mechanical properties. There have been several attempts to optimize heat treatment parameters towards achieving improved prop- erties of materials [30-37]. The several methods em- ployed include the classical optimization technique to quantify the mechanical property relationship with heat treatment parameters [33,34]. The technique couples the classical curve fitting with data obtained from experi- ment to form regression equations after which optimiza- tion of the low temperature impact properties was ob- tained. In [31] evolutionary algorithm procedure was attempted to optimize the heat treatment process for 7175 aluminum alloy. The procedure was compared with the classical optimization technique with the classical me- thod found to converge to local optimum solution as against convergence of the evolutionary algorithm pro- cedures to global optimal solution of heat treatment. Si- milar attempt was done [32] using artificial neural net- work combined with genetic algorithm to determine the optimum heat treatment parameters for the 7175 alumi- num alloy. 2. Methods 2.1. Experiments The low carbon steel wire used for this study was ob- tained from Nigeria Wire Industry Ltd, Ikeja, Nigeria. The samples were cold drawn at 40% and 55% degree of deformation and then annealed in a muffle furnace [38] at temperature range of 500˚C - 650˚C at interval of 50˚C for soaking time of 10 minutes, 20 minutes, 30 minutes, 40 minutes, 50 minutes and 60 minutes for each tem- perature. The annealed samples were subjected to tensile and impact toughness test [38]. The influence of the soaking time and annealing temperature on these proper- ties was optimized by formulating the dependency of the properties on the phase field order parameter of the re- crystallization kinetics for temperature range of 500˚C to 600˚C in order to avoid full recrystallization of all the sample grains beyond this temperature range. 2.2. Regression Analysis The recrystallization kinetics was obtained for the sam- ples as presented in [39]. Sets of mathematical equations are developed to represent the behavior of the yield strength Y , tensile strength T and impact tough- ness I mT to recrystallized fraction volume obtained from the phase field model using the regression analysis of the nth degree polynomial model which is generally given as; 21 01 21 . N N NN f xCCxCXCX CX (1) N C represents the polynomial coefficients. The polynomial regression model is used to model non-linear relationship between the independent variable and the dependent variables as follows; ,, YTImT E Open Access ENG 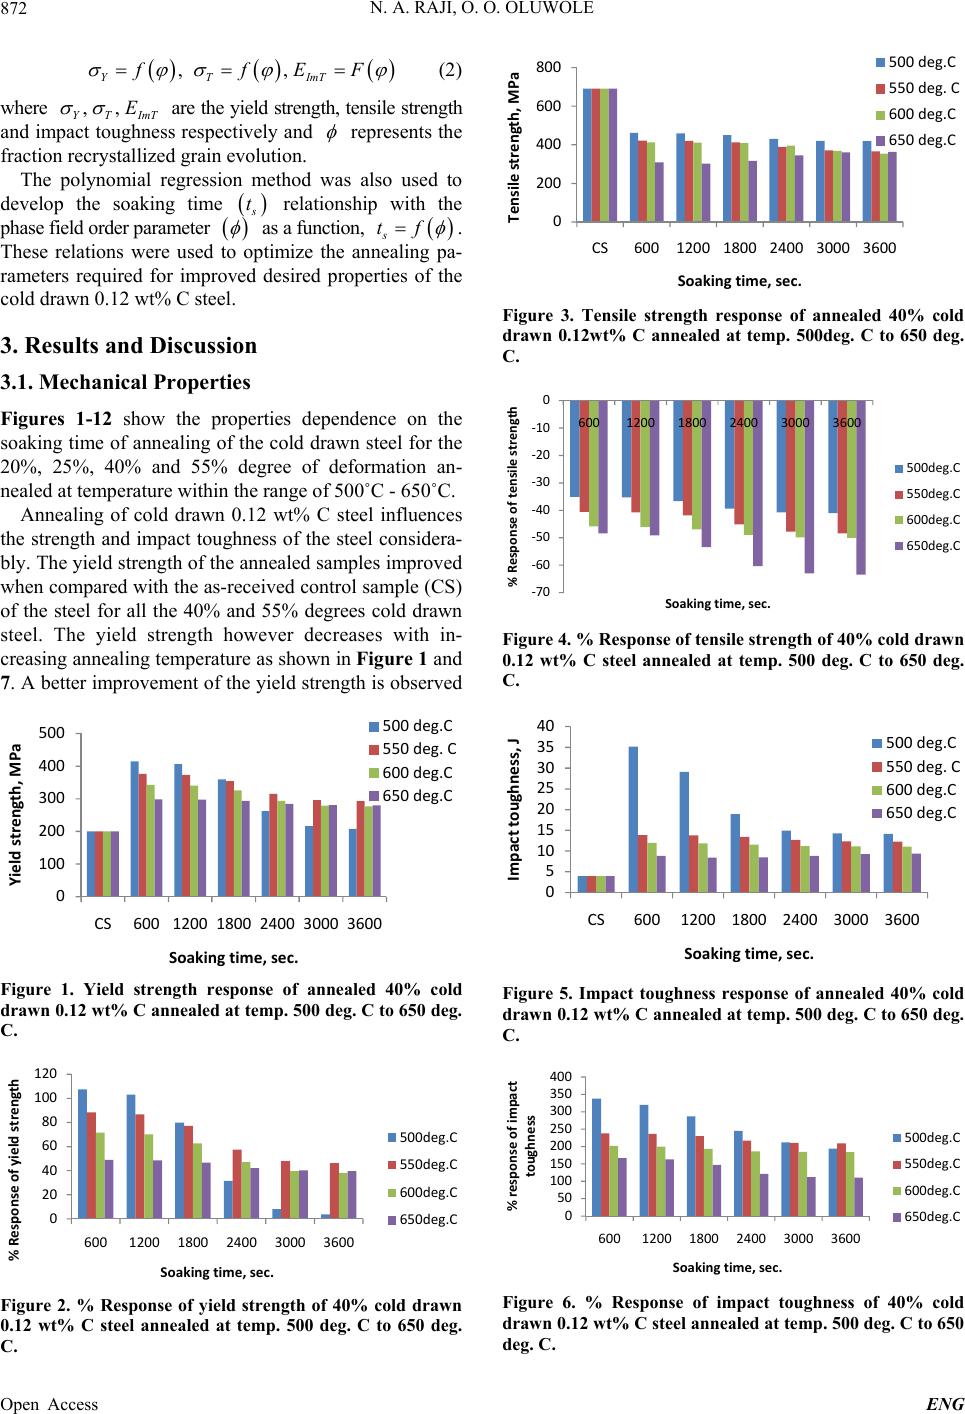 N. A. RAJI, O. O. OLUWOLE 872 ,, YTImT ffE F (2) where ,, YTImT E are the yield strength, tensile strength and impact toughness respectively and represents the fraction recrystallized grain evolution. The polynomial regression method was also used to develop the soaking time s t relationship with the phase field order parameter as a function, s tf . These relations were used to optimize the annealing pa- rameters required for improved desired properties of the cold drawn 0.12 wt% C steel. 3. Results and Discussion 3.1. Mechanical Properties Figures 1-12 show the properties dependence on the soaking time of annealing of the cold drawn steel for the 20%, 25%, 40% and 55% degree of deformation an- nealed at temperature within the range of 500˚C - 650˚C. Annealing of cold drawn 0.12 wt% C steel influences the strength and impact toughness of the steel considera- bly. The yield strength of the annealed samples improved when compared with the as-received control sample (CS) of the steel for all the 40% and 55% degrees cold drawn steel. The yield strength however decreases with in- creasing annealing temperature as shown in Figure 1 and 7. A better improvement of the yield strength is observed 0 100 200 300 400 500 CS6001200 1800 2400 3000 3600 Yield strength, MPa Soakin g time, sec. 500 deg.C 550 deg. C 600 deg.C 650 deg.C Figure 1. Yield strength response of annealed 40% cold drawn 0.12 wt% C annealed at temp. 500 deg. C to 650 deg. C. 0 20 40 60 80 100 120 6001200 1800 2400 3000 3600 % Response of yield strength Soaking time, sec. 500deg.C 550deg.C 600deg.C 650deg.C Figure 2. % Response of yield strength of 40% cold drawn 0.12 wt% C steel annealed at temp. 500 deg. C to 650 deg. C. 0 200 400 600 800 CS6001200 1800 2400 3000 3600 Tensile strength, MPa Soaking time, sec. 500 deg.C 550 deg. C 600 deg.C 650 deg.C Figure 3. Tensile strength response of annealed 40% cold drawn 0.12wt% C annealed at temp. 500deg. C to 650 deg. C. -70 -60 -50 -40 -30 -20 -10 0 6001200 1800 2400 3000 3600 % Response of tensile strength Soaking time, sec. 500deg.C 550deg.C 600deg.C 650deg.C Figure 4. % Response of tensile strength of 40% cold drawn 0.12 wt% C steel annealed at temp. 500 deg. C to 650 deg. C. 0 5 10 15 20 25 30 35 40 CS6001200 1800 2400 3000 3600 Impact toughness, J Soaking time, sec. 500 deg.C 550 deg. C 600 deg.C 650 deg.C Figure 5. Impact toughness response of annealed 40% cold drawn 0.12 wt% C annealed at temp. 500 deg. C to 650 deg. C. 0 50 100 150 200 250 300 350 400 6001200180024003000 3600 % response of impact toughness Soaking time, sec. 500deg.C 550deg.C 600deg.C 650deg.C Figure 6. % Response of impact toughness of 40% cold drawn 0.12 wt% C steel annealed at temp. 500 deg. C to 650 deg. C. Open Access ENG 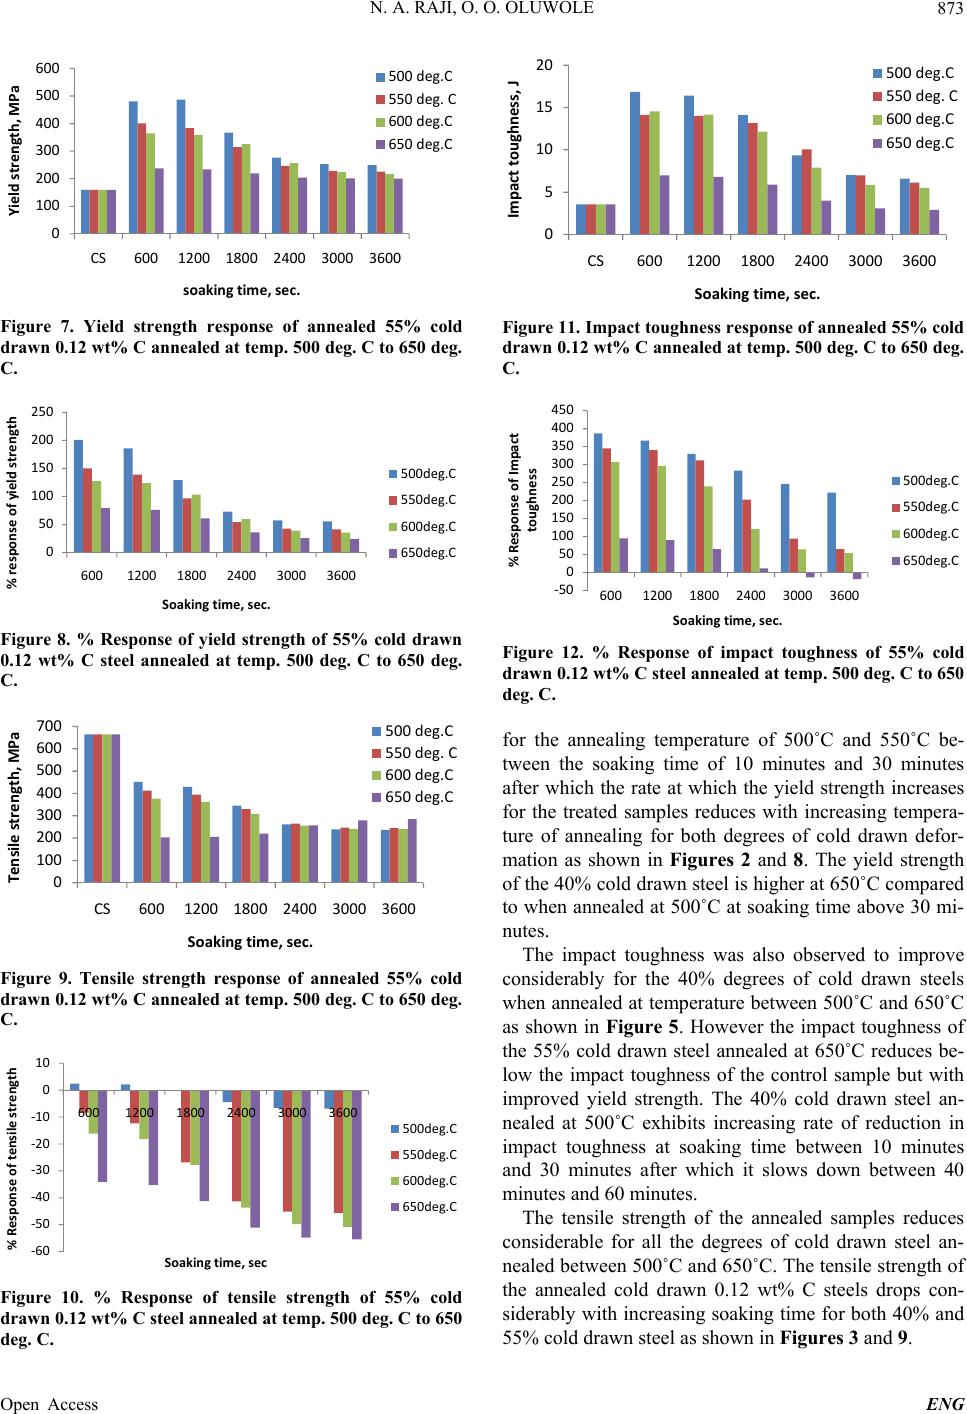 N. A. RAJI, O. O. OLUWOLE 873 0 100 200 300 400 500 600 CS6001200 1800 2400 3000 3600 Yield strength, MPa soaking time, sec. 500 deg.C 550 deg. C 600 deg.C 650 deg.C Figure 7. Yield strength response of annealed 55% cold drawn 0.12 wt% C annealed at temp. 500 deg. C to 650 deg. C. 0 50 100 150 200 250 6001200 1800 2400 3000 3600 % response of yield strength Soaking time, sec. 500deg.C 550deg.C 600deg.C 650deg.C Figure 8. % Response of yield strength of 55% cold drawn 0.12 wt% C steel annealed at temp. 500 deg. C to 650 deg. C. 0 100 200 300 400 500 600 700 CS60012001800 2400 30003600 Tensile strength, MPa Soaking time, sec. 500 deg.C 550 deg. C 600 deg.C 650 deg.C Figure 9. Tensile strength response of annealed 55% cold drawn 0.12 wt% C annealed at temp. 500 deg. C to 650 deg. C. -60 -50 -40 -30 -20 -10 0 10 6001200 1800 2400 3000 3600 % Response of tensile strength Soaking time, sec 500deg.C 550deg.C 600deg.C 650deg.C Figure 10. % Response of tensile strength of 55% cold drawn 0.12 wt% C steel annealed at temp. 500 deg. C to 650 deg. C. 0 5 10 15 20 CS6001200 1800 2400 3000 3600 Impact toughness, J Soaking time, sec. 500 deg.C 550 deg. C 600 deg.C 650 deg.C Figure 11. Impact toughness response of annealed 55% cold drawn 0.12 wt% C annealed at temp. 500 deg. C to 650 deg. C. -50 0 50 100 150 200 250 300 350 400 450 6001200 1800 2400 3000 3600 % Response of Impact toughness Soaking time, sec. 500deg.C 550deg.C 600deg.C 650deg.C Figure 12. % Response of impact toughness of 55% cold drawn 0.12 wt% C steel annealed at temp. 500 deg. C to 650 deg. C. for the annealing temperature of 500˚C and 550˚C be- tween the soaking time of 10 minutes and 30 minutes after which the rate at which the yield strength increases for the treated samples reduces with increasing tempera- ture of annealing for both degrees of cold drawn defor- mation as shown in Figures 2 and 8. The yield strength of the 40% cold drawn steel is higher at 650˚C compared to when annealed at 500˚C at soaking time above 30 mi- nutes. The impact toughness was also observed to improve considerably for the 40% degrees of cold drawn steels when annealed at temperature between 500˚C and 650˚C as shown in Figure 5. However the impact toughness of the 55% cold drawn steel annealed at 650˚C reduces be- low the impact toughness of the control sample but with improved yield strength. The 40% cold drawn steel an- nealed at 500˚C exhibits increasing rate of reduction in impact toughness at soaking time between 10 minutes and 30 minutes after which it slows down between 40 minutes and 60 minutes. The tensile strength of the annealed samples reduces considerable for all the degrees of cold drawn steel an- nealed between 500˚C and 650˚C. The tensile strength of the annealed cold drawn 0.12 wt% C steels drops con- siderably with increasing soaking time for both 40% and 55% cold drawn steel as shown in Figures 3 and 9. Open Access ENG 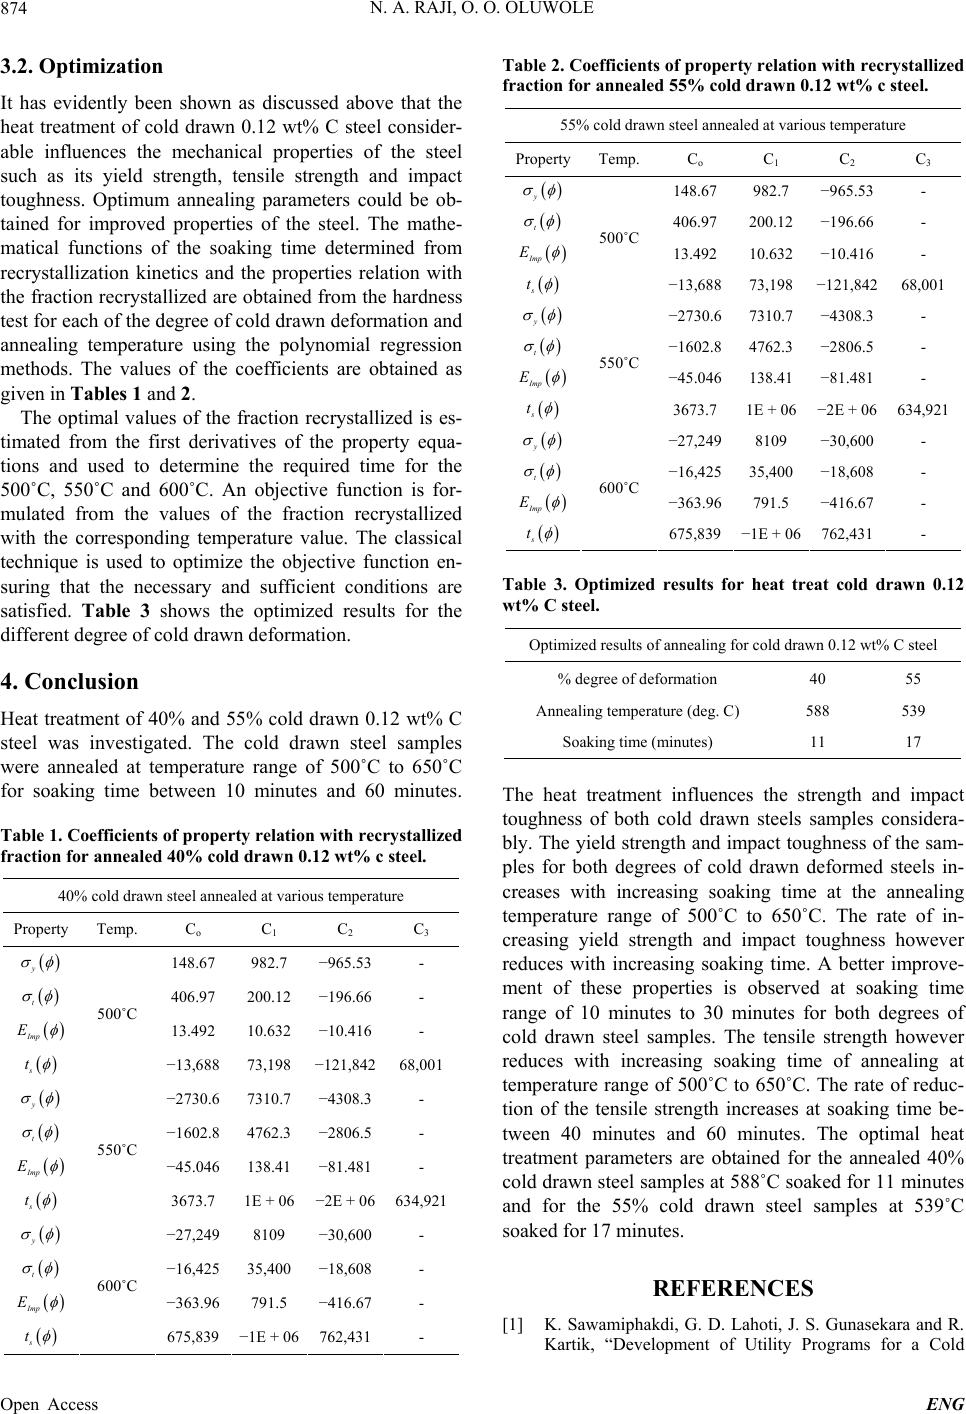 N. A. RAJI, O. O. OLUWOLE 874 3.2. Optimization It has evidently been shown as discussed above that the heat treatment of cold drawn 0.12 wt% C steel consider- able influences the mechanical properties of the steel such as its yield strength, tensile strength and impact toughness. Optimum annealing parameters could be ob- tained for improved properties of the steel. The mathe- matical functions of the soaking time determined from recrystallization kinetics and the properties relation with the fraction recrystallized are obtained from the hardness test for each of the degree of cold drawn deformation and annealing temperature using the polynomial regression methods. The values of the coefficients are obtained as given in Tables 1 and 2. The optimal values of the fraction recrystallized is es- timated from the first derivatives of the property equa- tions and used to determine the required time for the 500˚C, 550˚C and 600˚C. An objective function is for- mulated from the values of the fraction recrystallized with the corresponding temperature value. The classical technique is used to optimize the objective function en- suring that the necessary and sufficient conditions are satisfied. Table 3 shows the optimized results for the different degree of cold drawn deformation. 4. Conclusion Heat treatment of 40% and 55% cold drawn 0.12 wt% C steel was investigated. The cold drawn steel samples were annealed at temperature range of 500˚C to 650˚C for soaking time between 10 minutes and 60 minutes. Table 1. Coefficients of property relation with recrystallized fraction for annealed 40% cold drawn 0.12 wt% c steel. 40% cold drawn steel annealed at various temperature Property Temp. Co C 1 C 2 C 3 y 148.67 982.7 −965.53 - t 406.97 200.12 −196.66 - Imp E 13.492 10.632 −10.416 - s t 500˚C −13,688 73,198 −121,842 68,001 y −2730.6 7310.7 −4308.3 - t −1602.8 4762.3 −2806.5 - Imp E −45.046 138.41 −81.481 - s t 550˚C 3673.7 1E + 06 −2E + 06 634,921 y −27,249 8109 −30,600 - t −16,425 35,400 −18,608 - Imp E −363.96 791.5 −416.67 - s t 600˚C 675,839 −1E + 06 762,431 - Table 2. Coefficients of property relation with recrystallized fraction for annealed 55% cold drawn 0.12 wt% c steel. 55% cold drawn steel annealed at various temperature PropertyTemp. Co C 1 C 2 C 3 y 148.67982.7 −965.53- t 406.97200.12 −196.66- Imp E 13.49210.632 −10.416- s t 500˚C −13,68873,198 −121,842 68,001 y −2730.67310.7 −4308.3- t −1602.84762.3 −2806.5- Imp E −45.046138.41 −81.481- s t 550˚C 3673.71E + 06 −2E + 06634,921 y −27,2498109 −30,600- t −16,42535,400 −18,608- Imp E −363.96791.5 −416.67- s t 600˚C 675,839 −1E + 06 762,431- Table 3. Optimized results for heat treat cold drawn 0.12 wt% C steel. Optimized results of annealing for cold drawn 0.12 wt% C steel % degree of deformation 40 55 Annealing temperature (deg. C) 588 539 Soaking time (minutes) 11 17 The heat treatment influences the strength and impact toughness of both cold drawn steels samples considera- bly. The yield strength and impact toughness of the sam- ples for both degrees of cold drawn deformed steels in- creases with increasing soaking time at the annealing temperature range of 500˚C to 650˚C. The rate of in- creasing yield strength and impact toughness however reduces with increasing soaking time. A better improve- ment of these properties is observed at soaking time range of 10 minutes to 30 minutes for both degrees of cold drawn steel samples. The tensile strength however reduces with increasing soaking time of annealing at temperature range of 500˚C to 650˚C. The rate of reduc- tion of the tensile strength increases at soaking time be- tween 40 minutes and 60 minutes. The optimal heat treatment parameters are obtained for the annealed 40% cold drawn steel samples at 588˚C soaked for 11 minutes and for the 55% cold drawn steel samples at 539˚C soaked for 17 minutes. REFERENCES [1] K. Sawamiphakdi, G. D. Lahoti, J. S. Gunasekara and R. Kartik, “Development of Utility Programs for a Cold Open Access ENG 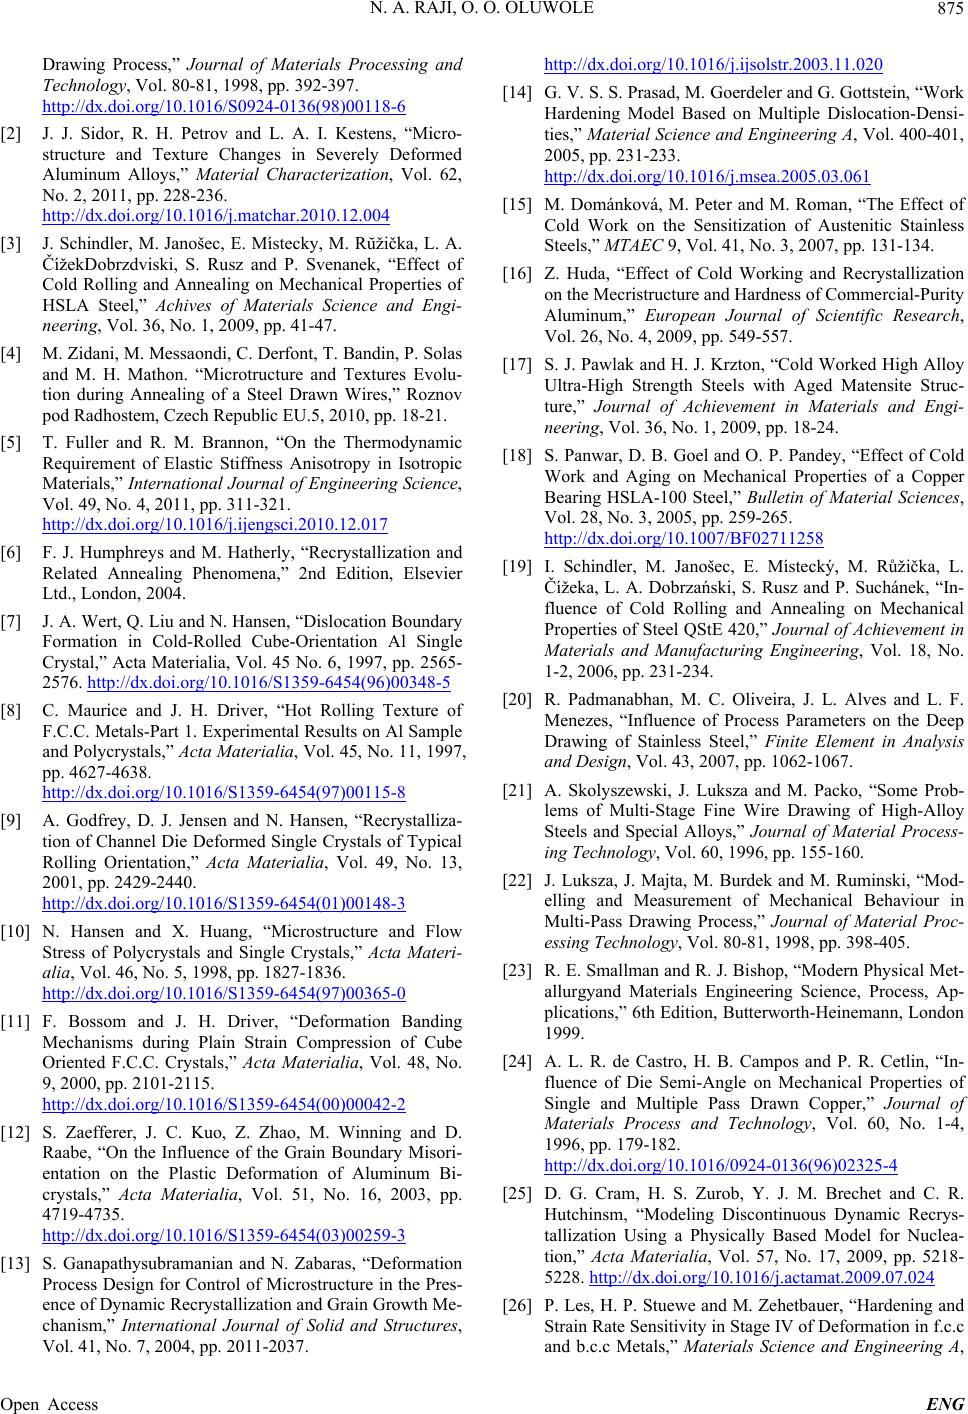 N. A. RAJI, O. O. OLUWOLE 875 Drawing Process,” Journal of Materials Processing and Technology, Vol. 80-81, 1998, pp. 392-397. http://dx.doi.org/10.1016/S0924-0136(98)00118-6 [2] J. J. Sidor, R. H. Petrov and L. A. I. Kestens, “Micro- structure and Texture Changes in Severely Deformed Aluminum Alloys,” Material Characterization, Vol. 62, No. 2, 2011, pp. 228-236. http://dx.doi.org/10.1016/j.matchar.2010.12.004 [3] J. Schindler, M. Janošec, E. Místecky, M. Rŭžička, L. A. ČížekDobrzdviski, S. Rusz and P. Svenanek, “Effect of Cold Rolling and Annealing on Mechanical Properties of HSLA Steel,” Achives of Materials Science and Engi- neering, Vol. 36, No. 1, 2009, pp. 41-47. [4] M. Zidani, M. Messaondi, C. Derfont, T. Bandin, P. Solas and M. H. Mathon. “Microtructure and Textures Evolu- tion during Annealing of a Steel Drawn Wires,” Roznov pod Radhostem, Czech Republic EU.5, 2010, pp. 18-21. [5] T. Fuller and R. M. Brannon, “On the Thermodynamic Requirement of Elastic Stiffness Anisotropy in Isotropic Materials,” International Journal of Engineering Science, Vol. 49, No. 4, 2011, pp. 311-321. http://dx.doi.org/10.1016/j.ijengsci.2010.12.017 [6] F. J. Humphreys and M. Hatherly, “Recrystallization and Related Annealing Phenomena,” 2nd Edition, Elsevier Ltd., London, 2004. [7] J. A. Wert, Q. Liu and N. Hansen, “Dislocation Boundary Formation in Cold-Rolled Cube-Orientation Al Single Crystal,” Acta Materialia, Vol. 45 No. 6, 1997, pp. 2565- 2576. http://dx.doi.org/10.1016/S1359-6454(96)00348-5 [8] C. Maurice and J. H. Driver, “Hot Rolling Texture of F.C.C. Metals-Part 1. Experimental Results on Al Sample and Polycrystals,” Acta Materialia, Vol. 45, No. 11, 1997, pp. 4627-4638. http://dx.doi.org/10.1016/S1359-6454(97)00115-8 [9] A. Godfrey, D. J. Jensen and N. Hansen, “Recrystalliza- tion of Channel Die Deformed Single Crystals of Typical Rolling Orientation,” Acta Materialia, Vol. 49, No. 13, 2001, pp. 2429-2440. http://dx.doi.org/10.1016/S1359-6454(01)00148-3 [10] N. Hansen and X. Huang, “Microstructure and Flow Stress of Polycrystals and Single Crystals,” Acta Materi- alia, Vol. 46, No. 5, 1998, pp. 1827-1836. http://dx.doi.org/10.1016/S1359-6454(97)00365-0 [11] F. Bossom and J. H. Driver, “Deformation Banding Mechanisms during Plain Strain Compression of Cube Oriented F.C.C. Crystals,” Acta Materialia, Vol. 48, No. 9, 2000, pp. 2101-2115. http://dx.doi.org/10.1016/S1359-6454(00)00042-2 [12] S. Zaefferer, J. C. Kuo, Z. Zhao, M. Winning and D. Raabe, “On the Influence of the Grain Boundary Misori- entation on the Plastic Deformation of Aluminum Bi- crystals,” Acta Materialia, Vol. 51, No. 16, 2003, pp. 4719-4735. http://dx.doi.org/10.1016/S1359-6454(03)00259-3 [13] S. Ganapathysubramanian and N. Zabaras, “Deformation Process Design for Control of Microstructure in the Pres- ence of Dynamic Recrystallization and Grain Growth Me- chanism,” International Journal of Solid and Structures, Vol. 41, No. 7, 2004, pp. 2011-2037. http://dx.doi.org/10.1016/j.ijsolstr.2003.11.020 [14] G. V. S. S. Prasad, M. Goerdeler and G. Gottstein, “Work Hardening Model Based on Multiple Dislocation-Densi- ties,” Material Sc ience and Engin eering A, Vol. 400-401, 2005, pp. 231-233. http://dx.doi.org/10.1016/j.msea.2005.03.061 [15] M. Dománková, M. Peter and M. Roman, “The Effect of Cold Work on the Sensitization of Austenitic Stainless Steels,” MTAEC 9, Vol. 41, No. 3, 2007, pp. 131-134. [16] Z. Huda, “Effect of Cold Working and Recrystallization on the Mecristructure and Hardness of Commercial-Purity Aluminum,” European Journal of Scientific Research, Vol. 26, No. 4, 2009, pp. 549-557. [17] S. J. Pawlak and H. J. Krzton, “Cold Worked High Alloy Ultra-High Strength Steels with Aged Matensite Struc- ture,” Journal of Achievement in Materials and Engi- neering, Vol. 36, No. 1, 2009, pp. 18-24. [18] S. Panwar, D. B. Goel and O. P. Pandey, “Effect of Cold Work and Aging on Mechanical Properties of a Copper Bearing HSLA-100 Steel,” Bulletin of Material Sciences, Vol. 28, No. 3, 2005, pp. 259-265. http://dx.doi.org/10.1007/BF02711258 [19] I. Schindler, M. Janošec, E. Místecký, M. Růžička, L. Čížeka, L. A. Dobrzański, S. Rusz and P. Suchánek, “In- fluence of Cold Rolling and Annealing on Mechanical Properties of Steel QStE 420,” Journal of Achievement in Materials and Manufacturing Engineering, Vol. 18, No. 1-2, 2006, pp. 231-234. [20] R. Padmanabhan, M. C. Oliveira, J. L. Alves and L. F. Menezes, “Influence of Process Parameters on the Deep Drawing of Stainless Steel,” Finite Element in Analysis and Design, Vol. 43, 2007, pp. 1062-1067. [21] A. Skolyszewski, J. Luksza and M. Packo, “Some Prob- lems of Multi-Stage Fine Wire Drawing of High-Alloy Steels and Special Alloys,” Journal of Material Process- ing Technology, Vol. 60, 1996, pp. 155-160. [22] J. Luksza, J. Majta, M. Burdek and M. Ruminski, “Mod- elling and Measurement of Mechanical Behaviour in Multi-Pass Drawing Process,” Journal of Material Proc- essing Technology, Vol. 80-81, 1998, pp. 398-405. [23] R. E. Smallman and R. J. Bishop, “Modern Physical Met- allurgyand Materials Engineering Science, Process, Ap- plications,” 6th Edition, Butterworth-Heinemann, London 1999. [24] A. L. R. de Castro, H. B. Campos and P. R. Cetlin, “In- fluence of Die Semi-Angle on Mechanical Properties of Single and Multiple Pass Drawn Copper,” Journal of Materials Process and Technology, Vol. 60, No. 1-4, 1996, pp. 179-182. http://dx.doi.org/10.1016/0924-0136(96)02325-4 [25] D. G. Cram, H. S. Zurob, Y. J. M. Brechet and C. R. Hutchinsm, “Modeling Discontinuous Dynamic Recrys- tallization Using a Physically Based Model for Nuclea- tion,” Acta Materialia, Vol. 57, No. 17, 2009, pp. 5218- 5228. http://dx.doi.org/10.1016/j.actamat.2009.07.024 [26] P. Les, H. P. Stuewe and M. Zehetbauer, “Hardening and Strain Rate Sensitivity in Stage IV of Deformation in f.c.c and b.c.c Metals,” Materials Science and Engineering A, Open Access ENG  N. A. RAJI, O. O. OLUWOLE Open Access ENG 876 Vol. 234-236, 1997, pp. 453-455. http://dx.doi.org/10.1016/S0921-5093(97)00259-1 [27] Y. Estrin, L. S. Tóth, A. Molinari and Y. Chet, “A Dislo- cation-Based Model for all Hardening Stages in Large Strain Deformation,” Acta Materialia, Vol. 46, No. 15, 1998, pp. 5509-5522. http://dx.doi.org/10.1016/S1359-6454(98)00196-7 [28] K. W. K. Yeung, K. M. C. Cheung, W. W. Lua and C. Y. Chung, “Optimization of Thermal Treatment Parameters to Alter Austenitic Phase Transition Temperature of NiTi Alloy for Medical Implant,” Materials Science and Engi- neering A, Vol. 383, No. 2, 2004, pp. 213-218. http://dx.doi.org/10.1016/j.msea.2004.05.063 [29] K. Palaniradja, N. Alagumurthi and V. Soundararajan, “Hardness and Case Depth Analysis through Optimiza- tion Techniques in Surface Hardening Processes,” The Open Materials Science Journal, Vol. 4, 2010, pp. 38-63. http://dx.doi.org/10.2174/1874088X01004030038 [30] R. G. Song and Q. Z. Zhang, “Heat Treatment Optimiza- tion for 7175 Aluminum Alloy by Genetic Algorithm,” Materials Science and Engineering C, Vol. 17, No. 1-2, 2001, pp. 133-137. http://dx.doi.org/10.1016/S0928-4931(01)00321-6 [31] R. G. Song and G. Z. Zhang, “Heat treatment Optimiza- tion for 7175 Aluminum Alloy by Evolutionary Algo- rithm,” Material Science in Engineering C, Vol. 17, No. 1-2, 2001, pp. 139-141. http://dx.doi.org/10.1016/S0928-4931(01)00322-8 [32] R. G. Song and Q. Z. Zhang, “Heat Treatment Optimiza- tion for 7175 Aluminum Alloy by an Artificial Neural Network and Genetic Algorithm,” Journal of Material Processing Technology, Vol. 117, No. 1-2, 2001, pp. 84- 88. http://dx.doi.org/10.1016/S0924-0136(01)01114-1 [33] P. K. Ray, R. I. Gagulu and A. K. Panda, “Optimization of Mechanical Property of a Heat Treated Cu-Bearing HSLA-80 Steel,” Transaction of India Institute of Metals, Vol. 56, No. 2, 2003, pp. 121-129. [34] P. K. Ray, R. I. Gagulu and A. K. Panda, “Optimization of Mechanical Property of HSLA-100 Steel through Con- trol of Heat Treatment Variables,” Material Science in Engineering A, Vol. 346, No. 1-2, 2003, pp. 122-131. http://dx.doi.org/10.1016/S0921-5093(02)00526-9 [35] H. L. Chan, H. H. Ruan, A. Y. Chen and J. Lu, “Optimi- zation of the Strain Rate to Achieve Exceptional Me- chanical Properties of 304 Stainless Steel Using High Speed Ultrasonic Surface Mechanical Attrition Treat- ment,” Acta Materialia, Vol. 58, No. 15, 2010, pp. 5086- 5096. http://dx.doi.org/10.1016/j.actamat.2010.05.044 [36] H. Chen, H. Yu, S. B. Kang, J. H. Cho and G. Min, “Op- timization of Annealing Treatment Parameters in a Twin Roll Cast and Warm Rolled ZK60 Alloy Sheet,” Materi- als Science and Engineering A, Vol. 527, No. 4-5, 2010, pp. 1236-1242. http://dx.doi.org/10.1016/j.msea.2009.09.057 [37] S. C. Harichandand S. Sharma, “Optimization of heat treatment process for 16MnCr5,” International Journal of Engineering Science and Technology, Vol. 4, No. 3, 2012, pp. 998-1004. www.ijest.info/docs/IJEST12-04-03-074.pdf [38] N. A. Raji and O. O. Oluwole, “Effect of Soaking Time on the Mechanical Properties of Annealed Cold-Drawn Low Carbon Steel,” Materials Sciences and Applications, Vol. 3, 2012, pp. 513-518. http://dx.doi.org/10.4236/msa.2012.38072 [39] N. A. Raji and O. O. Oluwole, “Recrystallization Kinetics and Microstructure Evolution of Annealed Cold-Drawn Low-Carbon Steel,” Journal of Crystallization Process and Technology, 2013, Accepted for Publication. |