

Paper Menu >>
Journal Menu >>
 Communications and Network, 2013, 5, 21-24 doi:10.4236/cn.2013.51B006 Published Online February 2013 (http://www.scirp.org/journal/cn) Development of Zigbee W ir eless Temperatur e Monitoring Software System Rongrong Zhang, Xiaoping Zou, Yuan Yang, Changfei Guo Beijing Key Laboratory for Sensor, Beijing Information Science and Technology University, Beijing, China Email: [email protected] Received 2012 ABSTRACT This paper presents a development process of software with Graphic User Interface (GUI) for monitoring temperature in a Zigbee Wireless Network. The software framework design was introduced and analyzed in detail. In this paper, we wrote the software with C++ codes in Microsoft Foundation Class (MFC) programming of Visual C++ 6.0, which ap- plied in wireless communication algorithms. Software test results show that temperature of Zibee network was real-time displayed by both text and curve, which achieved wireless temperature monitoring to Zigbee network. Keywords: GUI; Zigbee Wireless Network; MFC; Communication Algorithms 1. Introduction Zigbee is a new short-range wireless communication technology, which is addressin g to solve the problems of low cost, low power [1], low complexity and low data transmission rate applying in industry control, medical care, office buildings and smart homes. When wireless sensor networks (WSN) building, how to manage a large number of data without errors from the whole system becomes quite essential especially for commercial appli- cations [2] . Our aim is to develop a software system to process sending and receiving of data in Zigbee network by wireless communication technique, which has potential applied in industrial test bed [3]. Throughout the whole software, there are mainly three wireless communication algorithms such as data sending, data receiving and data displaying. In this paper, the design of software frame- work and specific realization algorithms above will be given and discussed in detail. 2. Software Framework The architecture of Zigbee network included hardware system and software system. This paper focused on illus- trating the realization of the management software sys- tem with graphic user interface (GUI) [4]. Monitoring software designed can display temperature of one node in network by both text and curve. Figure 1 is the overall design scheme of the software. Key parts of this software include current temperature zone (named Current Temp), history temperature zone (named HTempText Zone) and the curve display zone. From Current Temp we can gain current temperature of environment in Zigbee network. Temperature curve can be real-time displayed in curve display zone. Y-axis is defined as temperature values and x-axis defined as time. Curve zone can display 60 sec- onds’ temperature. When time exceeding 60s, tempera- ture curve can redisplay from coordinate origin named 0 second by choosing the button named AutoRefresh. Other functional buttons in design are auxiliary to form complete application software. After achieving design of this part, the next procedure is how to change th e design schematic into real software, which can monitor temperature in Zigbee wireless net- work. To finish this part work, Microsoft Visual C++ is a good programming tool for us enough. At last, we wrote all data communication and transmission algorithms for our software with GUI and discussed results of each part. Figure 1. Overall design scheme of the software. Copyright © 2013 SciRes. CN  R. R. ZHANG ET AL. 22 3. Core Algorithms Analysis 3.1. Temperature Text Display The lower computer programming solved the problem of wireless communication while the upper computer pro- gramming solved the problem of data process. This software is based on achieving lower computer pro- gramming with c codes to hardware system in IAR em- bedded workbench by us. To obtain environmental tem- perature when Zigbee wireless network ing built, software must have function for receiving data from coordinator of network. As Figure 2 shown, the program diagram illustrates the whole receiving process of data. String type variable named Temp Value must be defined to save temporary temperature values. When computer buffer existing data, the buffer flag (Buf Flag) will be the num- ber of one which shows that receiving data is enable. Next procedure we wrote function with C++ codes to read data from computer buffer zone and we changed variant type variables in to array type variab les for gettin g data length. Temperature char type variables were saved in safe array (Safe Array) and assigned to Temp Value variable. When all char variables were saved in array, these temperature data can be displayed in software. Figure 3 is the result we achieved from our software. In history text temperature zone (named HTempText- Zone) we can clearly see temperature was displayed by the way of text successfully through this part algorithm. 3.2. Curve Algorithm For observing the trend of temperature change and ob- taining statistics of them, we developed software with GUI to display temperature curve. Curve algorithms with C++ codes were wrote by us in Microsoft Foundation Class (MFC) programming of V isual C++ 6.0 to achieve this part work. Figure 2. Temperature data receiving process. As Figure 4 shown, we wrote temperature curve dis- play function with C++ codes according to RS-232 serial port communication protocol. Temperature data we read by program via RS-232 serial port from computer buffer is string type variable, we must write function with C++ code to convert string type variable into float type vari- able so that we can make further process. The key step is to connect all these temperature points to form curve. Time serial numbers (SN) of receiving data were defined as x-axis while temperature values were defined as y-axis. Having coordinates of data, we can draw points in two-dimensional coordinate system and line all these coordinate points to form curve. This software can show 60 (display one point per second) points of temperature and reach the maximum. To solve this problem of dis- playing data after 60s, we wrote auto refresh function in software to let curve can be redisplayed when exceeding 60s. When time arrives 60s, curve waves were refreshed automatically. Only if we select the button of Auto Re- fresh in software when we use, curve will be redisplayed automatically from 0s and SN will be reset to 0 as well. Figure 5 is the curve algorithm model we designed, which exhibits the real process of curve display. Line “a” is a smooth curve while line b is not. In practice, only discrete points can be processed by computer. When time reached limit, line “b” will be similar to line a in appear- ance which we can’t distinguish by eyes. This part result discussion will be given and analyzed in section 4. Figure 3. The result of temperature text display. Figure 4. Curve algorithm. Copyright © 2013 SciRes. CN  R. R. ZHANG ET AL. Copyright © 2013 SciRes. CN 23 meet this feather. First, we changed string type variable into float type variable for assigning to array variable to save temporarily. Second, K was defined the value of over temperature alarm. When temperature exceeds the K value such as 35℃ or other values, alarm light de- signed in software will change normal green into red. By alarm light we can know more about the temperature in Zigbee network. Result analysis will be given as well in section 4. 4. Software Tests and Results Discussion 4.1. Temperature Curve Figure 7 is software with GUI using in temperature monitoring, which was developed successfully according to the design scheme in Figure 2. There are mainly two parts of the software, which include temperature texts display named HTempText Zone and temperature curve display named Temperature Real-Time Curve Zone. Both history temperature and current temperature can be found in zone named HTempText Zone. Edit box named Current Temp is applied in displaying current tempera- ture for monitorin g. Figure 5. Curve algorithm model. Under normal condition, we tested the software in our laboratory. First, opened software and selected commu- nication port COM 1 and BR (Baud Rate) 57600 (bit/s), and then made Auto Plotting button and Auto Refresh enable in Figure 7. Second, we heated temperature sen- sor module as end device in hardware system with elec- tronic warming tool. Temperature data was displayed automatically by curve in Temperature Real-Time Curve Zone. History temperature and current temperature also can be found in the zone named HTemp Text Zone. Cur- rent Temp zone was specifically used for showing cur- rent temperature. The condition of environment about temperature can be easily observed by using our software. Thus, for achieving monitoring temperature, this soft- ware can be applied in Zigbee network. Figure 6. Over-temperature alarm. 3.3. Alarm Algorithm For surveying environmental temperature limit, setting a threshold value for temperature might be very essential. Figure 6 is the flow chart of over temperature alarm to Figure 7. Software with GUI and test results. 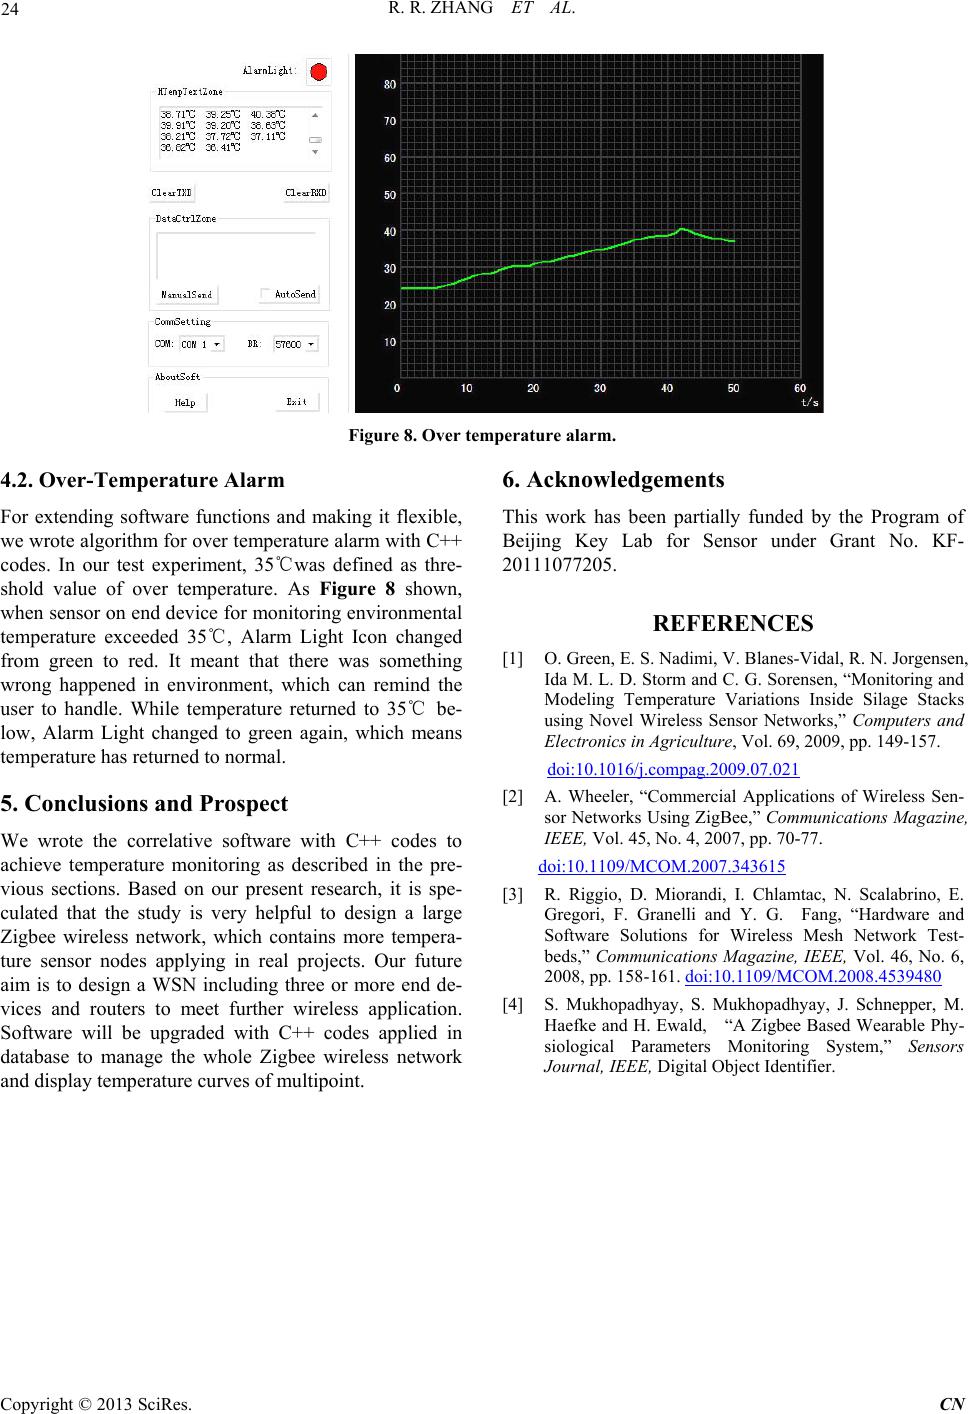 R. R. ZHANG ET AL. 24 Figure 8. Over temperature alarm. 4.2. Over-Temperature Alarm For extending software functions and making it flexible, we wrote algorithm for over temperature alarm with C++ codes. In our test experiment, 35℃was defined as thre- shold value of over temperature. As Figure 8 shown, when sensor on end device for monitoring environmental temperature exceeded 35℃, Alarm Light Icon changed from green to red. It meant that there was something wrong happened in environment, which can remind the user to handle. While temperature returned to 35℃ be- low, Alarm Light changed to green again, which means temperature has returned to normal. 5. Conclusions and Prospect We wrote the correlative software with C++ codes to achieve temperature monitoring as described in the pre- vious sections. Based on our present research, it is spe- culated that the study is very helpful to design a large Zigbee wireless network, which contains more tempera- ture sensor nodes applying in real projects. Our future aim is to design a WSN including three or more end de- vices and routers to meet further wireless application. Software will be upgraded with C++ codes applied in database to manage the whole Zigbee wireless network and display temperature curves of multipoint. 6. Acknowledgements This work has been partially funded by the Program of Beijing Key Lab for Sensor under Grant No. KF- 20111077205. REFERENCES [1] O. Green, E. S. Nadimi, V. Blanes-Vidal, R. N. Jorgensen, Ida M. L. D. Storm and C. G. Sorensen, “Monitoring and Modeling Temperature Variations Inside Silage Stacks using Novel Wireless Sensor Networks,” Computers and Electronics in Agriculture, Vol. 69, 2009, pp. 149-157. doi:10.1016/j.compag.2009.07.021 [2] A. Wheeler, “Commercial Applications of Wireless Sen- sor Networks Using ZigBee,” Communications Magazine, IEEE, Vol. 45, No. 4, 2007, pp. 70-77. doi:10.1109/MCOM.2007.343615 [3] R. Riggio, D. Miorandi, I. Chlamtac, N. Scalabrino, E. Gregori, F. Granelli and Y. G. Fang, “Hardware and Software Solutions for Wireless Mesh Network Test- beds,” Communications Magazine, IEEE, Vol. 46, No. 6, 2008, pp. 158-161. doi:10.1109/MCOM.2008.4539480 [4] S. Mukhopadhyay, S. Mukhopadhyay, J. Schnepper, M. Haefke and H. Ewald, “A Zigbee Based Wearable Phy- siological Parameters Monitoring System,” Sensors Journal, IEEE, Digital Object Identifier. Copyright © 2013 SciRes. CN |