

Paper Menu >>
Journal Menu >>
 Vol.4, No.9B, 51-55 (2013) Agricultural Sci ences http://dx.doi.org/10.4236/as.2013.49B009 Copyright © 2013 SciRes. OPEN A CCESS Integratio n of p hy s ic al a nd chemical t re a tm e nt on th e extraction of starch from Canna edulis Ker. rhizome Judy R. B. Witono*, Herry Santoso, Y. I. P. Arry Miryanti, Daniel Tan Chemical Engineering Department, Parahyangan Catholic University, Bandung, Indonesia; *Corresponding Author: [email protected] Received August 2013 ABSTRACT The extraction of Canna edulis Ker. starch from its rhizome was performed using 2 different types of press (hy draulic press and scre w press) and with the addition of Na-metabisulphite and NaOH (in the range of concentration 100 - 5000 ppm each). The optimum condition for this process was determined by Central Composite Design of experiment and the statistical calcula- tion was solved by Design-Expert 7.0.0. The targets of the observed responses were high starch yield, low ash, low fiber, and high carbo- hydrate content. The results showed that the starch yield and the reduction of fiber were only influenced by the physical treatment whereas ash content in the product was influenced by both the NaOH concentration and physical treat- ment. The carbohydrate content in the extrac- tion product was affected by NaOH, by the inte- raction bet ween the concentrations of NaOH and Na2S2O5 and also by the physical treatment. The hydraulic press gives much better responses compared to the screw press. But in the se- lected range of additives concentrations, the screw press gives a higher starch yield (30% - 52%). Keywords: Canna edulis Ker.; Central Composite Design of Experim ent ; Hydraulic Press; Screw Press; Starch Extraction 1. INTRODUCTION One of the tropical starch resources which have not been utilized for industrial application is Canna edulis Ker. rhizome, partly because of the difficulties in the extraction processing [1]. The high content of fiber and other trace elements are a major constraint in producing pure starch. A sample of 100 g of Canna edulis rhizome contains 125 mg phosphorus (P), 84 mg calcium (Ca) and 1.5 mg iron (Fe) mineral [2]. The presence of those ele- ments in food products can be categorized as a nutritional value but it will be a disadvantage for a chemical starch- based pr od uc t. Salt solutions like NaCl, Na-bisulphite, and Na-meta- bisulphite are commonly used during extraction of starch from its natural source, to inhibit microbial growth and deactivate plant enzyme (amylase). The salt solution can dissolve the surface starch granule protein as well, but for the breakdown of the integral starch granule protein, stronger solutions are required, e.g. sodium dodecyl sul- phate (SDS) [3 ,4] or alkaline solutions [5]. Lim et al. [6] have investigated that the use of 0.2% of NaOH as an extraction solution for rice starch could re- duce more than 80% of the flour protein. This was con- firmed also by Radosavljevic et al. [7] on the extraction of Amaranth starch; Mistry et al. [8] on the extraction of corn flour using 0.1% and 0.4% of NaOH. It was inves- tigated also that sodium hydroxide (NaOH) can remove phosphorus up to 70% - 90% fr om wheat starch [9]. Since the properties of starch are, to some extent, dif- ferent from the fiber (cellulose), a relatively low cost method for isolation of the starch is physical treatment. The goal of the research reported here is to determine the optimum condition of the integration of physical and chemical treatments in producing pure starch. For this purpose, a Central Composite Experimental Design me- thod (CCD) was applied, statistical calculations were made using Design expert 7.0.0 soft wa re. 2. MATERIALS & METHODS 2.1. Materials Freshly harvested Canna edulis Ker. rhizome (locally known as Ganyong) was supplied by the farmers union “Mekar Sari” at the Kulon Progo region (Central Java) Indonesia . Analytical grade of sodium metabisulphite and NaOH were purchased from Sigma Aldrich. α-amy- lase was supplied by N o voz yme and Anthrone rea gent by Merck.  J. R. B. Witono et al. / A gricultural Sciences 4 (2013) 51-55 Copyright © 2013 SciRes. OPEN A CCESS 52 2.2. Design of the Experiment To determine the optimum condition from 2 numerical factors (the Na-metabisulphite and NaOH concentrations) and 1 categorial factor (type of mechanical treatment or type of press instrument), the Central Composite Design was applied. This results in 26 runs with variations as shown in Table 1. 2.3. Starch Extraction Fresh Canna edulis was peeled and washed, then milled with a cross beater mill. The pulp was mixed with water at a weight ratio 1:10. Half of mixture was filtered with the hydraulic press and the rest with the screw press, to separate the crude fiber. The free crude fiber mixture which consists of the fil- trate from each press was divided into 13 portions that were mixed with different concentrations of Na-metabi- sulphite and NaOH solutions as stated Tab le 1. After 12 hours the precipitated starch was separated from the liq- uor and dried in a tray drier for about 12 hours at 45˚C until constant weight. The dried starch was kept in closed containers to be analyzed further. Table 1. Overview of experimental runs. Factor 1 Factor 2 Factor 3 Run [Na2S2O5] [NaOH] Type of treatment* ppm ppm 1 2550 2550 Level 2 2 2550 2550 Level 2 3 100 100 Level 2 4 2550 2550 Level 1 5 2550 2550 Level 2 6 5000 100 Level 2 7 100 5000 Level 1 8 2550 2550 Level 2 9 5000 5000 Level 2 10 5000 5000 Level 1 11 2550 2550 Level 1 12 100 2550 Level 1 13 100 2550 Level 2 14 2550 2550 Level 1 15 5000 2550 Level 1 16 5000 2550 Level 2 17 2550 2550 Level 1 18 2550 2550 Level 1 19 2550 5000 Level 2 20 2550 2550 Level 2 21 100 5000 Level 2 22 100 100 Level 1 23 2550 100 Level 1 24 2550 5000 Level 1 25 2550 100 Level 2 26 5000 100 Level 1 *Level 1—hydraulic press and level 2—screw press. 2.4. Fiber Content The fiber content was measured by heating a mixture of 5 g of starch and 50 mL of water until 90˚C. Then 4 mL of α-amylase enzyme was added and the total was kept at 90˚C for a further 30 minutes. After that 50 mL of water was added and the sample was cooled to room temperature. This method was based on the characteristic property of the α-amylase enzyme which degrades carbohydrates to produce shorter chain molecules such as glucose, which is soluble in water. The cooled mixture was filtered using Whatman 42 filter paper under vacuum conditions to separate the fine fiber. The Fiber content (FC) was cal- culated using Eq.1. ( ) 1 2 w FC %=100% w× (1 ) Where w1 is the weight of fine fiber and w2 is the weight of starch sample (dry basis). 2.5. Ash Content Ash content measurement was also based on a gravi- metric technique. 1 g of star ch sample was combusted in a furnace at 600˚C for 1 hour then cooled in desiccator and weight. This step was repeated until the weight was constant. Ash content (AC) was calculated using Eq.2. ( ) 3 4 w AC %=100 w× (2) Where w3 is the weight of ash and w4 is the weight of starch sample (dry basis). 2.6. Carbohydrate Content The carbohydrate content was analyzed by anthrone reagent [10]. The anthrone method was started by mak- ing a standard graph which was made by diluting 10 mg of glucose into 100 mL of water. The standards solution was taken 0, 0.2, 0.4, 0.6, 0.8 and 1 mL (0 serves as blank) and made up to 1 mL with distilled water. Then 4 mL of anthrone reagent was added. Anthrone reagent was made by diluting 200 mg anth- rone in 100 mL of ice-cold 95% H2SO4. All of the stan- dard solutions were heated for eight minutes in a boiling water bath and then cooled rapidly. Carbohydrate content was measured with a spectrophotometer at 595 nm wa- velength. A calibration graph was made by plotting con- centrations of the standard solution on the X-axis against and the absorbance on the Y-axis. Starch must be hydrolyzed prior to the treatment with anthrone solution. Therefore, 100 mg of a sample of starch with 5 mL of 2.5 N HCl added, was boiled in a water bath for three hours. When sample temperature  J. R. B. Witono et al. / A gricultural Sciences 4 (2013) 51-55 Copyright © 2013 SciRes. O PEN A CCESS 53 was back to room temperature, it was neutralized with solid sodium carbonate (Na2CO3) until the effervescence ceases. The solution was then made up to 100 mL and centrifuged and 0.1 mL of the supernatant was used for analysis. The rest of the procedure is the same for the standard solution. The amount of carbohydrate (CC) in the sample tube was then calculated from the absorbance in the spectrophotometer and the calibration graph by Eq.3. ( ) [ ] 5 0.9C 1000 CC %=100 w ×× × (3) where [C] is the glucose concentration measured from the calibration graph whereas w5 is the weight of starch sample (dry basis). 2.7. Starch Yi eld Starch yield was measured by comparing the weight of obtained starch (dry basis.) with the weight of dry matter sample (Canna edulis rhizome). The starch has been free from dirt 100. Starch Yield (SY) was determined by Eq.4. ( ) 6 7 w SY %=100 w× (4) where w6 is the weight starch (d.b.) whereas w7 is the weight of the dry matter original sample. 3. RESULTS AND DISCUSSION The analysis results from every run can be seen in Ta- ble 2. 3.1. Starch Yi eld Based on the ANOVA of the values obtained for the starch yield (Table 3) it can be seen that the additives concentrations, both Na2S2O5 and NaOH do not affect the yield of starch. This is also proved by the probability value (P value) from both additives which are above 0.005. The yield obtained is apparently more determined by the method of physical treatment. Between the two types of press used, the higher starch yield was found when the screw press was used for se- paration (30% - 52%) compared to the hydraulic press (25% - 41%). However, this fraction contains 79% ± 6% carbohydrate which is slightly lower than the product from the hydraulic press 82% ± 8%). 3.2. Carbohydrate Content Based on the ANOVA of carbohydrate content (Table 4) it can be seen that the NaOH concentration and the interaction between the concentrations of Na2S2O5- NaOH affect the amount of carbohydrate obtained. Since Table 2. Results of the experimental runs. Run Fiber Ash Carbohydrate Yield % % % % 1 3.7 4.0 76.0 14.1 2 2.4 1.9 76.4 33.7 3 2.9 0.7 76.9 49.7 4 1.6 1.0 82.2 35.0 5 3.3 1.5 82.0 40.7 6 2.7 1.5 74.5 44.0 7 2.0 2.7 88.9 31.7 8 2.6 1.6 82.1 40.9 9 3.8 3.8 92.0 64.9 10 2.4 3.5 88.7 47.0 11 1.9 1.3 94.0 31.5 12 2.5 1.3 81.3 35.1 13 3.2 2.0 82.3 43.2 14 2.3 2.9 76.7 25.2 15 2.8 1.7 73.8 33.9 16 3.2 2.3 77.0 57.6 17 2.5 1.2 74.2 35.0 18 2.9 3.0 81.1 11.1 19 2.7 4.3 66.5 30.0 20 2.7 2.7 81.8 34.6 21 3.2 3.6 75.4 45.7 22 1.4 0.4 82.7 39.0 23 2.6 0.5 78.7 37.4 24 2.4 2.6 93.6 30.4 25 3.2 1.0 77.7 39.2 26 1.4 0.7 65.1 38.7 Table 3. ANOVA for starch yield response. Factor SS DF MS F Value p-Value [Na2S2O5] 144.47 1 144.47 3.38 0.18 [NaOH] 0.24 1 0.24 2 0.95 Treatment 442.65 1 442.65 3.37E-003 0.02 Tabl e 4. ANOVA for carbohydrate content response. Factor SS DF MS F Value p-Value A:[Na2S2O5] 22.39 1 22.39 0.69 0.42 B:[NaOH] 204.67 1 204.67 6.28 0.02 Treatment 62.86 1 62.86 1.93 0.18 AB 165.91 1 165.91 5.09 0.04 BC 132.74 1 132.74 4.07 0.06 the p-value of BC ≈ 0.05, so it can be predicted that there is a relation between the physical treatment and the addi- tive (NaOH). From Figure 1, it can be seen that at the high concen- tration of Na2S2O5 and the high concentration of NaOH, within the selected ranges of this research the carbohy- drate content reached the maximum value. However, if the 3D surface plot is observed for each physical treatment (Figures 2 and 3), the effect of con- centration of additives on the carbohydrate content gives a different profile. The separation process using the screw  J. R. B. Witono et al. / A gricultural Sciences 4 (2013) 51-55 Copyright © 2013 SciRes. OPEN A CCESS 54 Figure 1. 3D plot of carbohydrate content. Figure 2. 3D surface of carbohydrate content using the hydrau- lic press. Figure 3. 3D surface of carbohydrate content using the screw press. press is slower than the hydraulic press. This results in the need for the higher concentration of Na-metabisul- phite (5000 ppm) to achieve high carbohydrate content as well as to prevent microbial growth in the slurry which can destroy the carbohydrate. This is a different result compared to the hydraulic press in which it is enough to use 100 ppm to gain a high carbohydrate yield. The models resulting from the statistical methods ill u- strate the relation between the carbohydrate content and the significant factors as followed: For the hydraulic press [ ] [ ] [ ] [ ] -3 -3 22 5 -7 22 5 CC = 83.23.710NaSO+1.110NaOH +7.610NaS ONaOH −× × × (5) For the screw press [ ] [ ] [ ] [] -3 -3 22 5 -7 22 5 CC=81.11.310NaSO+1.610 NaOH +7.610NaSONaOH −× × × (6) 3.3. Fiber Content Based on the ANOVA calculations (see Table 5), the additives concentration, both Na2S2O5 and NaOH do not affect the reduction of fiber content. This is also proved by the P values for both additives (>0.05). So, the physi- cal treatment determines the amount of fiber in starch after extraction. This result is the same as for the starch yield. 3.4. Ash Content Ash content shows the presence of inorganic compo- nent in the starch. These can originate from the rhizome, but also from the chemicals added during processing. From the ANOVA calculations (see Table 6) it can be seen that the concentration of NaOH and the physical treatment affect the amount of inorganic material left in the starch. This seems due to the solubility level of Na2S2O5 in water which is hi gher than Na OH. On Figure 4, it is shown that although Na2S2O5 con- centration does not affect the ash content significantly, there is a tendency that the higher concentrations of ad- ditives, both Na2S2O5 and NaOH, result in a higher ash content in the starch. 4. CONCLUSIONS This study showe d that the integration of physical and chemical is a promising technology for the extraction of starch from Canna edulis. It is a relatively simple and low cost pr oc ess and it produces a good quality st a rc h. Tabl e 5. ANOVA for fiber content response. Factor SS DF MS F Value p-Value [Na2S2O5] 0.089 1 0.089 0.41 0.5261 [NaOH] 0.43 1 0.43 2.00 0.1717 treatment 4.54 1 4.54 21.18 0.0001 Tabl e 6. ANOVA for ash content response. Factor SS DF MS F Value p-Value [Na2S2O5] 0.63 1 0.63 1.54 0.2284 [NaOH] 20.18 1 20.18 48.80 <0.0001 Treatment 2.55 1 2.55 6.18 0.0210 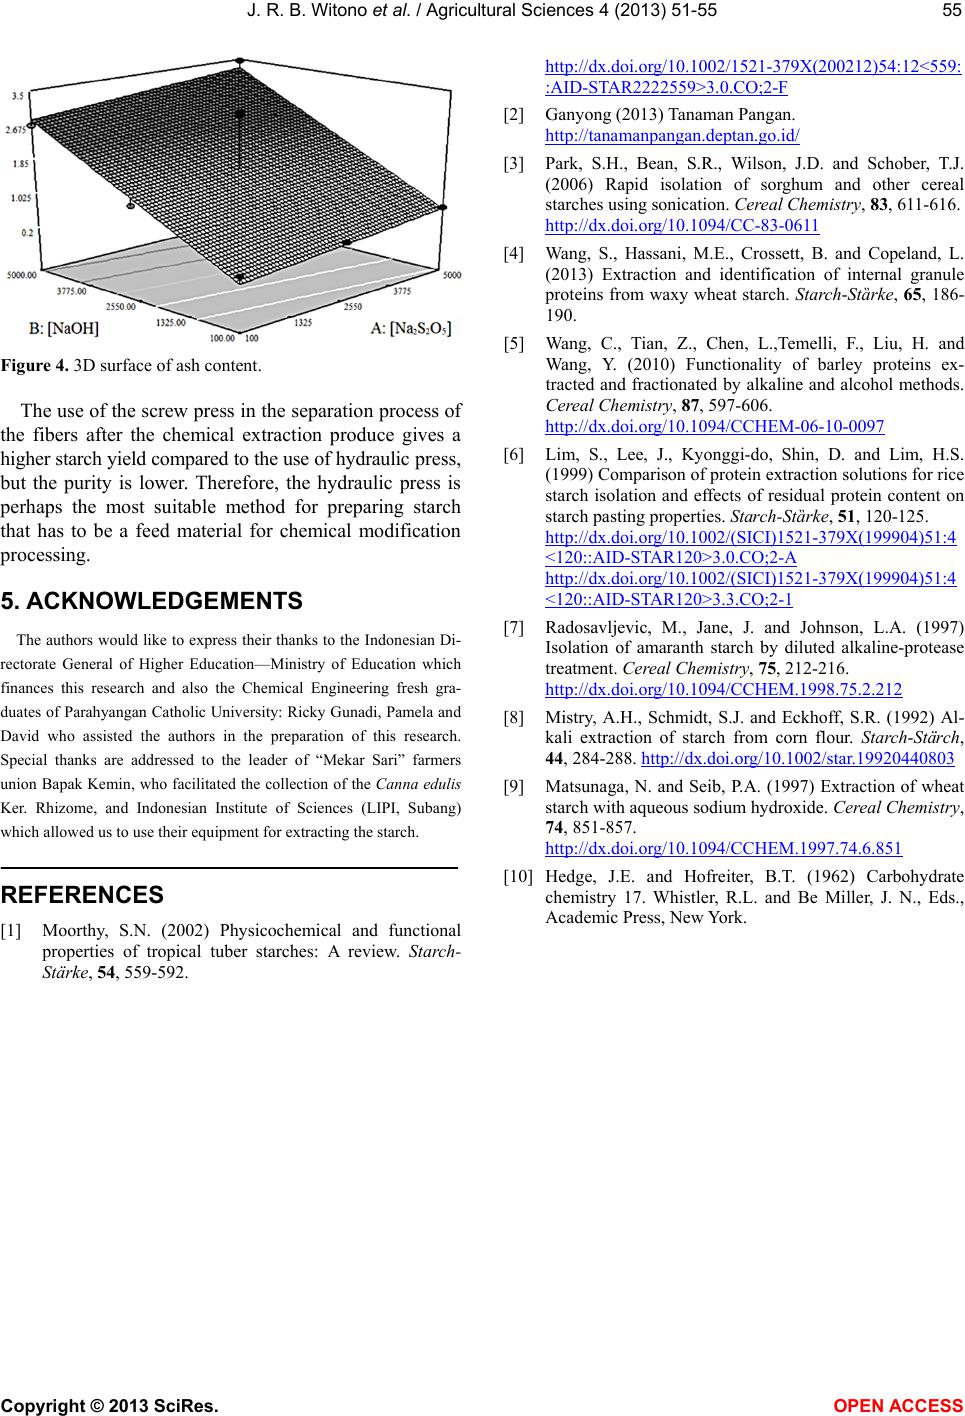 J. R. B. Witono et al. / A gricultural Sciences 4 (2013) 51-55 Copyright © 2013 SciRes. O PEN A CCESS 55 Figure 4. 3D surface of ash content. The use of the screw press in the separation process of the fibers after the chemical extraction produce gives a higher starch yield compared to the use of hydraulic press, but the purity is lower. Therefore, the hydraulic press is perhaps the most suitable method for preparing starch that has to be a feed material for chemical modification processing. 5. ACKNOWLEDGEMENTS The authors would like to express their thanks to the Indonesian Di- rectorate General of Higher Education—Ministry of Education which finances this research and also the Chemical Engineering fresh gra- duates of Parahyangan Cath olic University: Ricky Gunadi, Pamela and David who assisted the authors in the preparation of this research. Special thanks are addressed to the leader of “Mekar Sari” farmers union Bapak Kemin, who facilitated the collection of the Canna edulis Ker. Rhizome, and Indonesian Institute of Sciences (LIPI, Subang) which allowed us to use their equipment for extracting the starch. REFERENCES [1] Moorthy, S.N. (2002) Physicochemical and functional properties of tropical tuber starches: A review. Starch- Stärke, 54, 559-592. http://dx.doi.org/10.1002/1521-379X(200212)54:12<559: :AID-STAR2222559>3.0.CO;2-F [2] Ganyong (2013) Tanaman Pangan. http://tanamanpangan.deptan.go.id/ [3] Park, S.H., Bean, S.R., Wilson, J.D. and Schober, T.J. (2006) Rapid isolation of sorghum and other cereal starches using sonication. Cereal Chemistry, 83, 611-616. http://dx.doi.org/10.1094/CC-83-0611 [4] Wang, S., Hassani, M.E., Crossett, B. and Copeland, L. (2013) Extraction and identification of internal granule proteins from waxy wheat starch. Starch-Stȁrke, 65, 186- 190. [5] Wang, C., Tian, Z., Chen, L.,Temelli, F., Liu, H. and Wang, Y. (2010) Functionality of barley proteins ex- tracted and fractionated by alkaline and alcohol methods. Cereal Chemistry, 87, 597-606. http://dx.doi.org/10.1094/CCHEM-06-10-0097 [6] Lim, S., Lee, J., Kyonggi-do, Shin, D. and Lim, H.S. (1999) Comparison of protein extraction solutions for rice starch isolation and effects of residual protein content on starch pasting properties. Starch-Stȁrke, 51, 120-125. http://dx.doi.org/10.1002/(SICI)1521-379X(199904)51:4 <120::AID-STAR120>3.0.CO;2-A http://dx.doi.org/10.1002/(SICI)1521-379X(199904)51:4 <120::AID-STAR120>3.3.CO;2-1 [7] Radosavljevic, M., Jane, J. and Johnson, L.A. (1997) Isolation of amaranth starch by diluted alkaline-protease treatment. Cereal Chemistry, 75, 212-216. http://dx.doi.org/10.1094/CCHEM.1998.75.2.212 [8] Mistry, A.H., Schmidt, S.J. and Eckhoff, S.R. (1992) Al- kali extraction of starch from corn flour. Starch-Stärc h, 44, 284-288. http://dx.doi.org/10.1002/star.19920440803 [9] Matsunaga, N. and Seib, P.A. (1997) Extraction of wheat starch with a queous sodium hydroxide. Cereal Chemistry, 74, 851-857. http://dx.doi.org/10.1094/CCHEM.1997.74.6.851 [10] Hedge, J.E. and Hofreiter, B.T. (1962) Carbohydrate chemistry 17. Whistler, R.L. and Be Miller, J. N., Eds., Academic Press, New York. |