

Paper Menu >>
Journal Menu >>
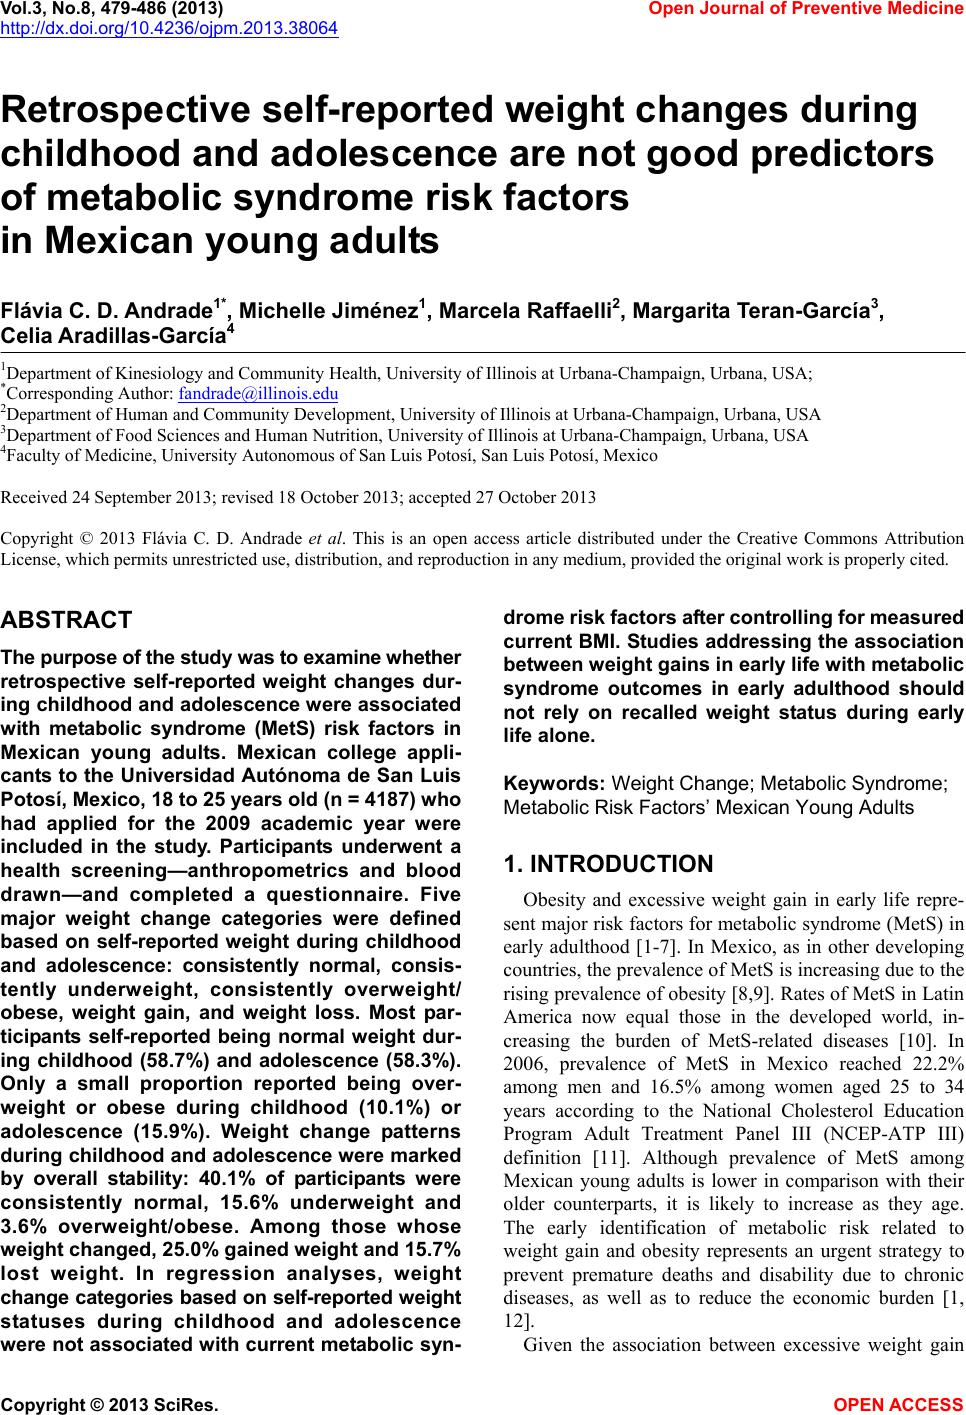 Vol.3, No.8, 479-486 (2013) Open Journal of Preventiv e Me dic ine http://dx.doi.org/10.4236/ojpm.2013.38064 Retrospective self-reported weight changes during childhood and adolescence are not good predictors of metabolic syndrome risk factors in Mexican young adults Flávia C. D. Andrade1*, Michelle Jiménez1, Marcela Raffaelli2, Margarita Teran-García3, Celia Aradillas-García4 1Department of Kinesiology and Community Health, University of Illinois at Urbana-Champaign, Urbana, USA; *Corresponding Author: [email protected] 2Department of Human and Community Development, University of Illinois at Urbana-Champaign, Urbana, USA 3Department of Food Sciences and Human Nutrition, University of Illinois at Urbana-Champaign, Urbana, USA 4Faculty of Medicine, University Autonomous of San Luis Potosí, San Luis Potosí, Mexico Received 24 September 2013; revised 18 October 2013; accepted 27 October 2013 Copyright © 2013 Flávia C. D. Andrade et al. This is an open access article distributed under the Creative Commons Attribution License, which permits unrestricted use, distribution, and reproduction in any medium, provided the original work is properly cited. ABSTRACT The purpose of the study was to examine whether retrospective self-reported weight changes dur- ing childhood and adolescence were associated with metabolic syndrome (MetS) risk factors in Mexican young adults. Mexican college appli- cants to the Universidad Autónoma de San Luis Potosí, Mexico, 18 to 2 5 y ears old (n = 4187 ) who had applied for the 2009 academic year were included in the study. Participants underwent a health screening—anthropometrics and blood drawn—and completed a questionnaire. Five major weight change categories were defined based on self-reported weight during childhood and adolescence: consistently normal, consis- tently underweight, consistently overweight/ obese, weight gain, and weight loss. Most par- ticipants self-reported being normal weight dur- ing childhood (58.7%) and adolescence (58.3%). Only a small proportion reported being over- weight or obese during childhood (10.1%) or adolescence (15.9%). Weight change patterns during childhood and adolescence were marked by overall stability: 40.1% of participants were consistently normal, 15.6% underweight and 3.6% overweight/obese. Among those whose weight changed, 25.0% gained weight and 15.7% lost weight. In regression analyses, weight change categories based on self-repo rted weight statuses during childhood and adolescence were not associated with current metabolic syn- drome risk factors af ter controlling for measured current BMI. Studies addressing the association between weight gains in early life with met abolic syndrome outcomes in early adulthood should not rely on recalled weight status during early life alone. Keywords: Weight Change; Metaboli c Syndrome; Metabolic Risk Factors’ Mexican Youn g Adults 1. INTRODUCTION Obesity and excessive weight gain in early life repre- sent major risk factors for metabolic syndrome (MetS) in early adulthood [1-7]. In Mexico, as in other developing countries, the prevalence of MetS is increasing due to the rising prevalence of obesity [8,9]. Rates of MetS in Latin America now equal those in the developed world, in- creasing the burden of MetS-related diseases [10]. In 2006, prevalence of MetS in Mexico reached 22.2% among men and 16.5% among women aged 25 to 34 years according to the National Cholesterol Education Program Adult Treatment Panel III (NCEP-ATP III) definition [11]. Although prevalence of MetS among Mexican young adults is lower in comparison with their older counterparts, it is likely to increase as they age. The early identification of metabolic risk related to weight gain and obesity represents an urgent strategy to prevent premature deaths and disability due to chronic diseases, as well as to reduce the economic burden [1, 12]. Given the association between excessive weight gain Copyright © 2013 SciRes. OPEN A CCESS 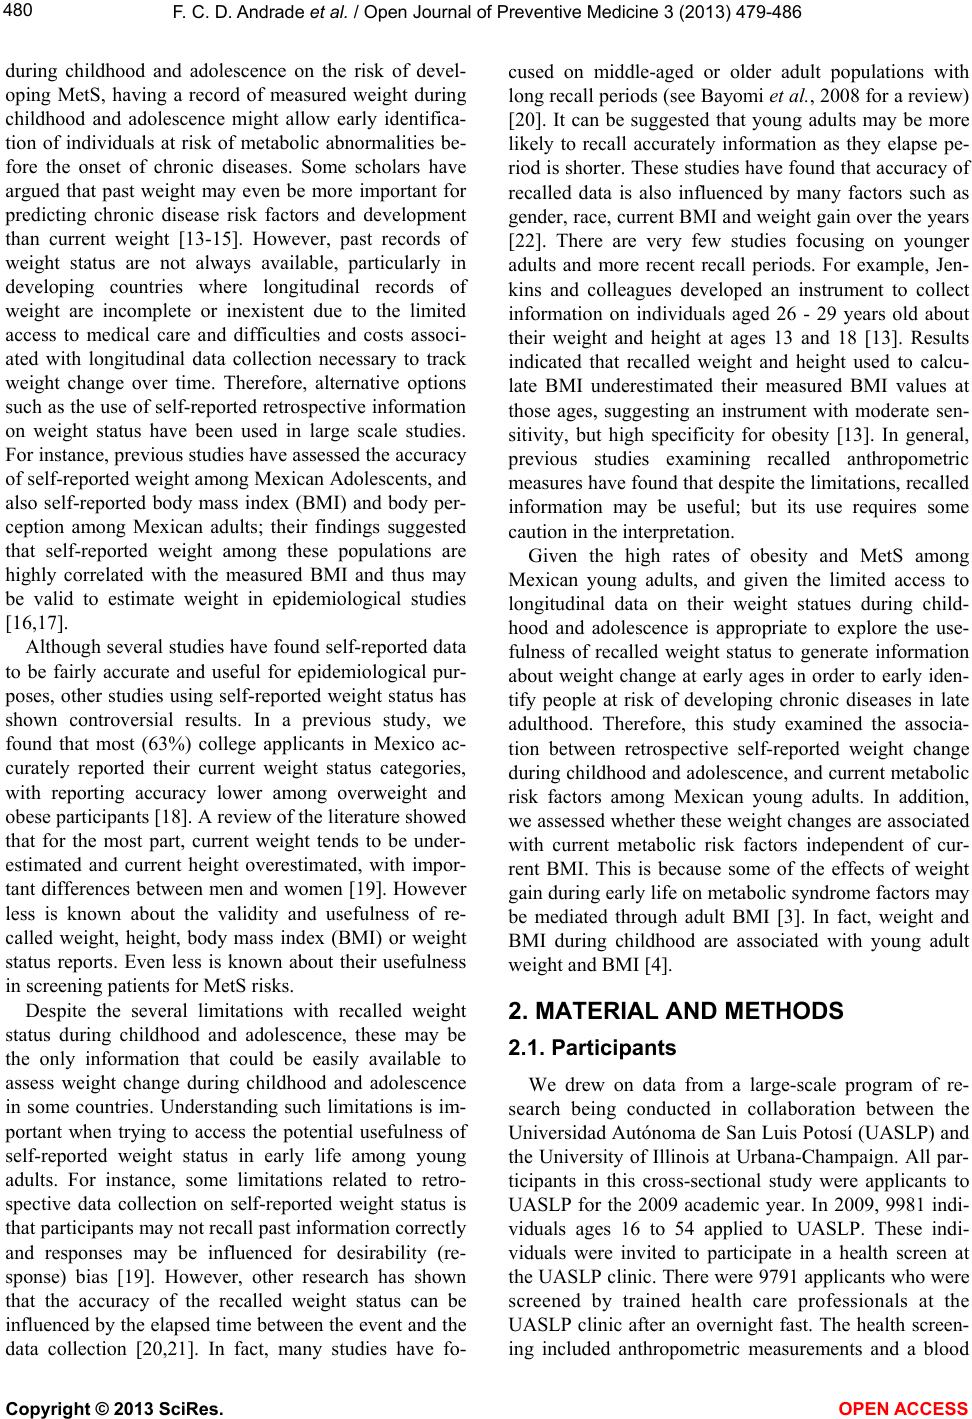 F. C. D. Andrade et al. / Open Journal of Preventive Medicine 3 (2013) 479-486 480 during childhood and adolescence on the risk of devel- oping MetS, having a record of measured weight during childhood and adolescence might allow early identifica- tion of individuals at risk of metabolic abnormalities be- fore the onset of chronic diseases. Some scholars have argued that past weight may even be more important for predicting chronic disease risk factors and development than current weight [13-15]. However, past records of weight status are not always available, particularly in developing countries where longitudinal records of weight are incomplete or inexistent due to the limited access to medical care and difficulties and costs associ- ated with longitudinal data collection necessary to track weight change over time. Therefore, alternative options such as the use of self-reported retrospective information on weight status have been used in large scale studies. For instance, previous studies have assessed the accuracy of self-reported weight among Mexican Adolescents, and also self-reported body mass index (BMI) and body per- ception among Mexican adults; their findings suggested that self-reported weight among these populations are highly correlated with the measured BMI and thus may be valid to estimate weight in epidemiological studies [16,17]. Although several studies have found self-reported data to be fairly accurate and useful for epidemiological pur- poses, other studies using self-reported weight status has shown controversial results. In a previous study, we found that most (63%) college applicants in Mexico ac- curately reported their current weight status categories, with reporting accuracy lower among overweight and obese participants [18]. A review of the literature showed that for the most part, current weight tends to be under- estimated and current height overestimated, with impor- tant differences between men and women [19]. However less is known about the validity and usefulness of re- called weight, height, body mass index (BMI) or weight status reports. Even less is known about their usefulness in screening patients for MetS risks. Despite the several limitations with recalled weight status during childhood and adolescence, these may be the only information that could be easily available to assess weight change during childhood and adolescence in some countries. Understanding such limitations is im- portant when trying to access the potential usefulness of self-reported weight status in early life among young adults. For instance, some limitations related to retro- spective data collection on self-reported weight status is that participants may not recall past information correctly and responses may be influenced for desirability (re- sponse) bias [19]. However, other research has shown that the accuracy of the recalled weight status can be influenced by the elapsed time between the event and the data collection [20,21]. In fact, many studies have fo- cused on middle-aged or older adult populations with long recall periods (see Bayomi et al., 2008 for a review) [20]. It can be suggested that young adults may be more likely to recall accurately information as they elapse pe- riod is shorter. These studies have found that accuracy of recalled data is also influenced by many factors such as gender, race, current BMI and weight gain over the years [22]. There are very few studies focusing on younger adults and more recent recall periods. For example, Jen- kins and colleagues developed an instrument to collect information on individuals aged 26 - 29 years old about their weight and height at ages 13 and 18 [13]. Results indicated that recalled weight and height used to calcu- late BMI underestimated their measured BMI values at those ages, suggesting an instrument with moderate sen- sitivity, but high specificity for obesity [13]. In general, previous studies examining recalled anthropometric measures have found that despite the limitations, recalled information may be useful; but its use requires some caution in the interpretation. Given the high rates of obesity and MetS among Mexican young adults, and given the limited access to longitudinal data on their weight statues during child- hood and adolescence is appropriate to explore the use- fulness of recalled weight status to generate information about weight change at early ages in order to early iden- tify people at risk of developing chronic diseases in late adulthood. Therefore, this study examined the associa- tion between retrospective self-reported weight change during childhood and adolescence, and current metabolic risk factors among Mexican young adults. In addition, we assessed whether these weight changes are associated with current metabolic risk factors independent of cur- rent BMI. This is because some of the effects of weight gain during early life on metabolic syndrome factors may be mediated through adult BMI [3]. In fact, weight and BMI during childhood are associated with young adult weight and BMI [4]. 2. MATERIAL AND METHODS 2.1. Participants We drew on data from a large-scale program of re- search being conducted in collaboration between the Universidad Autónoma de San Luis Potosí (UASLP) and the University of Illinois at Urbana-Champaign. All par- ticipants in this cross-sectional study were applicants to UASLP for the 2009 academic year. In 2009, 9981 indi- viduals ages 16 to 54 applied to UASLP. These indi- viduals were invited to participate in a health screen at the UASLP clinic. There were 9791 applicants who were screened by trained health care professionals at the UASLP clinic after an overnight fast. The health screen- ing included anthropometric measurements and a blood Copyright © 2013 SciRes. OPEN A CCESS 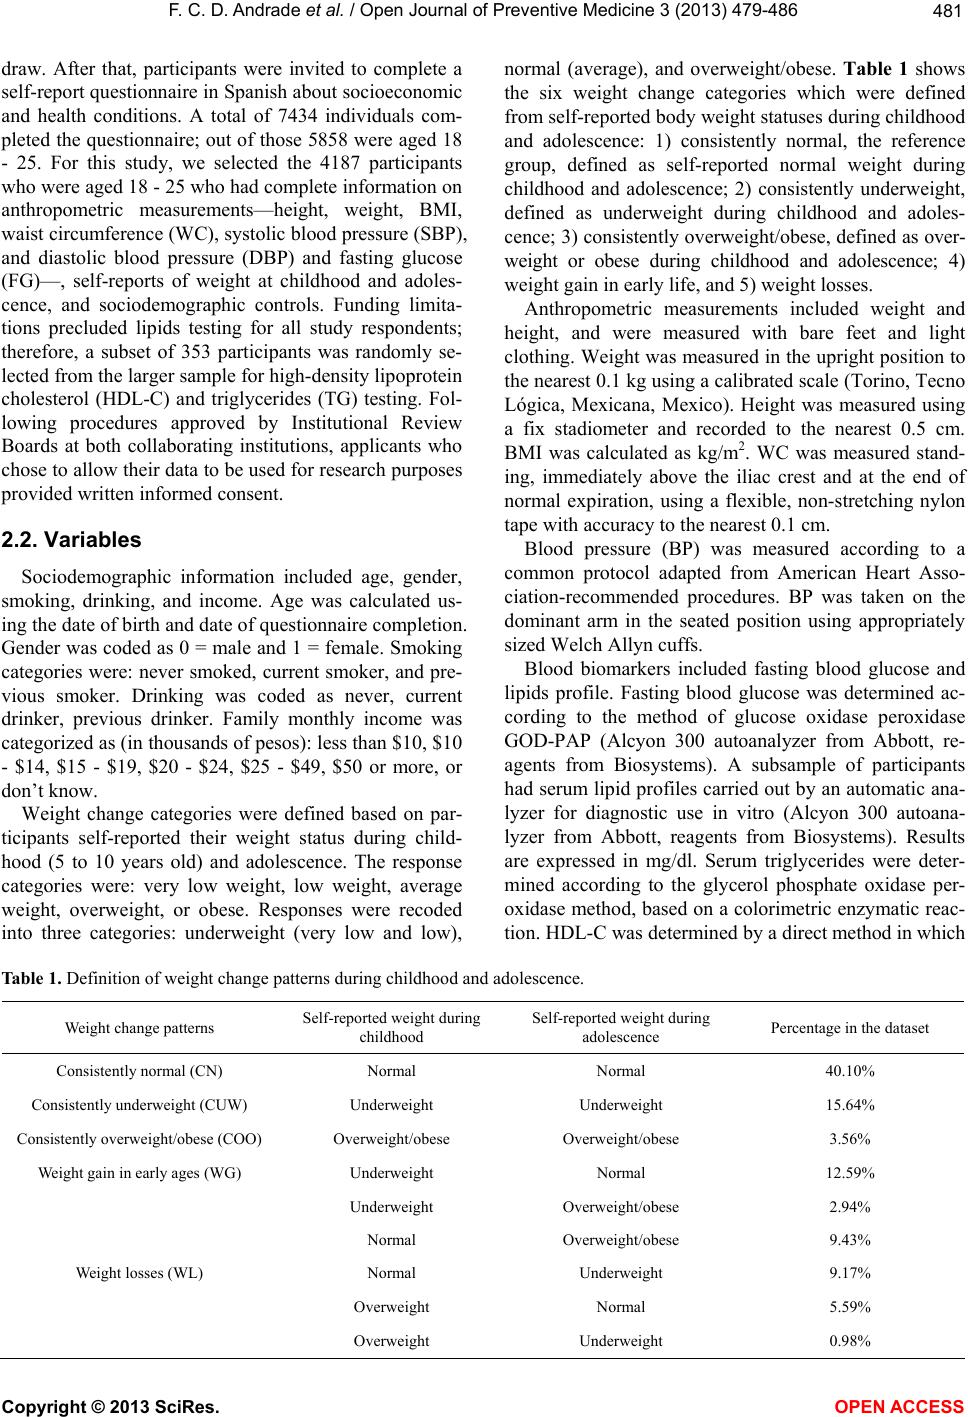 F. C. D. Andrade et al. / Open Journal of Preventive Medicine 3 (2013) 479-486 Copyright © 2013 SciRes. OPEN A CCESS 481 draw. After that, participants were invited to complete a self-report questionnaire in Spanish about socioeconomic and health conditions. A total of 7434 individuals com- pleted the questionnaire; out of those 5858 were aged 18 - 25. For this study, we selected the 4187 participants who were aged 18 - 25 who had complete information on anthropometric measurements—height, weight, BMI, waist circumference (WC), systolic blood pressure (SBP), and diastolic blood pressure (DBP) and fasting glucose (FG)—, self-reports of weight at childhood and adoles- cence, and sociodemographic controls. Funding limita- tions precluded lipids testing for all study respondents; therefore, a subset of 353 participants was randomly se- lected from the larger sample for high-density lipoprotein cholesterol (HDL-C) and triglycerides (TG) testing. Fol- lowing procedures approved by Institutional Review Boards at both collaborating institutions, applicants who chose to allow their data to be used for research purposes provided written informed consent. 2.2. Variables Sociodemographic information included age, gender, smoking, drinking, and income. Age was calculated us- ing the date of birth and date of questionnaire completion. Gender was coded as 0 = male and 1 = female. Smoking categories were: never smoked, current smoker, and pre- vious smoker. Drinking was coded as never, current drinker, previous drinker. Family monthly income was categorized as (in thousands of pesos): less than $10, $10 - $14, $15 - $19, $20 - $24, $25 - $49, $50 or more, or don’t know. Weight change categories were defined based on par- ticipants self-reported their weight status during child- hood (5 to 10 years old) and adolescence. The response categories were: very low weight, low weight, average weight, overweight, or obese. Responses were recoded into three categories: underweight (very low and low), normal (average), and overweight/obese. Table 1 shows the six weight change categories which were defined from self-reported body weight statuses during childhood and adolescence: 1) consistently normal, the reference group, defined as self-reported normal weight during childhood and adolescence; 2) consistently underweight, defined as underweight during childhood and adoles- cence; 3) consistently overweight/obese, defined as over- weight or obese during childhood and adolescence; 4) weight gain in early life, and 5) weight losses. Anthropometric measurements included weight and height, and were measured with bare feet and light clothing. Weight was measured in the upright position to the nearest 0.1 kg using a calibrated scale (Torino, Tecno Lógica, Mexicana, Mexico). Height was measured using a fix stadiometer and recorded to the nearest 0.5 cm. BMI was calculated as kg/m2. WC was measured stand- ing, immediately above the iliac crest and at the end of normal expiration, using a flexible, non-stretching nylon tape with accuracy to the nearest 0.1 cm. Blood pressure (BP) was measured according to a common protocol adapted from American Heart Asso- ciation-recommended procedures. BP was taken on the dominant arm in the seated position using appropriately sized Welch Allyn cuffs. Blood biomarkers included fasting blood glucose and lipids profile. Fasting blood glucose was determined ac- cording to the method of glucose oxidase peroxidase GOD-PAP (Alcyon 300 autoanalyzer from Abbott, re- agents from Biosystems). A subsample of participants had serum lipid profiles carried out by an automatic ana- lyzer for diagnostic use in vitro (Alcyon 300 autoana- lyzer from Abbott, reagents from Biosystems). Results are expressed in mg/dl. Serum triglycerides were deter- mined according to the glycerol phosphate oxidase per- oxidase method, based on a colorimetric enzymatic reac- tion. HDL-C was determined by a direct method in which Table 1. Definition of weight change patterns during childhood and adolescence. Weight change patterns Self-reported weight during childhood Self-reported weight during adolescence Percentage in the dataset Consistently normal (CN) Normal Normal 40.10% Consistently underweight (CUW) Underweight Underweight 15.64% Consistently overweight/obese (COO) Overweight/obese Overweight/obese 3.56% Weight gain in early ages (WG) Underweight Normal 12.59% Underweight Overweight/obese 2.94% Normal Overweight/obese 9.43% Weight losses (WL) Normal Underweight 9.17% Overweight Normal 5.59% Overweight Underweight 0.98% 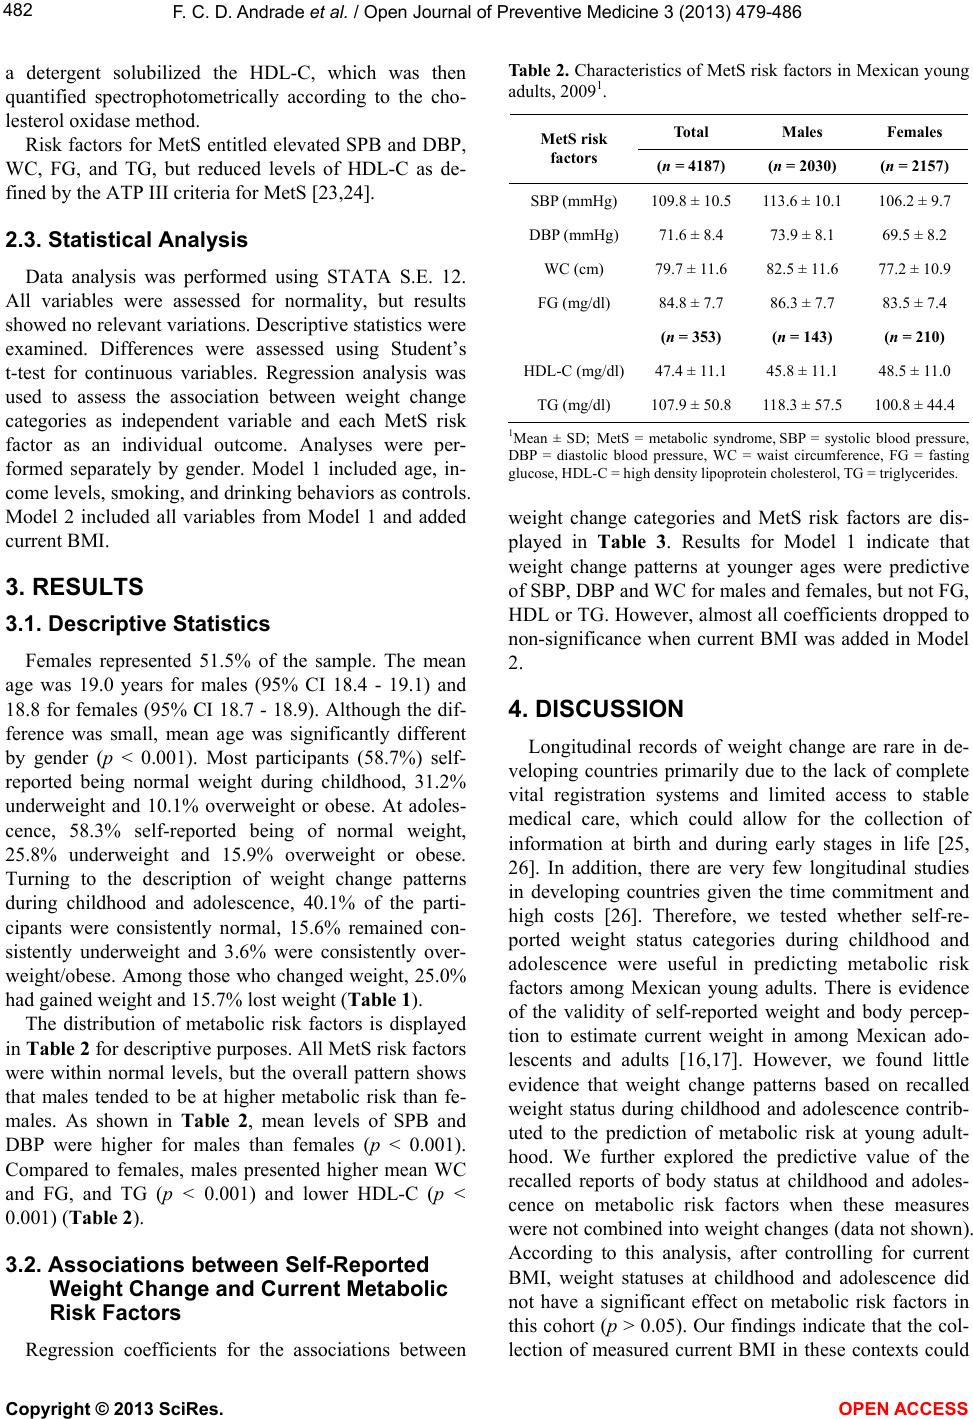 F. C. D. Andrade et al. / Open Journal of Preventive Medicine 3 (2013) 479-486 482 a detergent solubilized the HDL-C, which was then quantified spectrophotometrically according to the cho- lesterol oxidase method. Risk factors for MetS entitled elevated SPB and DBP, WC, FG, and TG, but reduced levels of HDL-C as de- fined by the ATP III criteria for MetS [23,24]. 2.3. Statistical Analysis Data analysis was performed using STATA S.E. 12. All variables were assessed for normality, but results showed no relevant variations. Descriptive statistics were examined. Differences were assessed using Student’s t-test for continuous variables. Regression analysis was used to assess the association between weight change categories as independent variable and each MetS risk factor as an individual outcome. Analyses were per- formed separately by gender. Model 1 included age, in- come levels, smoking, and drinking behaviors as controls. Model 2 included all variables from Model 1 and added current BMI. 3. RESULTS 3.1. Descriptive Statistics Females represented 51.5% of the sample. The mean age was 19.0 years for males (95% CI 18.4 - 19.1) and 18.8 for females (95% CI 18.7 - 18.9). Although the dif- ference was small, mean age was significantly different by gender (p < 0.001). Most participants (58.7%) self- reported being normal weight during childhood, 31.2% underweight and 10.1% overweight or obese. At adoles- cence, 58.3% self-reported being of normal weight, 25.8% underweight and 15.9% overweight or obese. Turning to the description of weight change patterns during childhood and adolescence, 40.1% of the parti- cipants were consistently normal, 15.6% remained con- sistently underweight and 3.6% were consistently over- weight/obese. Among those who changed weight, 25.0% had gained weight and 15.7% lost weight (Table 1). The distribution of metabolic risk factors is displayed in Table 2 for descriptive purposes. All MetS risk factors were within normal levels, but the overall pattern shows that males tended to be at higher metabolic risk than fe- males. As shown in Ta ble 2, mean levels of SPB and DBP were higher for males than females (p < 0.001). Compared to females, males presented higher mean WC and FG, and TG (p < 0.001) and lower HDL-C (p < 0.001) (Table 2). 3.2. Associations between Self-Reported Weight Change and Current Metabolic Risk Factors Regression coefficients for the associations between Table 2. Characteristics of MetS risk factors in Mexican young adults, 20091. Total Males Females MetS risk factors (n = 4187) (n = 2030) (n = 2157) SBP (mmHg) 109.8 ± 10.5113.6 ± 10.1 106.2 ± 9.7 DBP (mmHg) 71.6 ± 8.4 73.9 ± 8.1 69.5 ± 8.2 WC (cm) 79.7 ± 11.6 82.5 ± 11.6 77.2 ± 10.9 FG (mg/dl) 84.8 ± 7.7 86.3 ± 7.7 83.5 ± 7.4 (n = 353) (n = 143) (n = 210) HDL-C (mg/dl)47.4 ± 11.1 45.8 ± 11.1 48.5 ± 11.0 TG (mg/dl) 107.9 ± 50.8118.3 ± 57.5 100.8 ± 44.4 1Mean ± SD; MetS = metabolic syndrome, SBP = systolic blood pressure, DBP = diastolic blood pressure, WC = waist circumference, FG = fasting glucose, HDL-C = high density lipoprotein cholesterol, TG = triglycerides. weight change categories and MetS risk factors are dis- played in Table 3. Results for Model 1 indicate that weight change patterns at younger ages were predictive of SBP, DBP and WC for males and females, but not FG, HDL or TG. However, almost all coefficients dropped to non-significance when current BMI was added in Model 2. 4. DISCUSSION Longitudinal records of weight change are rare in de- veloping countries primarily due to the lack of complete vital registration systems and limited access to stable medical care, which could allow for the collection of information at birth and during early stages in life [25, 26]. In addition, there are very few longitudinal studies in developing countries given the time commitment and high costs [26]. Therefore, we tested whether self-re- ported weight status categories during childhood and adolescence were useful in predicting metabolic risk factors among Mexican young adults. There is evidence of the validity of self-reported weight and body percep- tion to estimate current weight in among Mexican ado- lescents and adults [16,17]. However, we found little evidence that weight change patterns based on recalled weight status during childhood and adolescence contrib- uted to the prediction of metabolic risk at young adult- hood. We further explored the predictive value of the recalled reports of body status at childhood and adoles- cence on metabolic risk factors when these measures were not combined into weight changes (data not shown). According to this analysis, after controlling for current BMI, weight statuses at childhood and adolescence did not have a significant effect on metabolic risk factors in this cohort (p > 0.05). Our findings indicate that the col- lection of measured current BMI in these contexts could Copyright © 2013 SciRes. OPEN A CCESS 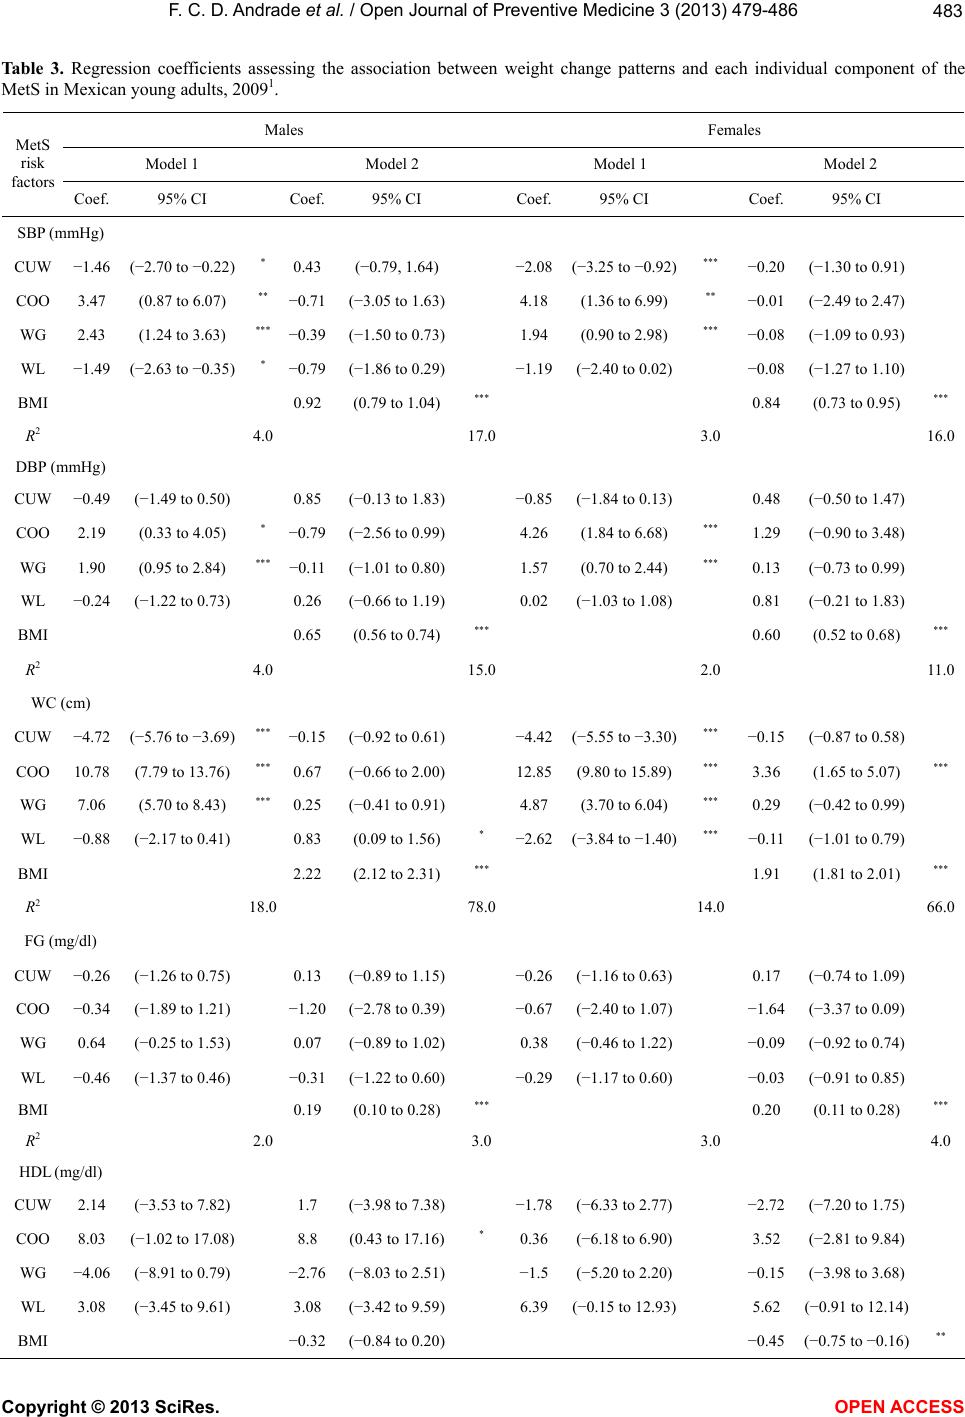 F. C. D. Andrade et al. / Open Journal of Preventive Medicine 3 (2013) 479-486 483 Table 3. Regression coefficients assessing the association between weight change patterns and each individual component of the MetS in Mexican young adults, 20091. Males Females Model 1 Model 2 Model 1 Model 2 MetS risk factors Coef. 95% CI Coef. 95% CI Coef.95% CI Coef. 95% CI SBP (mmHg) CUW −1.46 (−2.70 to −0.22) * 0.43 (−0.79, 1.64) −2.08 (−3.25 to −0.92) *** −0.20 (−1.30 to 0.91) COO 3.47 (0.87 to 6.07) ** −0.71 (−3.05 to 1.63) 4.18 (1.36 to 6.99) ** −0.01 (−2.49 to 2.47) WG 2.43 (1.24 to 3.63) *** −0.39 (−1.50 to 0.73) 1.94 (0.90 to 2.98) *** −0.08 (−1.09 to 0.93) WL −1.49 (−2.63 to −0.35) * −0.79 (−1.86 to 0.29) −1.19 (−2.40 to 0.02) −0.08 (−1.27 to 1.10) BMI 0.92 (0.79 to 1.04) *** 0.84 (0.73 to 0.95) *** R2 4.0 17.0 3.0 16.0 DBP (mmHg) CUW −0.49 (−1.49 to 0.50) 0.85 (−0.13 to 1.83) −0.85 (−1.84 to 0.13) 0.48 (−0.50 to 1.47) COO 2.19 (0.33 to 4.05) * −0.79 (−2.56 to 0.99) 4.26 (1.84 to 6.68) *** 1.29 (−0.90 to 3.48) WG 1.90 (0.95 to 2.84) *** −0.11 (−1.01 to 0.80) 1.57 (0.70 to 2.44) *** 0.13 (−0.73 to 0.99) WL −0.24 (−1.22 to 0.73) 0.26 (−0.66 to 1.19) 0.02 (−1.03 to 1.08) 0.81 (−0.21 to 1.83) BMI 0.65 (0.56 to 0.74) *** 0.60 (0.52 to 0.68) *** R2 4.0 15.0 2.0 11.0 WC (cm) CUW −4.72 (−5.76 to −3.69) *** −0.15 (−0.92 to 0.61) −4.42 (−5.55 to −3.30) *** −0.15 (−0.87 to 0.58) COO 10.78 (7.79 to 13.76) *** 0.67 (−0.66 to 2.00) 12.85(9.80 to 15.89)*** 3.36 (1.65 to 5.07) *** WG 7.06 (5.70 to 8.43) *** 0.25 (−0.41 to 0.91) 4.87 (3.70 to 6.04) *** 0.29 (−0.42 to 0.99) WL −0.88 (−2.17 to 0.41) 0.83 (0.09 to 1.56) * −2.62 (−3.84 to −1.40) *** −0.11 (−1.01 to 0.79) BMI 2.22 (2.12 to 2.31) *** 1.91 (1.81 to 2.01) *** R2 18.0 78.0 14.0 66.0 FG (mg/dl) CUW −0.26 (−1.26 to 0.75) 0.13 (−0.89 to 1.15) −0.26 (−1.16 to 0.63) 0.17 (−0.74 to 1.09) COO −0.34 (−1.89 to 1.21) −1.20 (−2.78 to 0.39) −0.67 (−2.40 to 1.07) −1.64 (−3.37 to 0.09) WG 0.64 (−0.25 to 1.53) 0.07 (−0.89 to 1.02) 0.38 (−0.46 to 1.22) −0.09 (−0.92 to 0.74) WL −0.46 (−1.37 to 0.46) −0.31 (−1.22 to 0.60) −0.29 (−1.17 to 0.60) −0.03 (−0.91 to 0.85) BMI 0.19 (0.10 to 0.28) *** 0.20 (0.11 to 0.28) *** R2 2.0 3.0 3.0 4.0 HDL (mg/dl) CUW 2.14 (−3.53 to 7.82) 1.7 (−3.98 to 7.38) −1.78 (−6.33 to 2.77) −2.72 (−7.20 to 1.75) COO 8.03 (−1.02 to 17.08) 8.8 (0.43 to 17.16)* 0.36 (−6.18 to 6.90) 3.52 (−2.81 to 9.84) WG −4.06 (−8.91 to 0.79) −2.76 (−8.03 to 2.51) −1.5 (−5.20 to 2.20) −0.15 (−3.98 to 3.68) WL 3.08 (−3.45 to 9.61) 3.08 (−3.42 to 9.59) 6.39 (−0.15 to 12.93) 5.62 (−0.91 to 12.14) BMI −0.32 (−0.84 to 0.20) −0.45 (−0.75 to −0.16) ** Copyright © 2013 SciRes. OPEN A CCESS 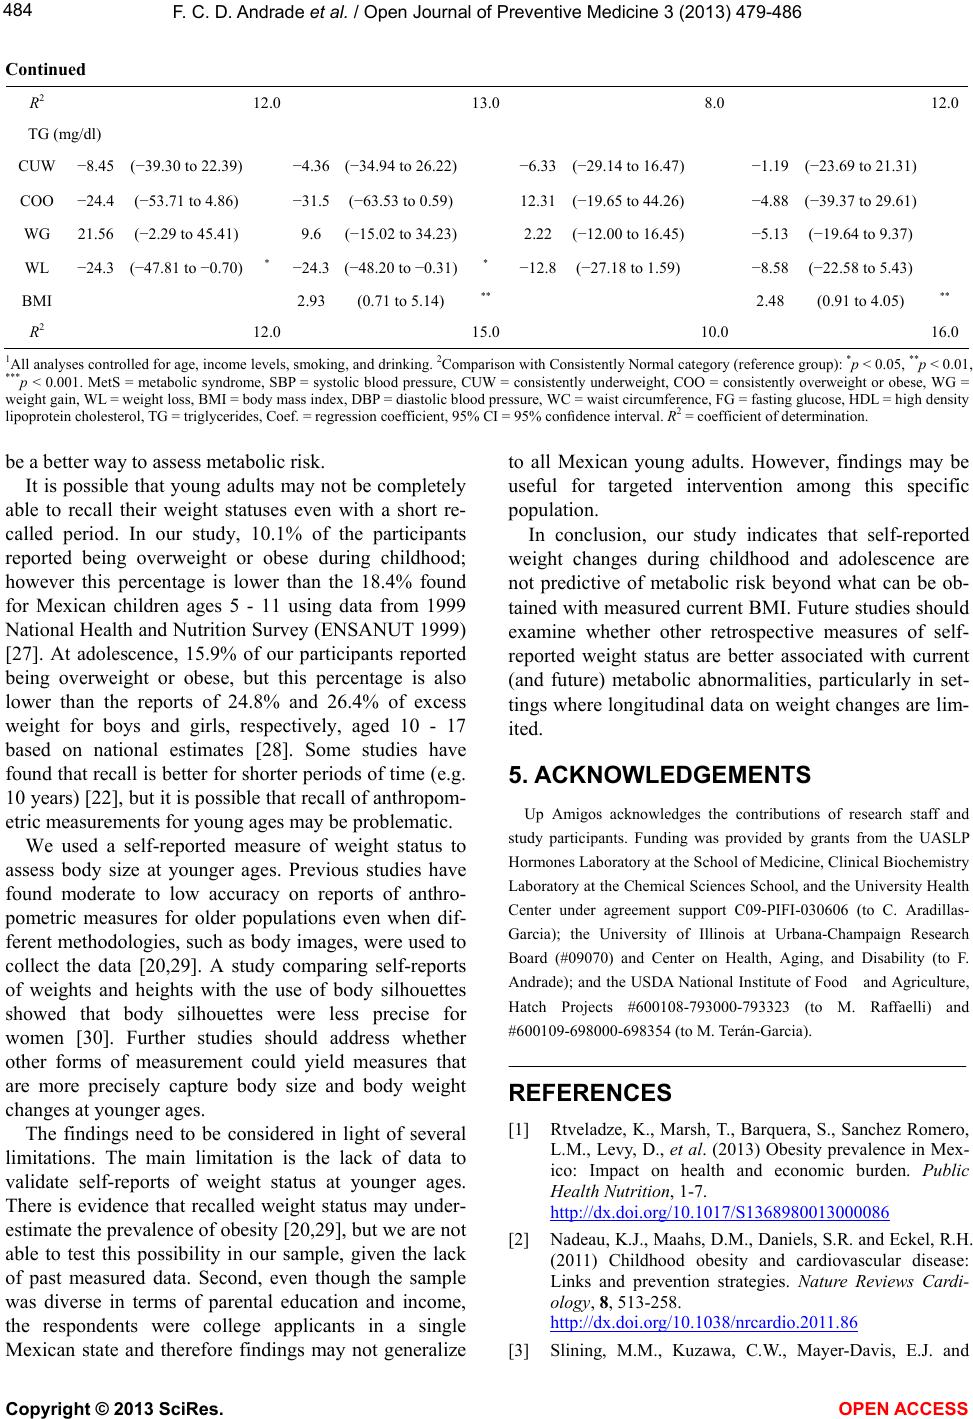 F. C. D. Andrade et al. / Open Journal of Preventive Medicine 3 (2013) 479-486 484 Continued R2 12.0 13.0 8.0 12.0 TG (mg/dl) CUW −8.45 (−39.30 to 22.39) −4.36 (−34.94 to 26.22) −6.33 (−29.14 to 16.47) −1.19 (−23.69 to 21.31) COO −24.4 (−53.71 to 4.86) −31.5 (−63.53 to 0.59) 12.31(−19.65 to 44.26) −4.88 (−39.37 to 29.61) WG 21.56 (−2.29 to 45.41) 9.6 (−15.02 to 34.23) 2.22 (−12.00 to 16.45) −5.13 (−19.64 to 9.37) WL −24.3 (−47.81 to −0.70) * −24.3 (−48.20 to −0.31) * −12.8(−27.18 to 1.59) −8.58 (−22.58 to 5.43) BMI 2.93 (0.71 to 5.14) ** 2.48 (0.91 to 4.05) ** R2 12.0 15.0 10.0 16.0 1All analyses controlled for age, income levels, smoking, and drinking. 2Comparison with Consistently Normal category (reference group): *p < 0.05, **p < 0.01, ***p < 0.001. MetS = metabolic syndrome, SBP = systolic blood pressure, CUW = consistently underweight, COO = consistently overweight or obese, WG = weight gain, WL = weight loss, BMI = body mass index, DBP = diastolic blood pressure, WC = waist circumference, FG = fasting glucose, HDL = high density lipoprotein cholesterol, TG = triglycerides, Coef. = regression coefficient, 95% CI = 95% confidence interval. R2 = coefficient of determination. be a better way to assess metabolic risk. It is possible that young adults may not be completely able to recall their weight statuses even with a short re- called period. In our study, 10.1% of the participants reported being overweight or obese during childhood; however this percentage is lower than the 18.4% found for Mexican children ages 5 - 11 using data from 1999 National Health and Nutrition Survey (ENSANUT 1999) [27]. At adolescence, 15.9% of our participants reported being overweight or obese, but this percentage is also lower than the reports of 24.8% and 26.4% of excess weight for boys and girls, respectively, aged 10 - 17 based on national estimates [28]. Some studies have found that recall is better for shorter periods of time (e.g. 10 years) [22], but it is possible that recall of anthropom- etric measurements for young ages may be problematic. We used a self-reported measure of weight status to assess body size at younger ages. Previous studies have found moderate to low accuracy on reports of anthro- pometric measures for older populations even when dif- ferent methodologies, such as body images, were used to collect the data [20,29]. A study comparing self-reports of weights and heights with the use of body silhouettes showed that body silhouettes were less precise for women [30]. Further studies should address whether other forms of measurement could yield measures that are more precisely capture body size and body weight changes at younger ages. The findings need to be considered in light of several limitations. The main limitation is the lack of data to validate self-reports of weight status at younger ages. There is evidence that recalled weight status may under- estimate the prevalence of obesity [20,29], but we are not able to test this possibility in our sample, given the lack of past measured data. Second, even though the sample was diverse in terms of parental education and income, the respondents were college applicants in a single Mexican state and therefore findings may not generalize to all Mexican young adults. However, findings may be useful for targeted intervention among this specific population. In conclusion, our study indicates that self-reported weight changes during childhood and adolescence are not predictive of metabolic risk beyond what can be ob- tained with measured current BMI. Future studies should examine whether other retrospective measures of self- reported weight status are better associated with current (and future) metabolic abnormalities, particularly in set- tings where longitudinal data on weight changes are lim- ited. 5. ACKNOWLEDGEMENTS Up Amigos acknowledges the contributions of research staff and study participants. Funding was provided by grants from the UASLP Hormones Laboratory at the School of Medicine, Clinical Biochemistry Laboratory at the Chemical Sciences School, and the University Health Center under agreement support C09-PIFI-030606 (to C. Aradillas- Garcia); the University of Illinois at Urbana-Champaign Research Board (#09070) and Center on Health, Aging, and Disability (to F. Andrade); and the USDA National Institute of Food and Agriculture, Hatch Projects #600108-793000-793323 (to M. Raffaelli) and #600109-698000-698354 (to M. Terán-Garcia). REFERENCES [1] Rtveladze, K., Marsh, T., Barquera, S., Sanchez Romero, L.M., Levy, D., et al. (2013) Obesity prevalence in Mex- ico: Impact on health and economic burden. Public Health Nutrition, 1-7. http://dx.doi.org/10.1017/S1368980013000086 [2] Nadeau, K.J., Maahs, D.M., Daniels, S.R. and Eckel, R.H. (2011) Childhood obesity and cardiovascular disease: Links and prevention strategies. Nature Reviews Cardi- ology, 8, 513-258. http://dx.doi.org/10.1038/nrcardio.2011.86 [3] Slining, M.M., Kuzawa, C.W., Mayer-Davis, E.J. and Copyright © 2013 SciRes. OPEN A CCESS 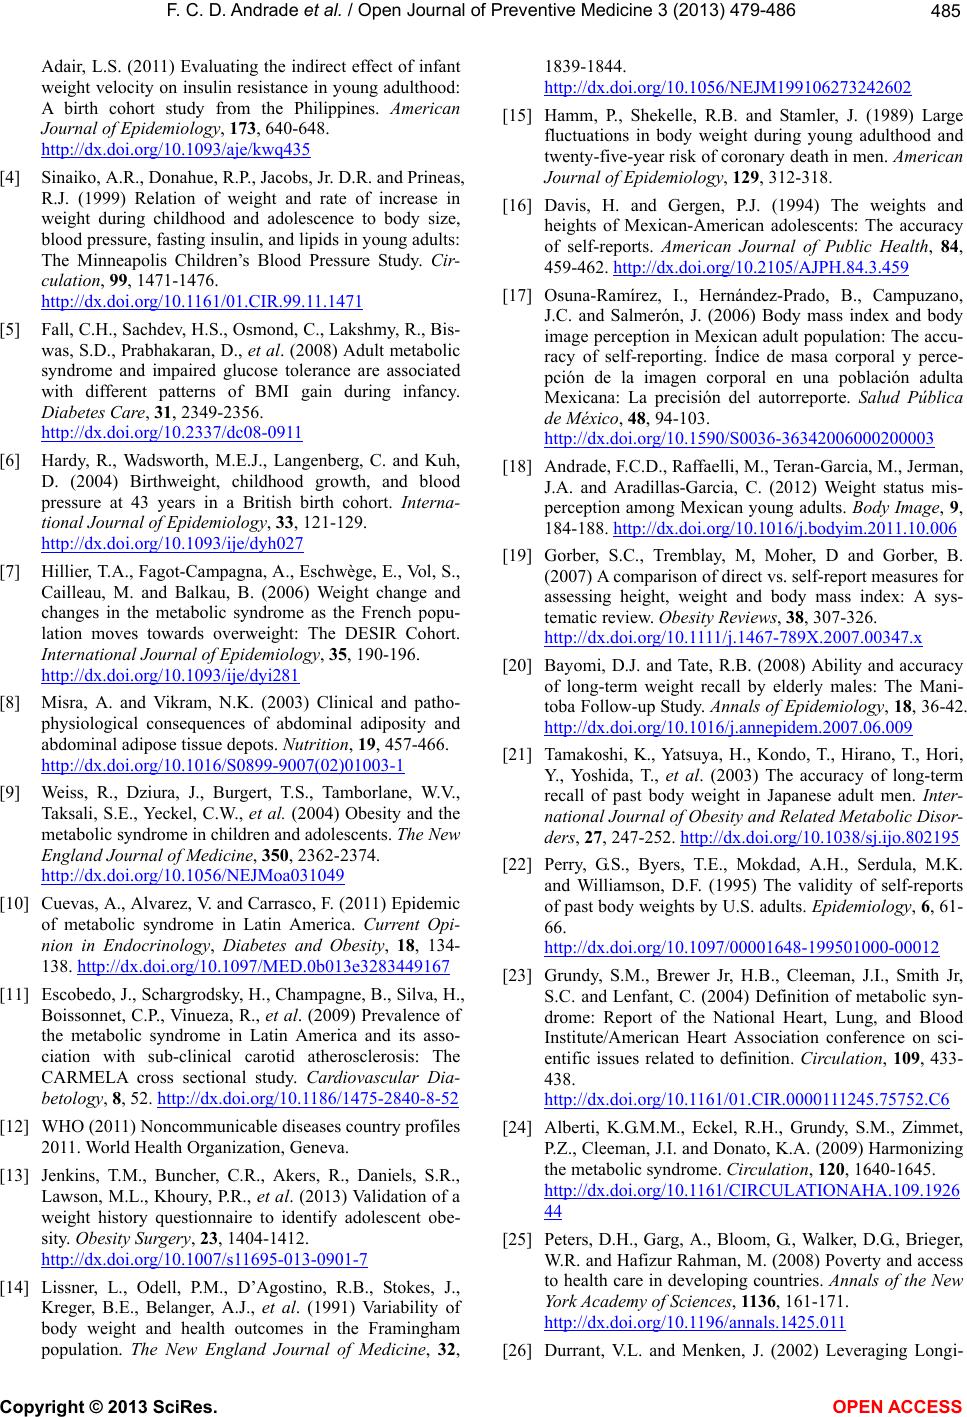 F. C. D. Andrade et al. / Open Journal of Preventive Medicine 3 (2013) 479-486 485 Adair, L.S. (2011) Evaluating the indirect effect of infant weight velocity on insulin resistance in young adulthood: A birth cohort study from the Philippines. American Journal of Epidemiology, 173, 640-648. http://dx.doi.org/10.1093/aje/kwq435 [4] Sinaiko, A.R., Donahue, R.P., Jacobs, Jr. D.R. and Prineas, R.J. (1999) Relation of weight and rate of increase in weight during childhood and adolescence to body size, blood pressure, fasting insulin, and lipids in young adults: The Minneapolis Children’s Blood Pressure Study. Cir- culation, 99, 1471-1476. http://dx.doi.org/10.1161/01.CIR.99.11.1471 [5] Fall, C.H., Sachdev, H.S., Osmond, C., Lakshmy, R., Bis- was, S.D., Prabhakaran, D., et al. (2008) Adult metabolic syndrome and impaired glucose tolerance are associated with different patterns of BMI gain during infancy. Diabetes Care, 31, 2349-2356. http://dx.doi.org/10.2337/dc08-0911 [6] Hardy, R., Wadsworth, M.E.J., Langenberg, C. and Kuh, D. (2004) Birthweight, childhood growth, and blood pressure at 43 years in a British birth cohort. Interna- tional Journal of Epidemiology, 33, 121-129. http://dx.doi.org/10.1093/ije/dyh027 [7] Hillier, T.A., Fagot-Campagna, A., Eschwège, E., Vol, S., Cailleau, M. and Balkau, B. (2006) Weight change and changes in the metabolic syndrome as the French popu- lation moves towards overweight: The DESIR Cohort. International Journal of Epidemiology, 35, 190-196. http://dx.doi.org/10.1093/ije/dyi281 [8] Misra, A. and Vikram, N.K. (2003) Clinical and patho- physiological consequences of abdominal adiposity and abdominal adipose tissue depots. Nutrition, 19, 457-466. http://dx.doi.org/10.1016/S0899-9007(02)01003-1 [9] Weiss, R., Dziura, J., Burgert, T.S., Tamborlane, W.V., Taksali, S.E., Yeckel, C.W., et al. (2004) Obesity and the metabolic syndrome in children and adolescents. The New England Journal of Medicine, 350, 2362-2374. http://dx.doi.org/10.1056/NEJMoa031049 [10] Cuevas, A., Alvarez, V. and Carrasco, F. (2011) Epidemic of metabolic syndrome in Latin America. Current Opi- nion in Endocrinology, Diabetes and Obesity, 18, 134- 138. http://dx.doi.org/10.1097/MED.0b013e3283449167 [11] Escobedo, J., Schargrodsky, H., Champagne, B., Silva, H., Boissonnet, C.P., Vinueza, R., et al. (2009) Prevalence of the metabolic syndrome in Latin America and its asso- ciation with sub-clinical carotid atherosclerosis: The CARMELA cross sectional study. Cardiovascular Dia- betology, 8, 52. http://dx.doi.org/10.1186/1475-2840-8-52 [12] WHO (2011) Noncommunicable diseases country profiles 2011. World Health Organization, Geneva. [13] Jenkins, T.M., Buncher, C.R., Akers, R., Daniels, S.R., Lawson, M.L., Khoury, P.R., et al. (2013) Validation of a weight history questionnaire to identify adolescent obe- sity. Obesity Surgery, 23, 1404-1412. http://dx.doi.org/10.1007/s11695-013-0901-7 [14] Lissner, L., Odell, P.M., D’Agostino, R.B., Stokes, J., Kreger, B.E., Belanger, A.J., et al. (1991) Variability of body weight and health outcomes in the Framingham population. The New England Journal of Medicine, 32, 1839-1844. http://dx.doi.org/10.1056/NEJM199106273242602 [15] Hamm, P., Shekelle, R.B. and Stamler, J. (1989) Large fluctuations in body weight during young adulthood and twenty-five-year risk of coronary death in men. American Journal of Epidemiology, 129, 312-318. [16] Davis, H. and Gergen, P.J. (1994) The weights and heights of Mexican-American adolescents: The accuracy of self-reports. American Journal of Public Health, 84, 459-462. http://dx.doi.org/10.2105/AJPH.84.3.459 [17] Osuna-Ramírez, I., Hernández-Prado, B., Campuzano, J.C. and Salmerón, J. (2006) Body mass index and body image perception in Mexican adult population: The accu- racy of self-reporting. Índice de masa corporal y perce- pción de la imagen corporal en una población adulta Mexicana: La precisión del autorreporte. Salud Pública de México, 48, 94-103. http://dx.doi.org/10.1590/S0036-36342006000200003 [18] Andrade, F.C.D., Raffaelli, M., Teran-Garcia, M., Jerman, J.A. and Aradillas-Garcia, C. (2012) Weight status mis- perception among Mexican young adults. Body Image, 9, 184-188. http://dx.doi.org/10.1016/j.bodyim.2011.10.006 [19] Gorber, S.C., Tremblay, M, Moher, D and Gorber, B. (2007) A comparison of direct vs. self-report measures for assessing height, weight and body mass index: A sys- tematic review. Obesity Revi ews, 38, 307-326. http://dx.doi.org/10.1111/j.1467-789X.2007.00347.x [20] Bayomi, D.J. and Tate, R.B. (2008) Ability and accuracy of long-term weight recall by elderly males: The Mani- toba Follow-up Study. Annals of Epidemiology, 18, 36-42. http://dx.doi.org/10.1016/j.annepidem.2007.06.009 [21] Tamakoshi, K., Yatsuya, H., Kondo, T., Hirano, T., Hori, Y., Yoshida, T., et al. (2003) The accuracy of long-term recall of past body weight in Japanese adult men. Inter- national Journal of Obesity and Related Metabolic Disor- ders, 27, 247-252. http://dx.doi.org/10.1038/sj.ijo.802195 [22] Perry, G.S., Byers, T.E., Mokdad, A.H., Serdula, M.K. and Williamson, D.F. (1995) The validity of self-reports of past body weights by U.S. adults. Epidemiology, 6, 61- 66. http://dx.doi.org/10.1097/00001648-199501000-00012 [23] Grundy, S.M., Brewer Jr, H.B., Cleeman, J.I., Smith Jr, S.C. and Lenfant, C. (2004) Definition of metabolic syn- drome: Report of the National Heart, Lung, and Blood Institute/American Heart Association conference on sci- entific issues related to definition. Circulation, 109, 433- 438. http://dx.doi.org/10.1161/01.CIR.0000111245.75752.C6 [24] Alberti, K.G.M.M., Eckel, R.H., Grundy, S.M., Zimmet, P.Z., Cleeman, J.I. and Donato, K.A. (2009) Harmonizing the metabolic syndrome. Circulation, 120, 1640-1645. http://dx.doi.org/10.1161/CIRCULATIONAHA.109.1926 44 [25] Peters, D.H., Garg, A., Bloom, G., Walker, D.G., Brieger, W.R. and Hafizur Rahman, M. (2008) Poverty and access to health care in developing countries. Annals of the New York Academy of Sciences, 1136, 161-171. http://dx.doi.org/10.1196/annals.1425.011 [26] Durrant, V.L. and Menken, J. (2002) Leveraging Longi- Copyright © 2013 SciRes. OPEN A CCESS  F. C. D. Andrade et al. / Open Journal of Preventive Medicine 3 (2013) 479-486 Copyright © 2013 SciRes. OPEN A CCESS 486 tudinal Data in Developing Countries: Report of a Work- shop. The National Academies Press, Washington, DC. [27] Bonvecchio, A., Safdie, M., Monterrubio, E.A., Gust, T., Villalpando, S. and Rivera, J.A. (2009) Overweight and obesity trends in Mexican children 2 to 18 years of age from 1988 to 2006. Tendencias de sobrepeso y obesidad en niños Mexicanos de 2 a 18 años de edad: 1988 a 2006. Salud Pública de México, 51, S586-S594. http://dx.doi.org/10.1590/S0036-36342009001000013 [28] Del Río-Navarro, B.E., Velázquez-Monroy, O., Sánchez- Castillo, C.P., Lara-Esqueda, A., Berber, A., Fanghänel, G., et al. (2004) The high prevalence of overweight and obesity in Mexican children. Obesity Research, 12, 215- 223. http://dx.doi.org/10.1038/oby.2004.28 [29] Must, A., Willett, W.C. and Dietz, W.H. (1993) Remote recall of childhood height, weight, and body build by elderly subjects. American Journal of Epidemiology, 138, 56-64. [30] Koprowski, C., Coates, R.J. and Bernstein, L. (2001) Ability of young women to recall past body size and age at menarche. Obesity Research, 9, 478-485. http://dx.doi.org/10.1038/oby.2001.62 |