

Paper Menu >>
Journal Menu >>
 Advances in Anthropology 2013. Vol.3, No.4, 188-192 Published Online November 2013 in SciRes (http://www.scirp.org/journal/aa) http://dx.doi.org/10.4236/aa.2013.34026 Open Access 188 Angular Photogrammetric Analysis of the Facial Profile of the Adult Bangladeshi Garo Mussammat Afsana Ferdousi1, Abdullah Al Mamun2, Laila Anjuman Banu3*, Sudip Paul4 1Department of Anatomy, Tairunnessa Memorial Medical College and Hospital, Dhaka, Bangladesh 2Department of Microbiology, North Bengal Medical College, Sirajganj, Bangladesh 3Department of Anatomy, Bangabandhu Sheikh Mujib Medical University, Dhaka, Bangladesh 4Department of Biochemistry and Molecular Biology, Jahangirnagar University, Dhaka, Bangladesh Email: *[email protected] Received May 22nd, 2013; revised June 25th, 2013; accepted July 21st, 2013 Copyright © 2013 Mussammat Afsana Ferdousi et al. This is an open access article distributed under the Crea- tive Commons Attribution License, which permits unrestricted use, distribution, and reproduction in any me- dium, provided the original work is properly cited. The analysis of facial soft tissue from the photographic records gives information about the standard nor- mative values of different facial parameters of a specific population group, helps in the diagnosis of any abnormalities of face and also helps for the treatment plan of patients undergoing orthodontic treatment or facial plastic surgery. The aim of the present study was to measure some craniofacial angles of the Bang- ladeshi Garo males and females on standardized facial profile photographs and compare them with each other and with norms of different ethnic group proposed by the other investigators. The study was carried out with a total number of 100 Christian Garo adult male and female subjects. Statistical analysis showed that the females had significantly higher values than the males in three facial angles (p < 0.05): the na- sofrontal angle (G-N-Pro, females = 137.97˚ ± 4.80˚; males = 129.57˚ ± 7.96˚), the nasomental angle (N- Prn-Pg, females = 132.79˚ ± 5.10˚; males = 129.75˚ ± 7.32˚) and the angle of facial convexity (G-Sn-Pg, females = 169.26˚ ± 4.43˚; males = 158.65˚ ± 12.17˚) but no differences between the nasofacial (G-Pg/ N-Prn) and nasolabial angle (Cm-Sn-Ls). Findings from the present study might help to establish a dis- tinct facial profile trait for the Garo population. Keywords: Photogrammetric Analysis; Facial Angle; Garo Population Introduction The face is the most attractive and variable part of the human body. The variability and beautifulness of the face are express- ed by different sizes and shapes of individual features of diffe- rent parts of the face and also by different facial angles. As face is the entity which gives us the perception of individuality of human being and of gender differences, different craniofacial parameters help in identifying people having different physical characteristics, diagnosing people having craniofacial abnorma- lity related to congenital or genetic cause and differentiating be- tween males and females. Various methods have been used to evaluate facial characteristics such as craniofacial anthropome- try (Kolar & Salter, 1997), photogrammetry (Fernandez-Riveiro et al., 2003; Kale-Varlik, 2003; Anicy-Milosivecy et al., 2008; Malkoc et al., 2009; Anibor & Okumagba, 2010; Reddy et al., 2011; Wamalwa et al., 2011), cephalometric radiography (Mc- Intyre & Mossey, 2003), stereophotogrammetry (Sforza & Fer- rario, 2006), computed tomography and laser scanning (AlK- hatib, 2010). Anthropometric measurements on photographs are called photogrammetry. Stoner (1955) and Fernandez-Riveiro et al. (2003) standardized the photographic technique and record taking in natural head position (NHP) and gave average values for White adults, whereas Arnett and Bergman (1993) also took records in NHP and described the facial profile using the angle of facial convexity. Craniofacial photogrammetry is a new field in Bangladesh. It is simple to be applied and is relatively noninvasive and low cost method. It avoids inconvenience of the participants and also saves valuable time. It provides a permanent record for the actual appearance of the participants. As the outline of the pho- tographs do not change and the soft tissue becomes income- pressible on the bone, so the data obtained from the analysis of angular photogrammetric profile can provide the maxillofacial and plastic surgeons, orthodontists and other clinicians with a way of understanding problems associated with various soft tis- sue segments of the facial region and also can help in setting aesthetic treatment plans for the patients. Populations vary genetically and geographically in their cra- niofacial features. Therefore, a single standard of anthropomet- ric variables is not appropriate for being applied to diverse ra- cial and ethnic groups. Though Bangladesh is a relatively small country, people of different religions and ethnic groups live here and these different groups have differences in their physi- cal characteristics. The Garo community is one of the major tribes in Bangladesh. The people from the Garo tribe have dif- ferent physical characteristics from those of the Bengali popu- lation. Broadly speaking, they carry the racial characteristics of the Mongoloids (Banglapedia, 2011). Study on Angular photo- grammetric profile analysis of the Garo tribal population is *Corresponding author.  M. A. FERDOUSI ET AL. scanty, especially on the measurements like facial profile an- gles and sexual differences. Measurement of the different craniofacial variables is being considered as important for studying human growth because facial proportions change with age, for studying sexual differ- ences as sex differences are presented by variations in skeletal dimensions and muscle development and also for clinical treat- ments as normative value of craniofacial dimensions help in determining abnormality and thus treatment planning (Kolar & Salter, 1997). So, the results of this study were expected to be useful for the anatomists, physical anthropologists, genetic counselors, forensic scientists, beauticians as well as plastic and reconstructive surgeons. Materials and Methods Study Participan ts A total of 100 adult Bangladeshi Christian Garo (50 males and 50 females) participants aged between 25 and 45 years re- siding at Dhaka city were enrolled in the study and the analysis of the data were done in the Department of Anatomy, Banga- bandhu Sheikh Mujib Medical University (BSMMU), Dhaka from July 2010 to June 2011. They were without any history of acquired or genetic craniofacial anomalies. Participants were considered to be the “Garo” if there two grandparents were of Garo origin. Among the Garo, only Christians and adults were decided to be selected for avoiding possible differences with age or those arising from habits related to specific religions. The research proposal was approved by the Ethical Review Com- mittee (ERC) of BSMMU. Then consent was obtained from each participant by taking her/his signature on the written con- sent form. Photographic Se tu p All right profile photographs were taken with a Kodak Easy Share Z 710 digital camera, with 10 X optical zoom and at a 7.1 megapixel resolution. A blue color curtain was used as a back- ground, and flash mode was also used. Photograph Taking To take a good image, the camera was positioned approxi- mately 1.0 - 1.5 meter distance from the participant and was raised to the ear level of the participant to provide good quality of image and to prevent distortion of the face (Ozkul et al., 2009). All the photographs were taken with the participants sitting in a relaxed position with their heads held in the natural head position (Fernandez-Riveiro et al., 2003). Photograph Analys is Analysis of the facial photographs was done by a computer software program named Adobe Photoshop CS 4 Extended (Fi- gures 1-6). All the measurements were taken twice and recor- ded in the corresponding data form. Statistical Analysis Computer assisted analysis of the right lateral facial photo- graphs was done by using a computer based software program Statistical Package for Social Sciences (SPSS-version 17.0). Figure 1. Landmarks used in this investigation: G, glabella; N, nasion; Prn, pro- nasale; Cm, columella; Sn, subnasale; Ls, labial superior; Pg, pogonion. Figure 2. Nasofrontal angle (G-N-Prn). The ranges and mean ± standard deviations (SDs) were calcu- lated for each angle and unpaired Student’s t-test was calculat- ed to find out the differences of facial angles between the Garo males and females. A p value ≤ 0.05 was set as being statisti- cally significant. Index of sexual dimorphism was also calcu- lated (Hwang et al., 1995). Results Descriptive statistical data including mean, maximum, mini- mum, and standard deviations for the photogrammetric angular measurements together with the results of the Student’s t-test comparing male and female measurements are shown in Table 1. Statistically significant sex differences were found in three of the five angles analyzed: all angles that suggested gender diffe- rences were wider in females: the nasofrontal angle (G-N- Open Access 189 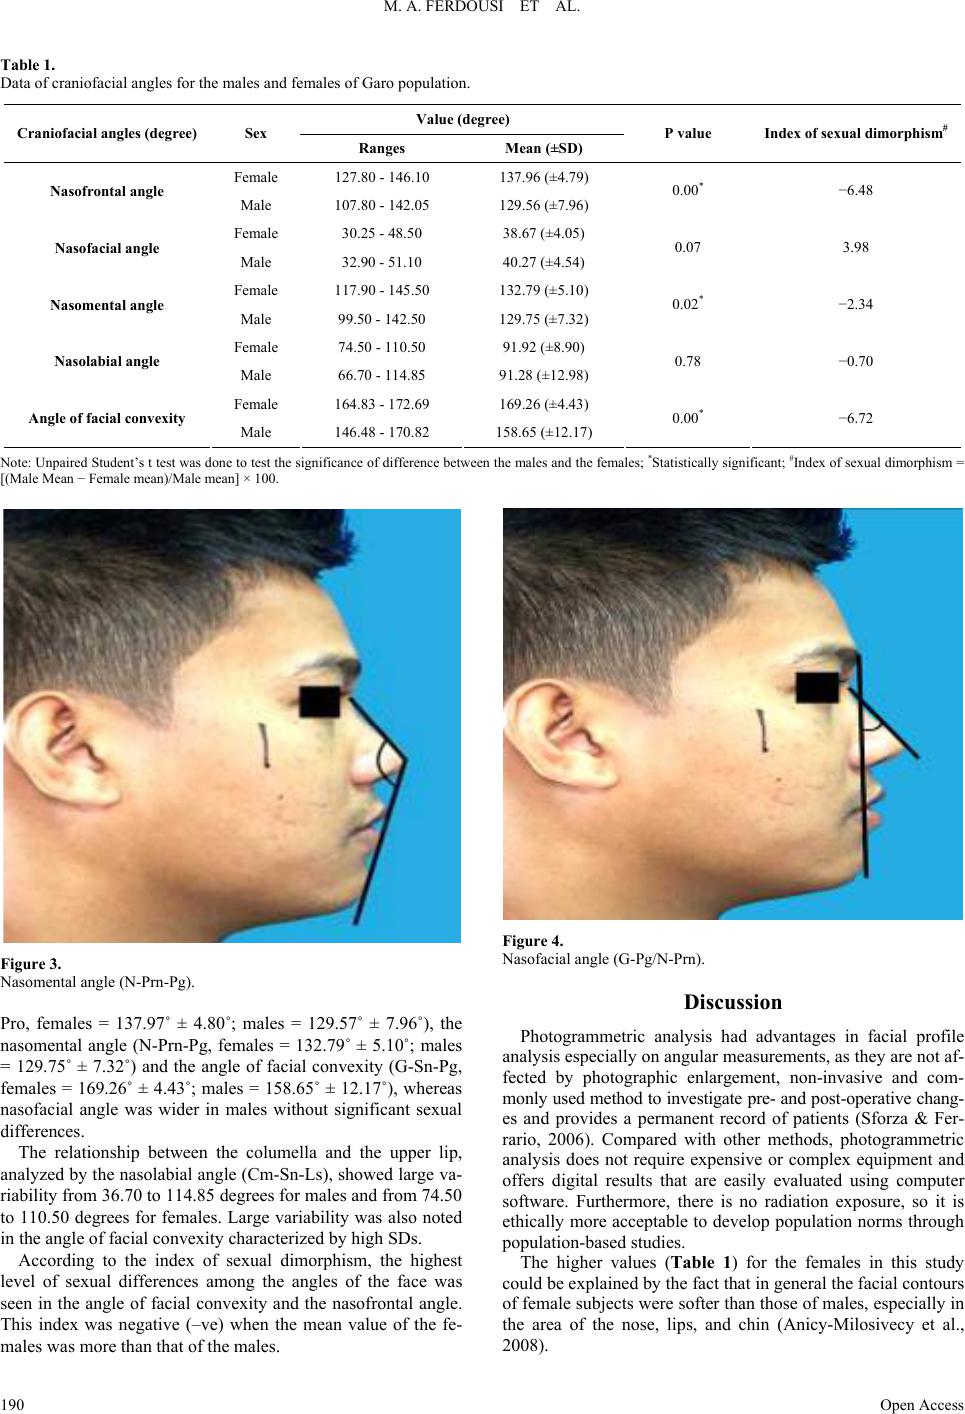 M. A. FERDOUSI ET AL. Open Access 190 Table 1. Data of craniofacial angles for the males and females of Garo population. Value (degree) Craniofacial angles (degree) Sex Ranges Mean (±SD) P value Index of sexual dimorphism# Female 127.80 - 146.10 137.96 (±4.79) Nasofrontal angle Male 107.80 - 142.05 129.56 (±7.96) 0.00* −6.48 Female 30.25 - 48.50 38.67 (±4.05) Nasofacial angle Male 32.90 - 51.10 40.27 (±4.54) 0.07 3.98 Female 117.90 - 145.50 132.79 (±5.10) Nasomental angle Male 99.50 - 142.50 129.75 (±7.32) 0.02* −2.34 Female 74.50 - 110.50 91.92 (±8.90) Nasolabial angle Male 66.70 - 114.85 91.28 (±12.98) 0.78 −0.70 Female 164.83 - 172.69 169.26 (±4.43) Angle of facial convexity Male 146.48 - 170.82 158.65 (±12.17) 0.00* −6.72 Note: Unpaired Student’s t test was done to test the significance of difference between the males and the females; *Statistically significant; #Index of sexual dimorphism = [(Male Mean − Female mean)/Male mean] × 100. Figure 4. Nasofacial angle (G-Pg/N-Prn). Figure 3. Nasomental angle (N-Prn-Pg). Discussion Pro, females = 137.97˚ ± 4.80˚; males = 129.57˚ ± 7.96˚), the nasomental angle (N-Prn-Pg, females = 132.79˚ ± 5.10˚; males = 129.75˚ ± 7.32˚) and the angle of facial convexity (G-Sn-Pg, females = 169.26˚ ± 4.43˚; males = 158.65˚ ± 12.17˚), whereas nasofacial angle was wider in males without significant sexual differences. Photogrammetric analysis had advantages in facial profile analysis especially on angular measurements, as they are not af- fected by photographic enlargement, non-invasive and com- monly used method to investigate pre- and post-operative chang- es and provides a permanent record of patients (Sforza & Fer- rario, 2006). Compared with other methods, photogrammetric analysis does not require expensive or complex equipment and offers digital results that are easily evaluated using computer software. Furthermore, there is no radiation exposure, so it is ethically more acceptable to develop population norms through population-based studies. The relationship between the columella and the upper lip, analyzed by the nasolabial angle (Cm-Sn-Ls), showed large va- riability from 36.70 to 114.85 degrees for males and from 74.50 to 110.50 degrees for females. Large variability was also noted in the angle of facial convexity characterized by high SDs. According to the index of sexual dimorphism, the highest level of sexual differences among the angles of the face was seen in the angle of facial convexity and the nasofrontal angle. This index was negative (–ve) when the mean value of the fe- males was more than that of the males. The higher values (Table 1) for the females in this study could be explained by the fact that in general the facial contours of female subjects were softer than those of males, especially in the area of the nose, lips, and chin (Anicy-Milosivecy et al., 2008).  M. A. FERDOUSI ET AL. Figure 5. Nasolabial angle (Cm-Sn-Ls). Figure 6. Angle of the facial convexity (G-Sn-Pg). The nasofrontal angle (G-N-Prn) showed significant sex dif- ferences in the adult Garo and the angle was wider in females. This is in agreement to the findings by Reddy et al. (2011) in the North Indian population (136.71˚ ± 3.64˚ in males and 144.33˚ ± 1.75˚ in females), Fernandez-Riveiro et al. (2003) for Spanish (138.57˚ ± 6.81˚ in males and 141.98˚ ± 6.06˚ in fe- males), Anic-Milosevic et al. (2008) for Croatian (136.38˚ ± 6.71˚ in males and 139.11˚ ± 6.35˚ in females) and Wamalwa et al. (2011) for Kenyans (132.44˚ ± 6.91˚ in males and 137.97˚ ± 5.21˚ in females). However, Malkoc et al. (2009) found no sex differences in this angle (146.03˚ ± 8.19˚ in males and 148.61˚ ± 6.66˚ in females). Anibor and Okumagba (2010) found higher mean male value than the female in Negroid population (132.0˚ ± 7.50˚ in males and 137.70˚ ± 7.6˚ in females). The lower mean value of nasofrontal angle may be attributed to prominent glabella in the male (Mowlavi et al., 2004). The mean value of nasofacial angle (G-Pg/N-Prn) found in the adult Garo population (40.27˚ ± 4.54˚ in males and 38.67˚ ± 4.05˚ in females) is more in comparison to the values given by Reddy et al. (2011) (34.38˚ ± 1.77˚ in males and 33.69˚ ± 1.37˚ in females) but larger than Anicy-Milosivecy et al. (2008) (29.53˚ ± 2.51˚ in males and 30.36˚ ± 2.38˚ in females). No sig- nificant sexual dimorphism was observed. Higher nasofacial angle suggests that the projection of the nose is more (Wamal- wa et al., 2011). The average value of nasomental angle (N-Prn-Pg) found in the Garo (129.75˚ ± 7.32˚ in males and 132.79˚ ± 5.10˚ in fe- males) is similar to the North Indian population (127.71˚ ± 1.97˚ in males and 127.11˚ ± 1.81˚ in females) and Caucasian population (130.47˚ ± 3.73˚ in males and 130.19˚ ± 3.47˚ in females) (Reddy et al., 2011; Anicy-Milosivecy et al., 2008). Significant sexual dimorphism was also observed. The nasolabial angle (Cm-Sn-Ls), evaluating the relationship of the nasal base and upper lip, is one of the measurements with greater clinical relevance during orthodontic diagnosis and treatment planning because its magnitude depends on the ante- roposterior position and inclination of the upper anterior teeth, and it can be altered by orthodontics or orthognathic surgery (Wamalwa et al., 2011). The mean value of nasolabial angle (Cm-Sn-Ls) found in the Garo (91.28˚ ± 12.98˚ in males and 91.92˚ ± 8.90˚ in females) is less than that in North Indian po- pulation (102.32˚ ± 4.69˚ in males and 101.50˚ ± 4.39˚ in fe- males), Turkish population (101.09˚ ± 10.19˚ in males and 102.94˚ ± 10.43˚ in females), White European population (105.2˚ ± 13.28˚ in males and 107.57˚ ± 8.5˚ in females) and Caucasian population (105.42˚ ± 9.52˚ in males and 109.39˚ ± 7.84˚ in females) (Reddy et al., 2011; Malkoc et al., 2009; Fer- nández-Riveiro et al., 2003; Anicy-Milosivecy et al., 2008). Sig- nificant sexual dimorphism was not observed between the males and females. The average value of facial convexity angle (G-Sn-Pg) found in the Garo (158.65˚ ± 12.17˚ in the males and 169.26˚ ± 4.43˚ in the females) is similar to that in the North Indian population (168.54˚ ± 3.23˚ in males and 166.64˚ ± 4.09˚ in females) and White European population (168.2˚ ± 4.96˚ in males and 167.0˚ ± 5.36˚ in females) while slightly less than the values in Turk- ish population (170.60˚ ± 6.15˚ in males and 168.78˚ ± 5.44˚ in females) and Caucasian population (168.78˚ ± 4.97˚ in males and 169.05˚ ± 4.69˚ in females) (Reddy et al., 2011; Malkoc et al., 2009; Fernández-Riveiro et al., 2003; Anicy-Milosivecy et al., 2008). Significant sexual dimorphism was observed between the males and females. Conclusion It was assumed that a study on the facial angle measurements on the Garo population of Bangladesh would contribute to the establishment of standardized normal values for the population. It would also help in understanding how this population stands anthropometrically among the various populations of the world indicating the variations it shows from different other popula- tions. So, more research is needed for testing the accuracy of photogrammetric method in Bangladesh. Acknowledgements The authors would like to thank Dr. Khondker Manzare Sha- mim, Professor and Chairman, Department of Anatomy, Banga- bandhu Sheikh Mujib Medical University for his constant gui- Open Access 191  M. A. FERDOUSI ET AL. Open Access 192 dance and advice that make this work possible. REFERENCES Al-Khatib, A. R. (2010). Facial three dimensional surface imaging: An overview. Archives of Orofacial Sciences, 1, 1-8. Anibor, E., & Okumagba, M. T. (2010). Photometric facial analysis of the Urhobo ethnic group in Nigeria. Archives of Applied Science Re- search, 3, 28-32. Anicy-Milosivecy, S., Lapter-Varga, M., & Slaj, M. (2008). Analysis of the soft tissue facial profile by means of angular measurements. Eu- ropean Journal of Orthod on t ic s, 2, 135-140. http://dx.doi.org/10.1093/ejo/cjm116 Arnett, G. W., & Bergman, R. T. (1993). Facial keys to orthodontic diagnosis and treatment planning-Part I. American Journal of Ortho- dontics and Dentofacial Or t h opedics, 103, 299-312. http://dx.doi.org/10.1016/0889-5406(93)70010-L Banglapedia (2011). Garo people. http://www.banglapedia.org/HT/G_0043.HTM Fernandez-Riveiro, P., Smyth-Chamosa, E., Suarez-Quintanilla, D., & Suarez-Cunqueiro, M. (2003). Angular photogrammetric analysis of the soft tissue facial profile. European Journal of Orthodontics, 25, 393-399. http://dx.doi.org/10.1093/ejo/25.4.393 Hwang, Y., Lee, K. H., Choi, B. Y., Lee, K. S., Lee H. Y., Sir, W. S. et al. (1995). Study on the Korean adult cranial capacity. Journal of Korean Medical Science, 4, 239-242. Kale-Varlik, S. (2003). Angular photogrammetric analysis of the soft tissue facial profile of Anatolian Turkish adults. The Journal of Cra- niofacial Surgery, 6, 1481-1486. Kolar, J. C., & Salter, E. M. (1997). Craniofacial anthropometry: Prac- tical measurement of the head and face for clinical, surgical and re- search use. Springfield, Illinois: Charles C Thomas, Publisher Ltd. Malkoc, S., Demir, A., & Uysal, T. (2009). Angular photogrammetric analysis of the soft tissue facial profile of Turkish adults. European Journal of Orthodontic s , 31, 174-179. http://dx.doi.org/10.1093/ejo/cjn082 McIntyre, G. T., & Mossey, P. A. (2003). Size and shape measurement in contemporary cephalometrics. European Journal of Orthodontics, 25, 231-242. http://dx.doi.org/10.1093/ejo/25.3.231 Mowlavi, A., Meldrum, D. G., & Wilhelmi, B. J. (2004). Implications for nasal recontouring: Nasion position preferences as determined by a survey of White North Americans. Aesthetic Plastic Surgery, 27, 438-445. Ozkul, T., Ozkul, M. H., Akhtar, R., Al-Kaabi, F., & Jumaia, T. (2009). A software tool for measurement of facial parameters. The Open Chemical and Biomedical Methods Journal, 2, 69-74. http://dx.doi.org/10.2174/1875038900902010069 Reddy, M., Ahuja, N. K., Raghav, P., Kundu, V., & Mishra V. A. (2011). Computer-assisted angular photogrammetric analysis of the soft tis- sue facial profile of North Indian adults. The Journal of Indian Or- thodontic Society, 3, 119-123. http://dx.doi.org/10.5005/jp-journals-10021-1021 Sforza, C., & Ferrario, V. F. (2006). Soft-tissue facial anthropometry in three dimensions: From anatomical landmarks to digital morphology in research, clinics and forensic anthropology. Journal of Anthropo- logical Sciences, 84, 97-124. Stoner, M. M. (1955). A photometric analysis of the facial profile. American Journal of Ortho d o ntics, 41, 453-469. http://dx.doi.org/10.1016/0002-9416(55)90156-1 Wamalwa, P., Amisi, S. K., & Chen, S. (2011). Angular photogramme- tric comparison of the soft-tissue facial profile of Kenyans and Chi- nese. The Journal of Craniofacial Surgery, 3, 1064-1072. http://dx.doi.org/10.1097/SCS.0b013e31821075d8 |