

Paper Menu >>
Journal Menu >>
 Engineering, 2013, 5, 357-362 http://dx.doi.org/10.4236/eng.2013.510B072 Published Online Octob er 2013 (http://www.scirp.org/journal/eng) Copyright © 2013 SciRes. ENG A Restricted, Adaptive Threshold Segmentation Approach for Processing High-Speed Image Sequences of the Glottis Mathew Blanco, Xin Chen, Yuling Yan* Department of Bioengineerin g, Santa Clara University, Santa Clara, USA Email: *[email protected] Received May 2013 ABSTRACT In this paper, we propose a restricted, adaptive threshold appr o ach for the segmentation of images of the glottis acquired from high speed video-endoscopy (HSV). The approach involves first, identifying a region of interest (ROI) that en- closes the vocal-fold motion extent for each image frame as estimated by the different image sequences. This procedure is then followed by threshold segmentation restricted within the identified ROI for each image frame of the original image sequences, or referred to as sub-image sequences. The threshold value is adapted for each sub-image frame and determined by respective minimum gray-scale value that typically corresponds to a spatial location within the glottis. The proposed approach is practical and highly efficient for segmenting a vast amount of image frames since simple threshold method is adapted. Results obtained from the segmentation of representative clinical image sequences are presented to verify the proposed method. Keywords: Segmentation; Gl ottis; Vocal Fold Motion; Difference Image; Adaptive Threshold 1. Introduction Laryngeal imaging based analysis of vocal fold motion has been proved valuable for both diagnosing voice dis- orders and understanding the mechanism of voice pro- duction. High speed digital imaging (HSDI), or high speed video-endoscopy (HSV), has now become a clini- cal reality for imaging the vibrating vocal folds. The HSDI systems record images of the vibrating vocal folds at a typical rate of 2000 frames/sec, which is fast enough to resolve a specific, sustained phonatory vocal fold vi- bration. In the literature [1-9], glottal area waveform (GAW), along with other spatiotemporal waveforms of the glottis, has been successfully used to analyze the vocal fold vibration whic h may correlate with voice con- dition. The credibility of the analysis strongly depends on an accurate extraction of the GAW from images of the glottis. In order to obtain the GAW, the glottis, or the vocal fold opening region, needs to be segmented and the area calculated on a frame by frame basis. Clearly, it is crucial for us to develop effective and highly efficient segmentation algorithms for this purpose. Image segmentation is fundamental to the field of im- age understanding and computer vision [10-13] and to establish an efficient segmentation algorithm is still challenging because of lacking in a universal segmenta- tion algorithm for all image segmentation tasks. The purpose of image segmentation is to divide an image into regions that are meaningful to some higher level processes. In this research, the meaningful region is the glottis, the air space between the pair of vocal folds. In the literature so me algorith ms for glottis seg mentation have been reported, which include region growing algo- rithm [5,14,15] and active contour algorithm [16-20]. However, there are some limitations in these approaches, making them impractical for applications in the analysis of HSV image data sets. The region growing algorithm depends much on selection of the seed point that requires prior knowledge about the location of glottis [10]. On the other ha nd the ac ti ve co nt our al gor it h m i s ext remel y ti me consuming and susceptible to noises [11]. In a clinical setting, the HSV system is capable of capturing images of the vibrating vocal folds at a rate of at least 2000 frames per second. During an examination, a patient is instructed to phonate a sustained vowel pho- nation with a typical recording time of 2 seconds. In oth- er words, each HSV recording contains 4000 image frames that need to be processed for further analysis and interpretatio n o f the vocal fold dynamic behavio rs [4]. As a result, it is essential to develop effective and efficient methods to segment the glottis rapidly and accurately. Since the time duration for each HSV recording is short, it is reasonable to assume that tremors of the hand of the clinician and of subject’s neck and head are negligible. Additionally, following assumptions should hold: *Corresponding author. 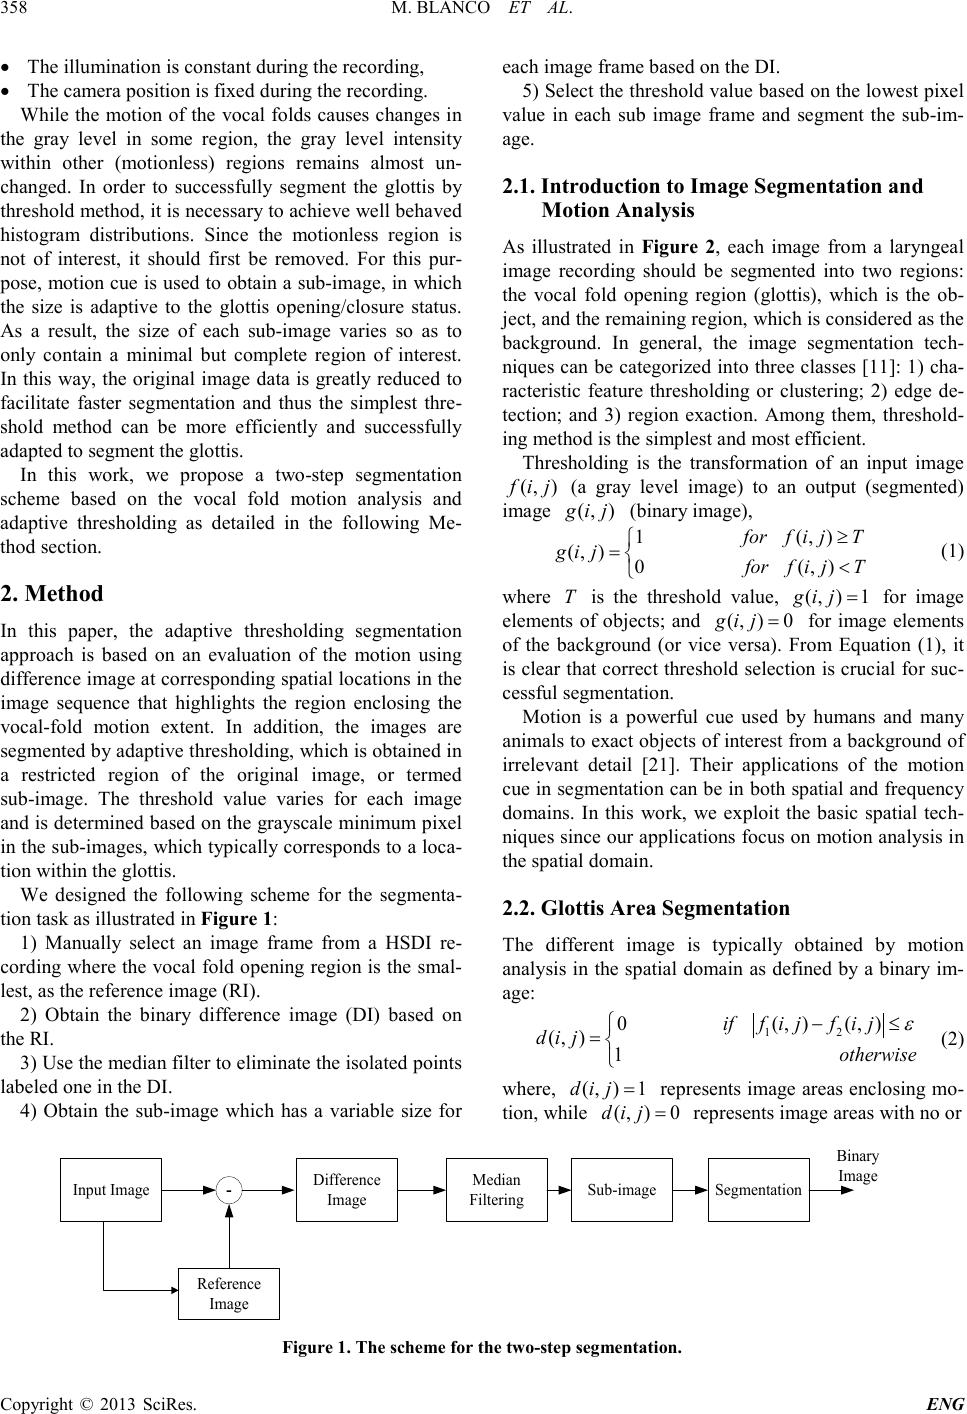 M. BLANCO ET AL. Copyright © 2013 SciRes. ENG 358 • The illumination is cons t ant d uring the recording, • The camera position is fixed during the recording. While the motion of the vocal folds causes changes in the gray level in some region, the gray level intensity within other (motionless) regions remains almost un- changed. In order to successfully segment the glottis by threshold method, it is necessary to achieve well behaved histogram distributions. Since the motionless region is not of interest, it should first be removed. For this pur- pose, motion cue is used to obtain a sub-i mage, in whic h the size is adaptive to the glottis opening/closure status. As a result, the size of each sub-image varies so as to only contain a minimal but complete region of interest. In this way, the original image data is greatly reduced to facilitate faster segmentation and thus the simplest thre- shold method can be more efficiently and successfully adapted to segment the glottis. In this work, we propose a two-step segmentation scheme based on the vocal fold motion analysis and adaptive thresholding as detailed in the following Me- thod section. 2. Method In this paper, the adaptive thresholding segmentation approach is based on an evaluation of the motion using difference image at corresponding spatial locations in the image sequence that highlights the region enclosing the vocal-fold motion extent. In addition, the images are segmented by adaptive thresholding, which is obtained in a restricted region of the original image, or termed sub-image. The threshold value varies for each image and is determined based on the grayscale minimum pixel in the sub-images, which typically corresponds to a loca- tion within the glottis. We designed the following scheme for the segmenta- tion task as illus trated in Figure 1: 1) Manually select an image frame from a HSDI re- cording where the vocal fold opening region is the smal- lest, as the reference image (RI). 2) Obtain the binary difference image (DI) based on the RI. 3) Use the median filter to eliminate the isola ted p oint s labeled one in the DI. 4) Obtain the sub-image which has a variable size for each image frame based on the DI. 5) Select the threshold value based on the lowest pixel value in each sub image frame and segment the sub-im- age. 2.1. Introduction to Image Segmentation and Motion Analys is As illustrated in Figure 2, each image from a laryngeal image recording should be segmented into two regions: the vocal fold opening region (glottis), which is the ob- jec t, and t he r e mai ni ng r e gio n, whic h i s consid e re d as t he background. In general, the image segmentation tech- niques can be categorized into three classes [11]: 1) cha- racteristic feature thresholding or clustering; 2) edge de- tection; and 3) region exaction. Among them, threshold- ing method is the simplest and most efficient. Thresholding is the transformation of an input image (, )fij (a gray level image) to an output (segmented) image (, )gi j (bi nary image), 1(, ) (, )0(, ) forf i jT gi jforf i jT ≥ =< (1) where T is the threshold value, (, )1gi j= for image elements of objects; and (, )0gi j= for image elements of the background (or vice versa). From Equation (1), it is clear that correct threshold selection is crucial for suc- cessful segmentatio n. Motion is a powerful cue used by humans and many animals to exact obj ects of interest from a background of irrelevant detail [21]. Their applications of the motion cue in segmentation can be in both spatial and frequency domains. In this work, we exploit the basic spatial tech- niques since our applications focus on motion analysis in the spatial domain. 2.2. Glottis Area S eg ment ation The different image is typically obtained by motion analysis in the spatial domain as defined by a binary im- age: 12 0(, )(, ) (, )1 iffijfij dij otherwise ε −≤ = (2) where, (, )1dij = represents image areas enclosing mo- tion, while (, )0dij = represents image areas with no or Input Image Reference Image -Difference Image Median Filtering Sub-image Segmentation Binary Image Figure 1 . The scheme for th e two-step segmentation. 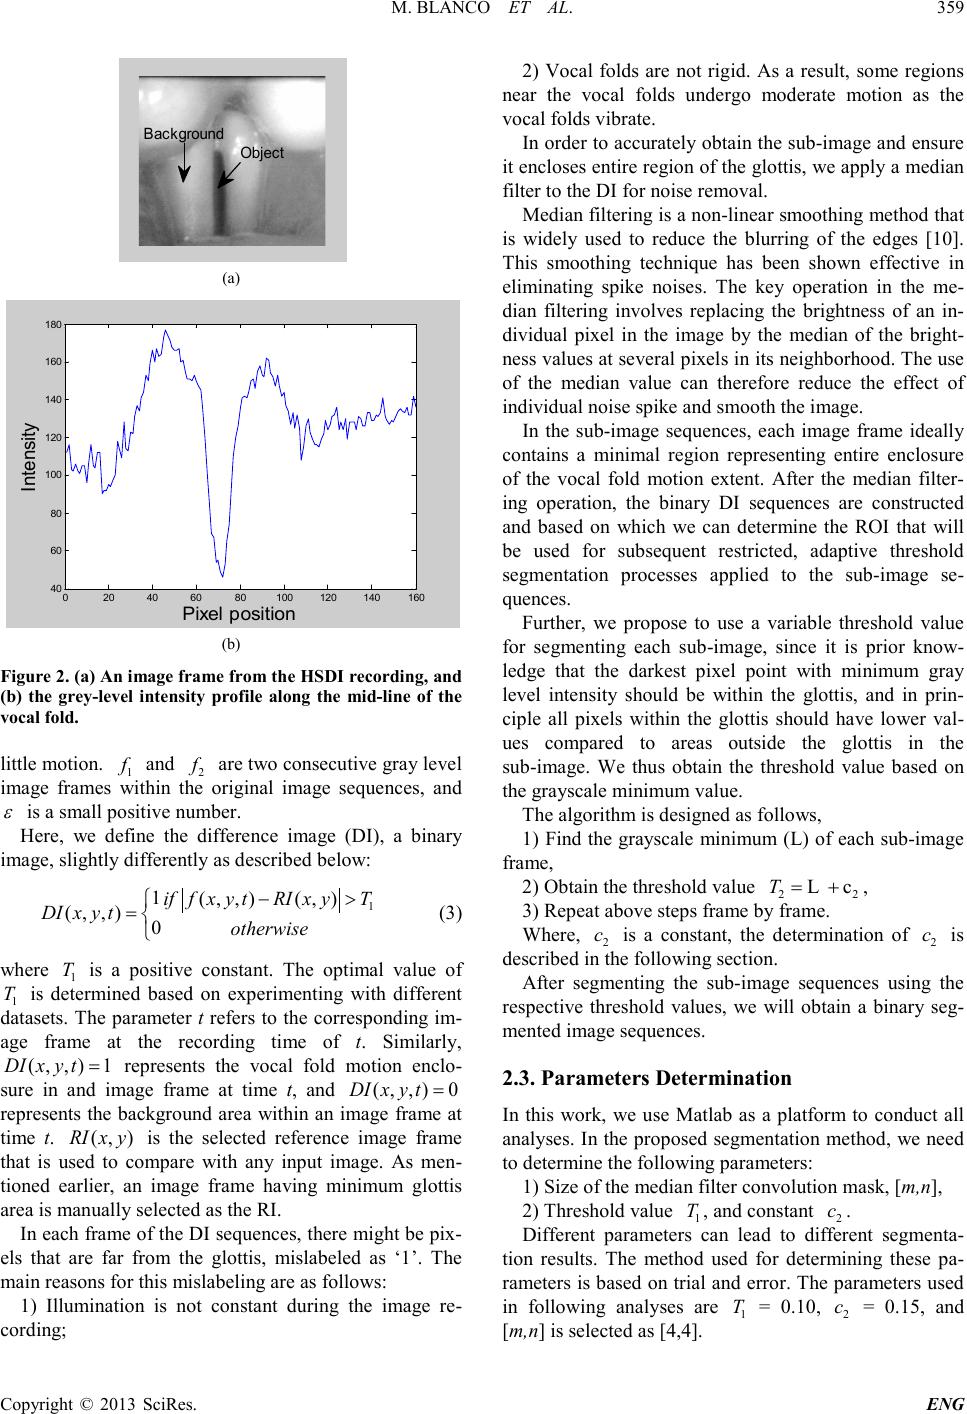 M. BLANCO ET AL. Copyright © 2013 SciRes. ENG 359 (a) (b) Figure 2 . (a) An i mage fra me from the HS DI recordi ng , and (b) the grey-level intensity profile along the mid-line of the vocal fold. little motion. 1 f and 2 f are two consecu tive gray level image frames within the original image sequences, and ε is a small positive number. Here, we define the difference image (DI), a binary image, slightly differently as described b elow: 1 1(, ,)(, ) (, ,)0 if fxytRIxyT DIxy totherwise −> = (3) where 1 T is a positive constant. The optimal value of 1 T is determined based on experimenting with different datasets. The parameter t refers to the corresponding im- age frame at the recording time of t. Similarly, (, ,)1DIxy t= represents the vocal fold motion enclo- sure in and image frame at time t, and (, ,)0DIxyt= represents the background area within an image frame at time t. (, )RIx y is the selected reference image frame that is used to compare with any input image. As men- tioned earlier, an image frame having minimum glottis area is manually selected as the RI. In each frame of the DI sequences, there might be pix- els that are far from the glottis, mislabeled as ‘1’. The main reasons for this mislabeling are as follows: 1) Illumination is not constant during the image re- cording; 2) Vocal folds are not rigid. As a result, some regions near the vocal folds undergo moderate motion as the vocal folds vibrate. In order to accurately obtain the sub-image and e nsur e it encloses entire r egion of the glottis, we ap ply a median filter to the DI for noise removal. Median filtering is a non-li nea r smoo t hing method that is widely used to reduce the blurring of the edges [10]. This smoothing technique has been shown effective in eliminating spike noises. The key operation in the me- dian filtering involves replacing the brightness of an in- dividual pixel in the image by the median of the bright- ness value s at se ver al p ixel s i n its ne ighb or hoo d. T he use of the median value can therefore reduce the effect of indivi dual noise s pike and smooth the image. In the sub-image sequences, each image frame ideally contains a minimal region representing entire enclosure of the vocal fold motion extent. After the median filter- ing operation, the binary DI sequences are constructed and based on which we can determine the ROI that will be used for subsequent restricted, adaptive threshold segmentation processes applied to the sub-image se- quences. Further, we propose to use a variable threshold value for segmenting each sub-image, since it is prior know- ledge that the darkest pixel point with minimum gray level intensity should be within the glottis, and in prin- ciple all pixels within the glottis should have lower val- ues compared to areas outside the glottis in the sub-image. We thus obtain the threshold value based on the gra ysc ale mi ni mu m val ue . The algorithm is designed as follows, 1) Find the grayscale minimum (L) of each sub-image fr ame , 2) Obtain the threshold value 22 L cT= + , 3) Repeat above steps frame by frame. Where, 2 c is a constant, the determination of 2 c is described in the following section. After segmenting the sub-image sequences using the respective threshold values, we will obtain a binary seg- mented image sequences. 2.3. Parameters Determination In this work, we use Matlab as a platform to conduct all anal yses. In t he proposed segmentation method, we need to determine the following parameters: 1) Size of the media n filte r convolution mask, [m,n], 2) Threshold value 1 T , and cons tant 2 c. Different parameters can lead to different segmenta- tion results. The method used for determining these pa- rameters is based on trial and error. The parameters used in following analyses are 1 T = 0.10, 2 c = 0.15, and [m,n] is selected as [4,4]. Obj ect B ackground 020 40 60 80 100 120 140 160 40 60 80 100 120 140 160 180 Pixel posi tion I nt ensi t y 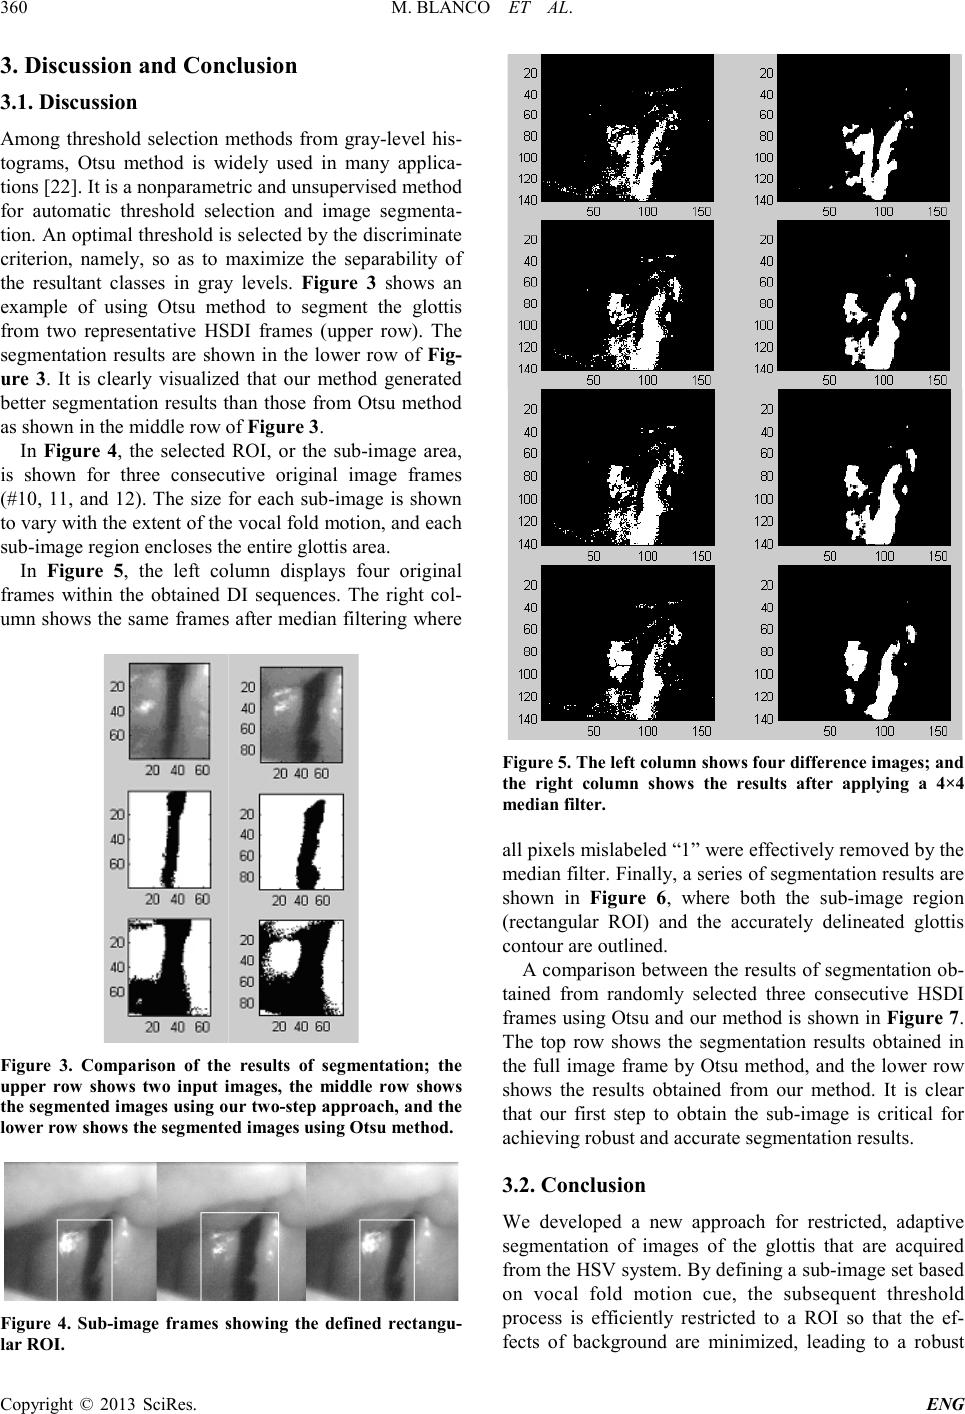 M. BLANCO ET AL. Copyright © 2013 SciRes. ENG 360 3. Discussion and Conclusion 3.1. Discussion Among threshold selection methods from gray-level his- tograms, Otsu method is widely used in many applica- tions [22]. It is a nonparametric and unsupervised method for automatic threshold selection and image segmenta- tion. An op timal thre shold is selected by the discr iminate criterion, namely, so as to maximize the separability of the resultant classes in gray levels. Figure 3 shows an example of using Otsu method to segment the glottis from two representative HSDI frames (upper row). The segmentation results are shown in the lower row of Fig- ure 3. It is clearly visualized that our method generated better segmentation results than those from Otsu method as shown in the middle row of Figure 3. In F ig ure 4, the selected ROI, or the sub-image area, is shown for three consecutive original image frames (#10, 11, and 12). The size for each sub-image is shown to vary with the extent of the vocal fold motion, and each sub-image region encloses the entire glottis area. In Figure 5, the left column displays four original frames within the obtained DI sequences. The right col- umn shows the same frames after median filtering where Figure 3. Comparison of the results of segmentation; the upper row shows two input images, the middle row shows the seg mented i mages using our tw o-step a pproa ch, and t he lower row shows the segmented i mages using Otsu method. Figure 4. Sub-image frames showing the defined rectangu- lar ROI. Figure 5 . The left column shows four diff erence images; and the right column shows the results after applying a 4×4 median fi lter. all pixels mislabele d “1” were effectively removed by the median filter. Finally, a series of segmentation results are shown in Fig ure 6, where both the sub-image region (rectangular ROI) and the accurately delineated glottis contour are outlined. A comparison between the results of segmentation ob- tained from randomly selected three consecutive HSDI fra mes usi ng Ots u and o ur me thod is sho wn in Figure 7. The top row shows the segmentation results obtained in the full image frame by Otsu method, and the lower row shows the results obtained from our method. It is clear that our first step to obtain the sub-image is critical for achieving robust and accurate segmentation results. 3.2. Conclusion We developed a new approach for restricted, adaptive segmentation of images of the glottis that are acquired fro m the HSV s yste m. By de fi nin g a s ub -image set based on vocal fold motion cue, the subsequent threshold process is efficiently restricted to a ROI so that the ef- fects of background are minimized, leading to a robust 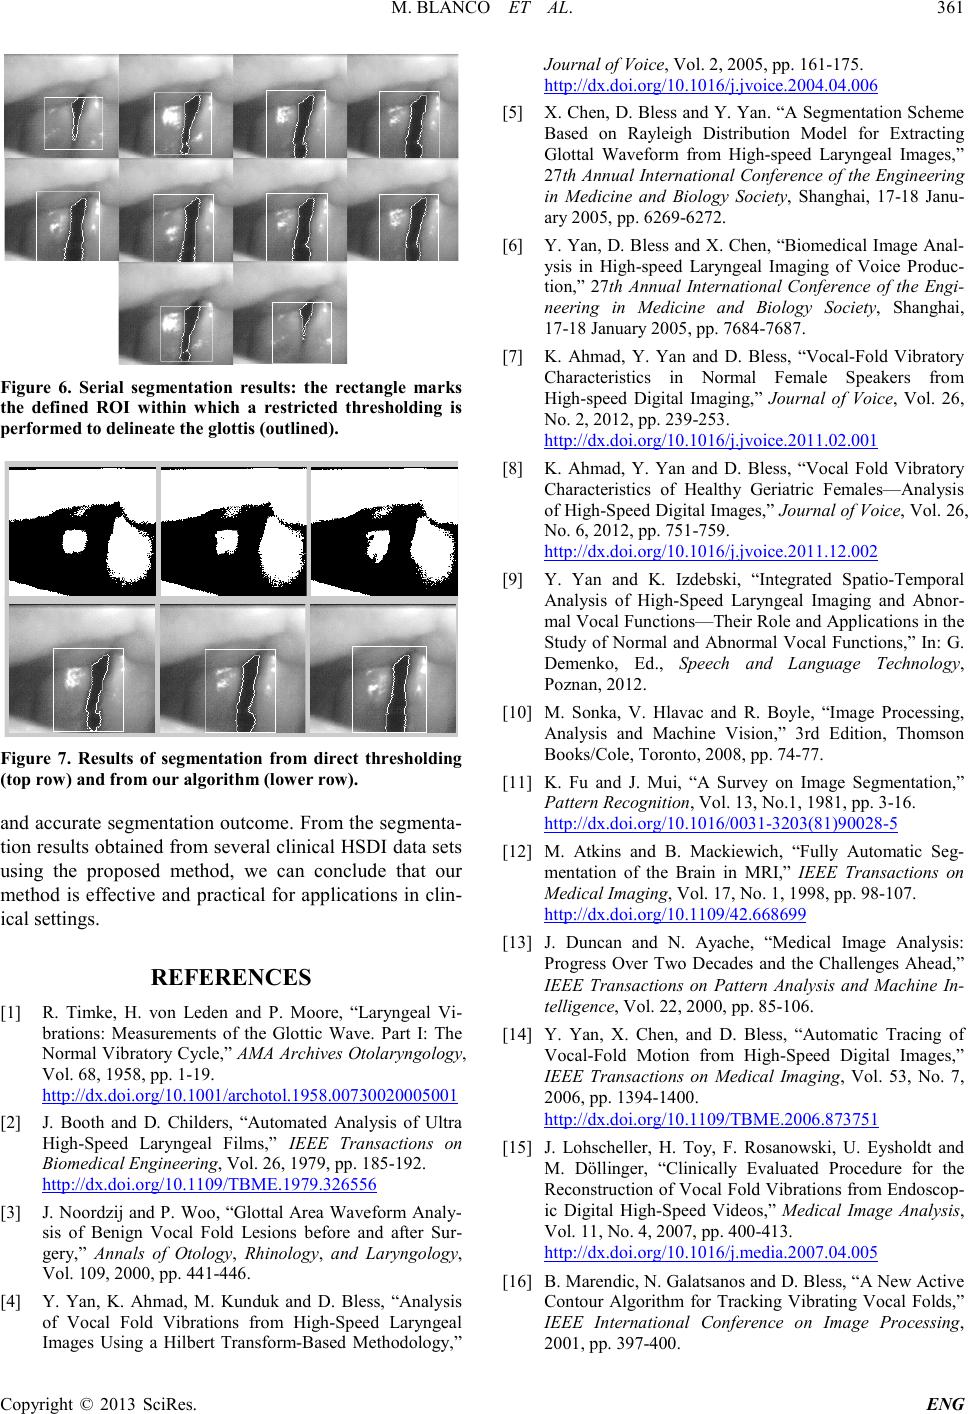 M. BLANCO ET AL. Copyright © 2013 SciRes. ENG 361 Figure 6. Serial segmentation results: the rectangle marks the defined ROI within which a restricted thresholding is performed to delineate the glottis (outlined). Figure 7. Results of segmentation from direct thresholding (top r ow) and f r om our algorithm (lower row). and accurate segmentation outcome. From the segmenta- tion results obta ined from several c linical HSDI data sets using the proposed method, we can conclude that our method is effective and practical for applications in clin- ical settings. REFERENCES [1] R. Timke, H. von Leden and P. Moore, “Laryngeal Vi- brations: Measurements of the Glottic Wave. Part I: The Normal Vibratory Cycle,” AMA Archives Otolaryngology, Vol. 68, 1958, pp. 1-19. http://dx.doi.org/10.1001/archotol.1958.00730020005001 [2] J. Booth and D. Childers, “Automated Analysis of Ultra High-Speed Laryngeal Films,” IEEE Transactions on Biomedical Engineering, Vol. 26, 1979, pp. 18 5-192. http://dx.doi.org/10.1109/TBME.1979.326556 [3] J. Noordzij and P. Woo, “Glottal Area Waveform Analy- sis of Benign Vocal Fold Lesions before and after Sur- gery,” Annals of Otology, Rhinology, and Laryngology, Vol. 109, 2000, pp. 441-446. [4] Y. Yan, K. Ahmad, M. Kunduk and D. Bless, “Analysis of Vocal Fold Vibrations from High-Speed Laryngeal Images Using a Hilbert Transform-Based Methodology,” Journal of Voice, Vol. 2, 2005, pp. 161-175. http://dx.doi.org/10.1016/j.jvoice.2004.04.006 [5] X . Chen, D. Bles s and Y. Yan. “A Segmen tation Scheme Based on Rayleigh Distribution Model for Extracting Glottal Waveform from High-speed Laryngeal Images,” 27th Annual International Conference of the Engineering in Medicine and Biology Society, Shanghai, 17-18 Janu- ary 2005, pp. 6269-6272. [6] Y. Yan, D. Bless and X. Chen, “Biomedical Image Anal- ysis in High-speed Laryngeal Imaging of Voice Produc- tion,” 27th Annual International Conference of the Engi- neering in Medicine and Biology Society, Shanghai, 17-18 January 2005, pp. 7684-7687. [7] K. Ahmad, Y. Yan and D. Bless, “Vocal-Fold Vibratory Characteristics in Normal Female Speakers from High-speed Digital Imaging,” Journal of Voice, Vol. 26, No. 2, 2012, pp. 239-253. http://dx.doi.org/10.1016/j.jvoice.2011.02.001 [8] K. Ahmad, Y. Yan and D. Bless, “Vocal Fold Vibratory Characteristics of Healthy Geriatric Females—Analysis of High-Speed Digital Images,” Journal of Voice, Vol. 26, No. 6, 2012, pp. 751-759. http://dx.doi.org/10.1016/j.jvoice.2011.12.002 [9] Y. Yan and K. Izdebski, “Integrated Spatio-Temporal Analysis of High-Speed Laryngeal Imaging and Abnor- mal Vo cal F un ction s—Their Role and Applications in the Study of Normal and Abnormal Vocal Functions,” In: G. Demenko, Ed., Speech and Language Technology, Poznan, 2012. [10] M. Sonka, V. Hlavac and R. Boyle, “Image Processing, Analysis and Machine Vision,” 3rd Edition, Thomson Books /C ole, Toro nt o, 20 08, pp. 74-77. [11] K. Fu and J. Mui, “A Survey on Image Segmentation,” Pattern Recognition, Vol. 13, No.1, 1981, pp. 3-16. http://dx.doi.org/10.1016/0031-3203(81)90028-5 [12] M. Atkins and B. Mackiewich, “Fully Automatic Seg- mentation of the Brain in MRI,” IEEE Transactions on Medical Imaging, Vol. 17, No. 1, 1998, pp . 98-107. http://dx.doi.org/10.1109/42.668699 [13] J. Duncan and N. Ayache, “Medical Image Analysis: Progress Over Two Decades and the Challenges Ahead,” IEEE Transactions on Pattern Analysis and Machine In- telligence, Vol . 2 2, 20 00, pp. 85-106. [14] Y. Yan, X. Chen, and D. Bless, “Automatic Tracing of Vocal-Fold Motion from High-Speed Digital Images,” IEEE Transactions on Medical Imaging, Vol. 53, No. 7, 2006, pp . 1394-1400. http://dx.doi.org/10.1109/TBME.2006.873751 [15] J. Lohscheller, H. Toy, F. Rosanowski, U. Eysholdt and M. Döllinger, “Clinically Evaluated Procedure for the Reconstruction of Vocal Fold Vibrations from Endoscop- ic Digital High-Speed Videos,” Medical Image Analysis, Vol. 11, No. 4, 2007, pp. 400-413. http://dx.doi.org/10.1016/j.media.2007.04.005 [16] B. Marendic, N. Galats ano s and D. Bless, “A N e w Acti v e Contour Algorithm for Tracking Vibrating Vocal Folds,” IEEE International Conference on Image Processing, 2001, pp . 397-400. 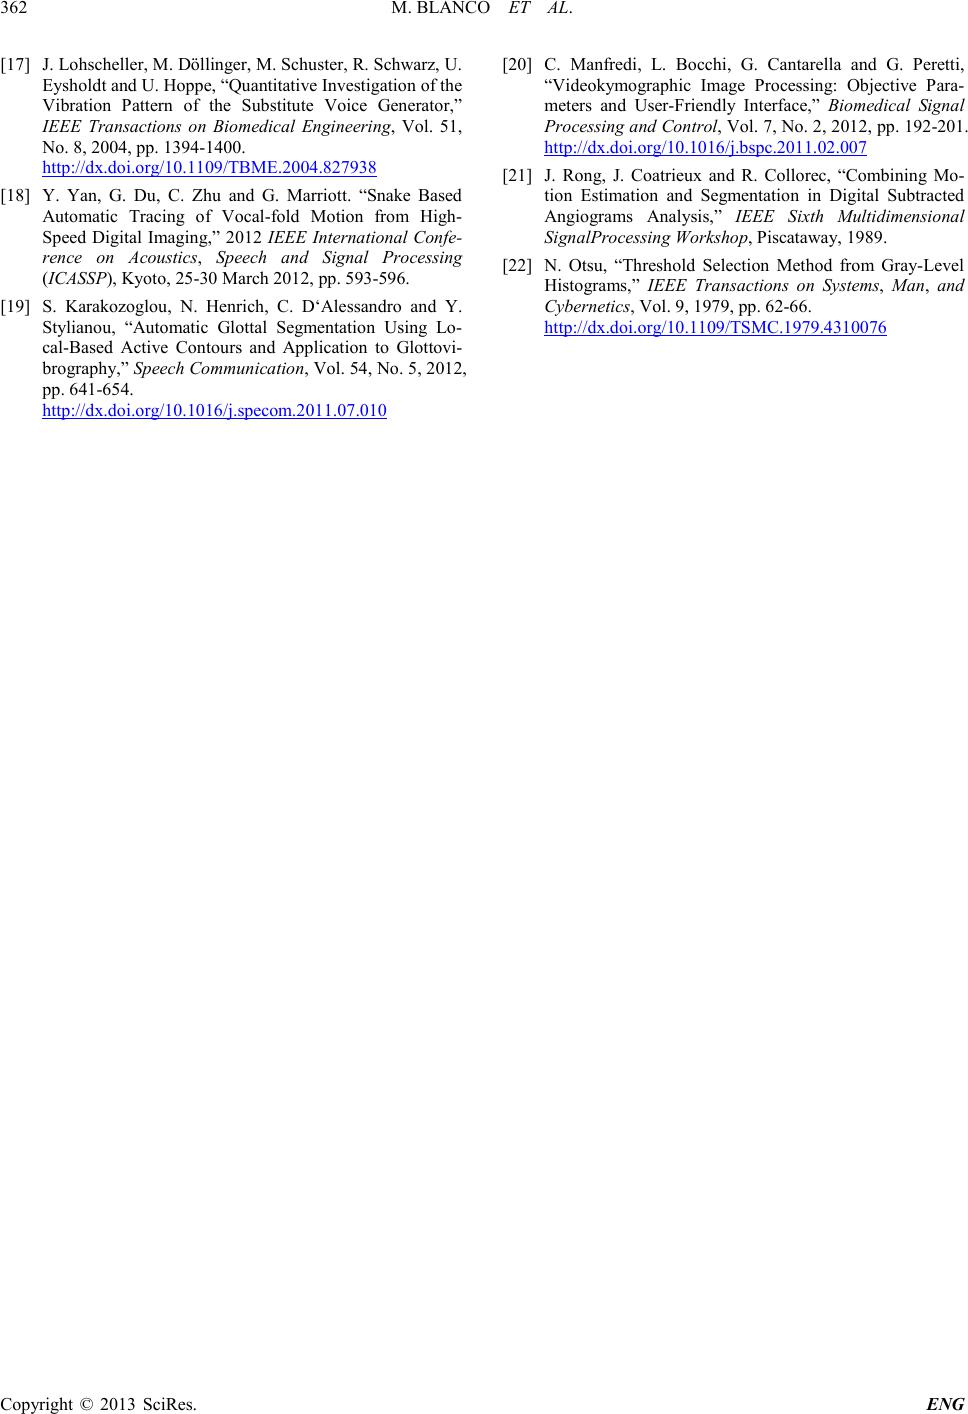 M. BLANCO ET AL. Copyright © 2013 SciRes. ENG 362 [17] J. Lohscheller, M. Döllinger, M. Schus ter, R. Schwarz, U. Eysholdt and U. Hoppe, “Quantitative Investigation of the Vibration Pattern of the Substitute Voice Generator,” IEEE Transactions on Biomedical Engineering, Vol. 51, No. 8, 2004, pp. 1394-1400. http://dx.doi.org/10.1109/TBME.2004.827938 [18] Y. Yan, G. Du, C. Zhu and G. Marriott. “Snake Based Automatic Tracing of Vocal-fold Motion from High- Speed Digital Imaging,” 2012 IEEE International Confe- rence on Acoustics, Speech and Signal Processing (ICASSP), Kyoto, 25-30 March 2012, pp. 593-596. [19] S. Karakozoglou, N. Henrich, C. D‘Alessandro and Y. Stylianou, “Automatic Glottal Segmentation Using Lo- cal-Based Active Contours and Application to Glottovi- brography,” Speech Communication, Vol. 54, No. 5, 2012, pp. 641-654. http://dx.doi.org/10.1016/j.specom.2011.07.010 [20] C. Manfredi, L. Bocchi, G. Cantarella and G. Peretti, “Videokymographic Image Processing: Objective Para- meters and User-Friendly Interface,” Biomedical Signal Processing and Control, Vol. 7, No. 2, 2012, pp. 192-201. http://dx.doi.org/10.1016/j.bspc.2011.02.007 [21] J. Rong, J. Coatrieux and R. Collorec, “Combining Mo- tion Estimation and Segmentation in Digital Subtracted Angiograms Analysis,” IEEE Sixth Multidimensional SignalProcessing Workshop, Piscataway, 1989. [22] N. Otsu, “Threshold Selection Method from Gray-Level Histograms,” IEEE Transactions on Systems, Man, and Cybern etics, Vol. 9, 19 79, pp. 62-66. http://dx.doi.org/10.1109/TSMC.1979.4310076 |