

Paper Menu >>
Journal Menu >>
 Energy and Power Engineering, 2013, 5, 703-707 doi:10.4236/epe.2013.54B136 Published Online July 2013 (http://www.scirp.org/journal/epe) Study on Approach of Static Security Assessment Accounting for Electro-thermal Coupling* Mengxia Wang1, Hongbin Sun1, J inx in Huang2, Qiang Zhang3 1Dept. of Electrical Engineering, Tsinghua University, Beijing, China 2State Grid of China Technology College, Jinan, China 3Shandong Electric Power Dispatching and Control Center, Jinan, China Email: [email protected], linbow[email protected], [email protected] Received March, 2013 ABSTRACT A static security assessment approach considering electro-thermal coupling of transmission lines is proposed in this paper. Combined with the dynamic thermal rating technology and energy forecasting, the approach can track both the electrical variables and transmission lines’ temperature varying trajectory under anticipated contingencies. Accordingly, it identifies the serious contingencies by transmission lines’ temperature violation rather than its power flow, in this case the time margin of temperature rising under each serious contingency can be prov ided to operators as warning in- formation and some unnecessary security control can also be avoided. Finally, numerical simulations are carried out to testify the validity of the proposed app roach. Keywords: Power System; Dynamic Thermal Rating; Static Security Assessment; Transmission Line; Electro-thermal Coupling 1. Introduction As an indispensable technology to guarantee the security operation of power grid, the on-line static security as- sessment (SSA) has been being focused by both aca- demic and engineering circles [1-3]. It takes charge of screening the anticipated contingencies, identifying seri- ous ones which cause voltage or thermal violation and providing warning information to operators as the im- portant basis for making preventive control decision for the serious contingencies. However, thermal limit (maximum permissible temperature) of transmission line has been being converted into limit on power flow or current in SSA, and the asynchronous between tempera- ture and current of transmission line (thermal inertia) is always ignored, this should be improved under new situation. There are two major reasons motivate the im- provement: (1) With the rapid increase of electric power generation & demand, the transfer capability of power grid is being pushed to its thermal limit, therefore, the traditional SSA which ignores the thermal inertia tends to impede the efficient utilization of the existing transfer capability of power grid. (2) As the massive power gen- erated by new energy resource integrates into power grid, the operating state of power grid is bec omin g more com- plication and changeful, under this case, the traditional SSA tends to provide warning information frequently by identifying the power flow violation, this correspond- ingly lead to the unnecessary security control operations. To address the issues mentioned above, it is essential to realize to consider the electro-thermal coupling rela- tion of transmission lin es and regards transmission lines’ temperature as their thermal limits in SSA, there are two essential conditions for the goal: (1) Operating tempera- ture & micro meteorological environment of transmis- sion lines are capable of being monitored and the data can be assembled in control center of power grid. (2) The improved power flow calculation which considers trans- mission lines’ temperature as state valuable should be performed fast enough to screen the anticipated contin- gencies and meet the need of online application. For the first condition, dynamic thermal rating (DTR) can be practicable, it was proposed in 1970s[4-5] and has been widely applied in some dev eloped countries in the end of 1990s[6-7], now its monitoring data (including tempera- ture and meteorological data) is integrated into SCADA, but it has not been combined organically with power system analysis and control. For the second condition, the electro-thermal coupling power flow[8] can be util- ized, but it must be simplified to reduce the calculation complication and time consuming. *This work is supported by National Key Basic Research Program o f China (2013CB228203), National Science Fund for Distinguished Young Scholars (51025725) and China Postdoctoral Science Founda- tion (2012M520271). Copyright © 2013 SciRes. EPE 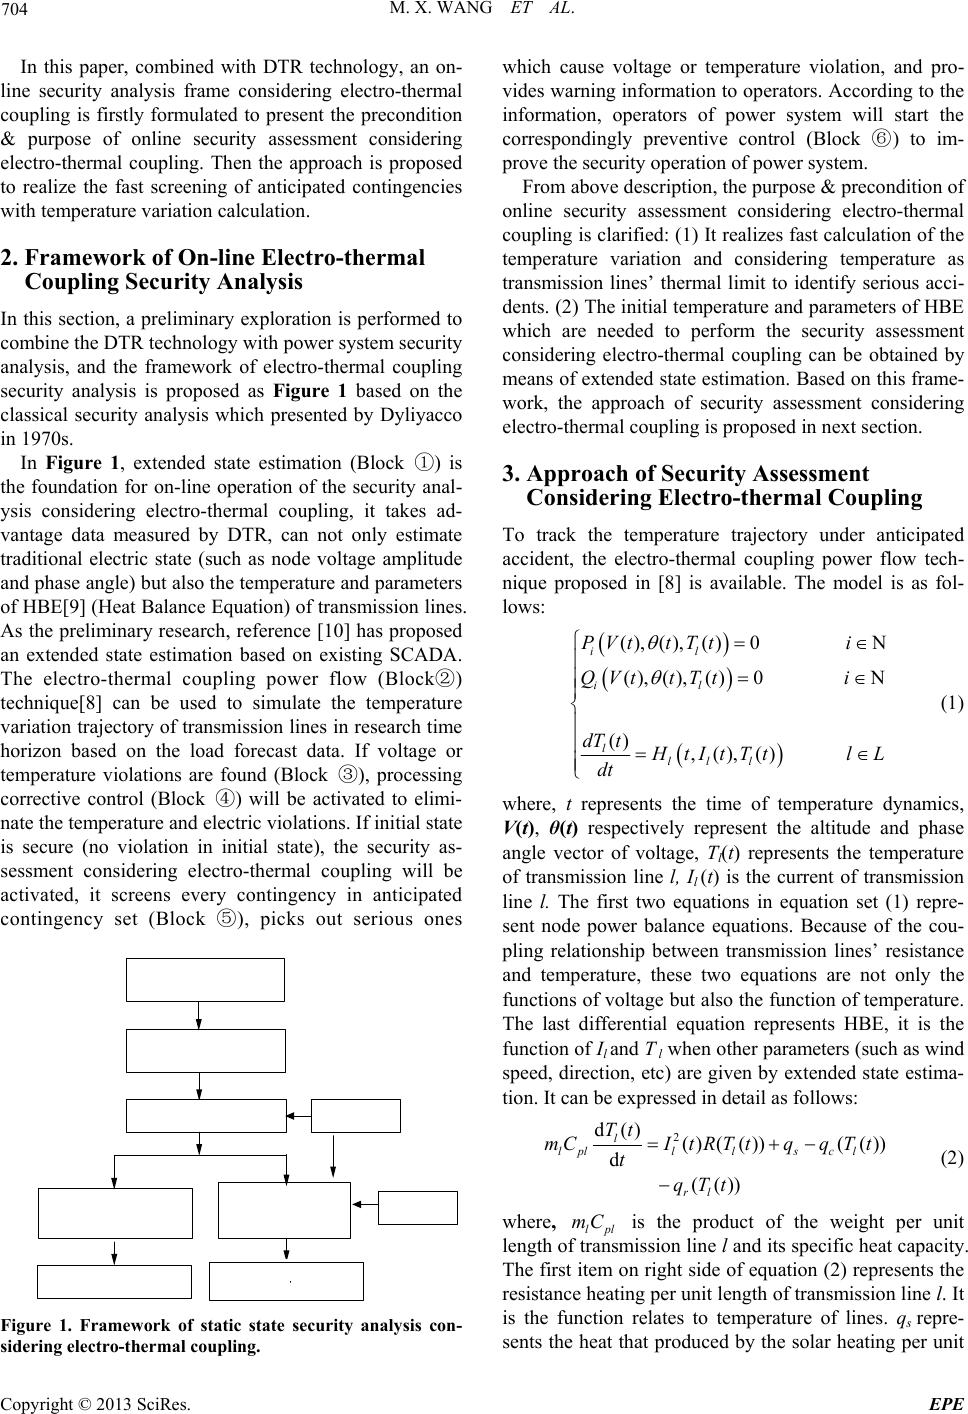 M. X. WANG ET AL. 704 In this paper, combined with DTR technology, an on- line security analysis frame considering electro-thermal coupling is firstly formulated to present the precondition & purpose of online security assessment considering electro-thermal coupling. Then the approach is proposed to realize the fast screening of anticipated contingencies with temperature variation calculation. 2. Framework of On-line Electro-thermal Coupling Security Analysis In this section, a preliminary exploration is performed to combine the DTR technology with power system security analysis, and the framework of electro-thermal coupling security analysis is proposed as Figure 1 based on the classical security analysis which presented by Dyliyacco in 1970s. In Figure 1, extended state estimation (Block ①) is the foundation for on-line operation of the security anal- ysis considering electro-thermal coupling, it takes ad- vantage data measured by DTR, can not only estimate traditional electric state (such as node voltage amplitude and phase angle) but also the temperature and parameters of HBE[9] (Heat Balance Equation) of transmission lines. As the preliminary research, reference [10] has proposed an extended state estimation based on existing SCADA. The electro-thermal coupling power flow (Block②) technique[8] can be used to simulate the temperature variation trajectory of tran smission lines in research time horizon based on the load forecast data. If voltage or temperature violations are found (Block ③), processing corrective control (Block ④) will be activated to elimi- nate the temperature and electric v iolations. If initial state is secure (no violation in initial state), the security as- sessment considering electro-thermal coupling will be activated, it screens every contingency in anticipated contingency set (Block ⑤), picks out serious ones Figure 1. Framework of static state security analysis con- sidering electro-thermal coupling. which cause voltage or temperature violation, and pro- vides warning information to operators. According to the information, operators of power system will start the correspondingly preventive control (Block ⑥) to im- prove the security operation of power system. From above description, the purpose & precond ition of online security assessment considering electro-thermal coupling is clarified: (1) It realizes fast calculation of the temperature variation and considering temperature as transmission lines’ thermal limit to identify serious acci- dents. (2) The initial te mperature and parameters of HBE which are needed to perform the security assessment considering electro-thermal coupling can be obtained by means of extended state estimation. Based on this frame- work, the approach of security assessment considering electro-thermal coupling is proposed in next section. 3. Approach of Security Assessment Considering Electro-thermal Coupling To track the temperature trajectory under anticipated accident, the electro-thermal coupling power flow tech- nique proposed in [8] is available. The model is as fol- lows: (),(),()0 N (),(),()0 N () ,(),() il il lll l PVttTti QVt tTti dT t H tI t TtlL dt (1) where, t represents the time of temperature dynamics, V(t), θ(t) respectively represent the altitude and phase angle vector of voltage, Tl(t) represents the temperature of transmission line l, Il (t) is the current of transmission line l. The first two equations in equation set (1) repre- sent node power balance equations. Because of the cou- pling relationship between transmission lines’ resistance and temperature, these two equations are not only the functions of voltage but also the function of temperature. The last differential equation represents HBE, it is the function of Il and T l when other parameters (such as wind speed, direction, etc) are given by extended state estima- tion. It can be expressed in detail as follows: 2 d() ()(()) (()) d (()) l lpllls cl rl Tt mCItRTtqqTt tqTt (2) where, lpl is the product of the weight per unit length of transmission line l and its specific heat capacity. The first item on right side of equation (2 ) represents the resistance heating per unit length of transmission line l. It is the function relates to temperature of lines. qs repre- sents the heat that produced by the solar heating per unit mC Copyright © 2013 SciRes. EPE 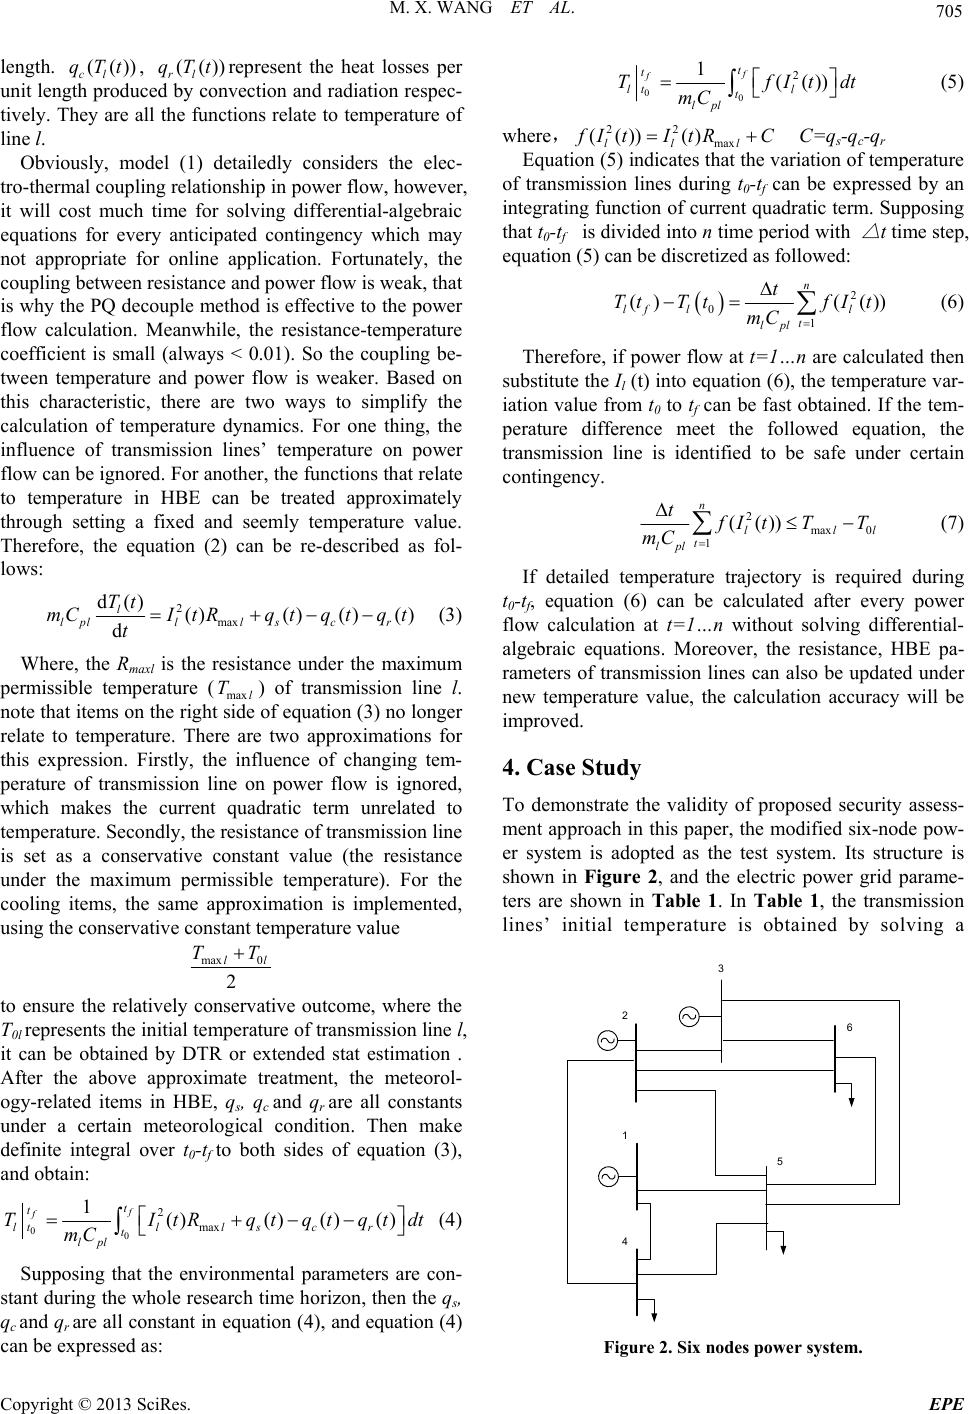 M. X. WANG ET AL. 705 length. , represent the heat losses per unit length produced by convection and radiation respec- tively. They are all the functions relate to temperature of line l. (()) cl qTt (()) rl qTt Obviously, model (1) detailedly considers the elec- tro-thermal coupling relationship in power flow, however, it will cost much time for solving differential-algebraic equations for every anticipated contingency which may not appropriate for online application. Fortunately, the coupling between resistance and power flow is weak, that is why the PQ decouple method is effective to the power flow calculation. Meanwhile, the resistance-temperature coefficient is small (always < 0.01). So the coupling be- tween temperature and power flow is weaker. Based on this characteristic, there are two ways to simplify the calculation of temperature dynamics. For one thing, the influence of transmission lines’ temperature on power flow can be ignored. For another, the functions that relate to temperature in HBE can be treated approximately through setting a fixed and seemly temperature value. Therefore, the equation (2) can be re-described as fol- lows: 2max () l ItR d( d l lpl Tt mC t )() () () l scr qtqtqt (3) Where, the Rmaxl is the resistance under the maximum permissible temperature (maxl T) of transmission line l. note that items on the r ight side of equation (3) no longer relate to temperature. There are two approximations for this expression. Firstly, the influence of changing tem- perature of transmission line on power flow is ignored, which makes the current quadratic term unrelated to temperature. Secondly, the resistance of transmission line is set as a conservative constant value (the resistance under the maximum permissible temperature). For the cooling items, the same approximation is implemented, using the conservative constant temperature value max 20ll TT to ensure the relatively conservative outcome, where the T0l represents the initial temperatu re of tran smission line l, it can be obtained by DTR or extended stat estimation . After the above approximate treatment, the meteorol- ogy-related items in HBE, qs, qc and qr are all constants under a certain meteorological condition. Then make definite integral over t0-tf to both sides of equation (3), and obtain: 0 1() () () f ft t lscr tt lpl Tqt qt qtdt mC 0 2max () ll I tR (4) Supposing that the environmental parameters are con- stant during the whole research time hor izon, then the qs, qc and qr are all constant in equation (4), and equation (4) can be expressed as: 00 2 1(()) f ft t l tt lpl TfI mC l tdt (5) where,22 max (()) () lll f It ItRC C=qs-qc-qr Equation (5) indicates that the v ariation of temperature of transmission lines during t0-tf can be expressed by an integrating function of current qu adratic term. Supposing that t0-tf is divided into n time period with △ t time step, equation (5) ca n be di screti z ed as followed: 2 01 () (()) n lf ll t lpl t TtTtfI t mC (6) Therefore, if power flow at t=1…n are calculated then substitute the Il (t) into equation (6), th e temperature var- iation value from t0 to tf can be fast obtained. If the tem- perature difference meet the followed equation, the transmission line is identified to be safe under certain contingency. 2max 0 1(()) n ll t lpl tl f It TT mC (7) If detailed temperature trajectory is required during t0-tf, equation (6) can be calculated after every power flow calculation at t=1…n without solving differential- algebraic equations. Moreover, the resistance, HBE pa- rameters of transmission lines can also be updated under new temperature value, the calculation accuracy will be improved. 4. Case Study To demonstrate the validity of proposed security assess- ment approach in this paper, the modified six-node pow- er system is adopted as the test system. Its structure is shown in Figure 2, and the electric power grid parame- ters are shown in Table 1. In Table 1, the transmission lines’ initial temperature is obtained by solving a 1 4 2 5 3 6 Figure 2. Six nodes power system. Copyright © 2013 SciRes. EPE 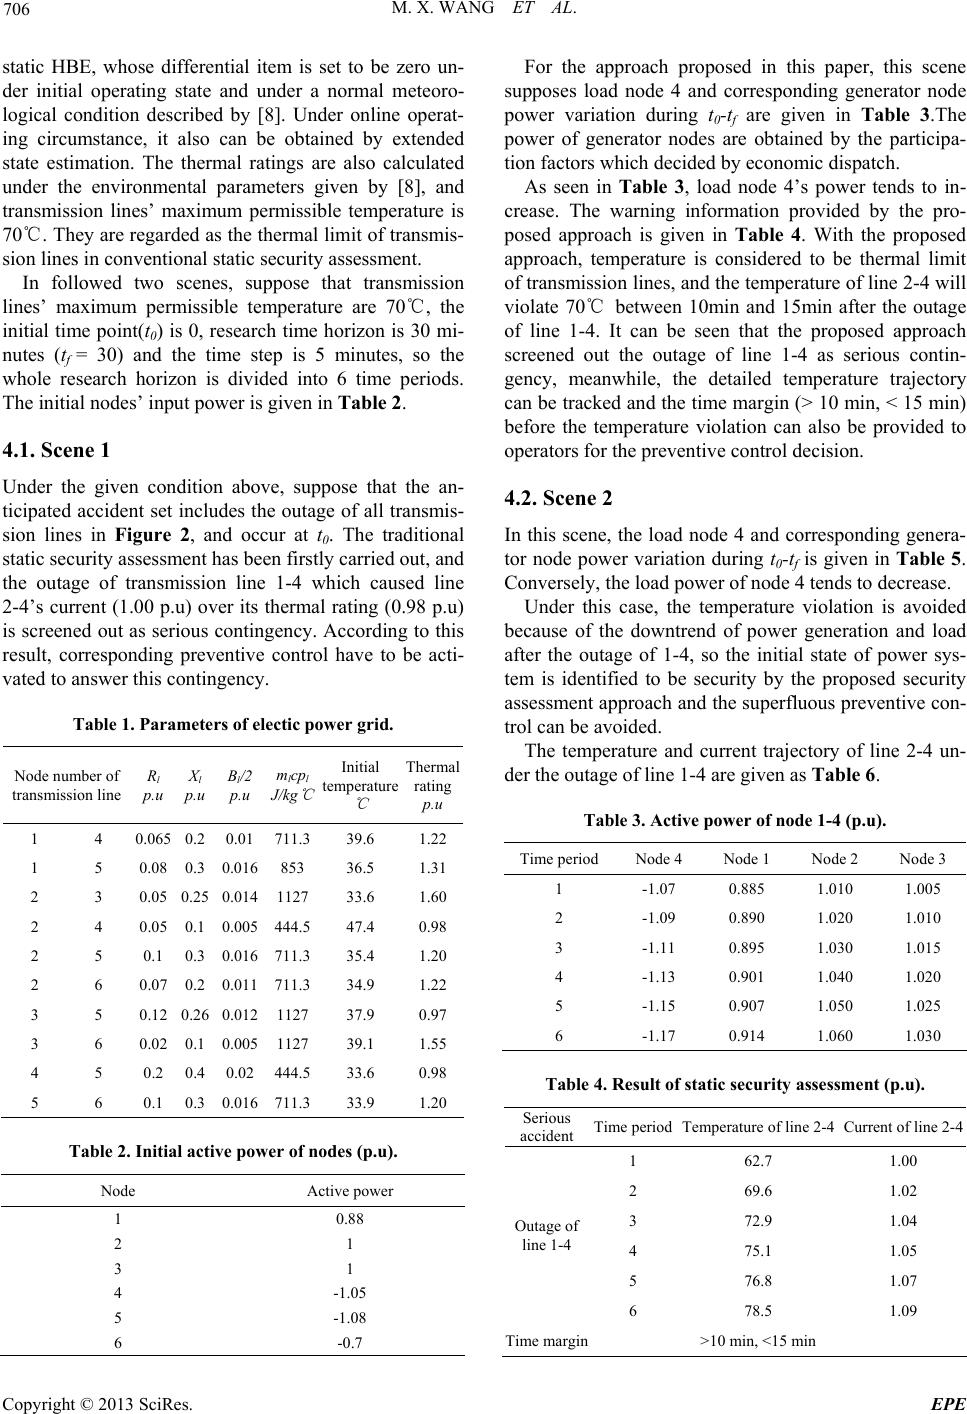 M. X. WANG ET AL. 706 static HBE, whose differential item is set to be zero un- der initial operating state and under a normal meteoro- logical condition described by [8]. Under online operat- ing circumstance, it also can be obtained by extended state estimation. The thermal ratings are also calculated under the environmental parameters given by [8], and transmission lines’ maximum permissible temperature is 70℃. They are regarded as the thermal limit of transmis- sion lines in conventional static security assessment. In followed two scenes, suppose that transmission lines’ maximum permissible temperature are 70℃, the initial time point(t0) is 0, research time horizon is 30 mi- nutes (tf = 30) and the time step is 5 minutes, so the whole research horizon is divided into 6 time periods. The initial nodes’ input power is given in Table 2. 4.1. Scene 1 Under the given condition above, suppose that the an- ticipated accident set includes the outage of all transmis- sion lines in Figure 2, and occur at t0. The traditional static security assessment has been firstly carried out, and the outage of transmission line 1-4 which caused line 2-4’s current (1.00 p.u) over its thermal rating (0.98 p.u) is screened out as serious contin gency. According to this result, corresponding preventive control have to be acti- vated to answer this con tingency. Table 1. Paramete r s of electic power grid. Node number of transmission line Rl p.u Xl p.u Bl/2 p.u mlcpl J/kg ℃ Initial temperature ℃ Thermal rating p.u 1 4 0.065 0.2 0.01711.3 39.6 1.22 1 5 0.08 0.3 0.016 853 36.5 1.31 2 3 0.05 0.25 0.014 1127 33.6 1.60 2 4 0.05 0.1 0.005 444.5 47.4 0.98 2 5 0.1 0.3 0.016 711.3 35.4 1.20 2 6 0.07 0.2 0.011 711.3 34.9 1.22 3 5 0.12 0.26 0.012 1127 37.9 0.97 3 6 0.02 0.1 0.005 1127 39.1 1.55 4 5 0.2 0.4 0.02444.5 33.6 0.98 5 6 0.1 0.3 0.016 711.3 33.9 1.20 Table 2. Initial active power of nodes (p.u). Node Active power 1 0.88 2 1 3 1 4 -1.05 5 -1.08 6 -0.7 For the approach proposed in this paper, this scene supposes load node 4 and corresponding generator node power variation during t0-tf are given in Table 3.The power of generator nodes are obtained by the participa- tion fact ors whic h decided b y economic dispat c h. As seen in Table 3, load node 4’s power tends to in- crease. The warning information provided by the pro- posed approach is given in Table 4. With the proposed approach, temperature is considered to be thermal limit of transmission lin es, and the temperature of line 2-4 will violate 70℃ between 10min and 15min after the outage of line 1-4. It can be seen that the proposed approach screened out the outage of line 1-4 as serious contin- gency, meanwhile, the detailed temperature trajectory can be tracked and the time margin (> 10 min, < 15 min) before the temperature violation can also be provided to operators for t he p r eventive control d e c i s i on. 4.2. Scene 2 In this scene, the load node 4 and corresponding genera- tor node power variation during t0-tf is given in Table 5. Conversely, the load power of node 4 tends to decrease. Under this case, the temperature violation is avoided because of the downtrend of power generation and load after the outage of 1-4, so the initial state of power sys- tem is identified to be security by the proposed security assessment approach and the superfluous preventive con- trol can be avoided. The temperature and current trajectory of line 2-4 un- der the outage of line 1-4 a re given as Table 6. Table 3. Active power of node 1-4 (p.u). Time period Node 4 Node 1 Node 2 Node 3 1 -1.07 0.885 1.010 1.005 2 -1.09 0.890 1.020 1.010 3 -1.11 0.895 1.030 1.015 4 -1.13 0.901 1.040 1.020 5 -1.15 0.907 1.050 1.025 6 -1.17 0.914 1.060 1.030 Table 4. Result of static security assessment (p.u). Serious accident Time periodTemperature of line 2-4 Current of line 2-4 1 62.7 1.00 2 69.6 1.02 3 72.9 1.04 4 75.1 1.05 5 76.8 1.07 Outage of line 1-4 6 78.5 1.09 Time margin >10 min, <15 min Copyright © 2013 SciRes. EPE 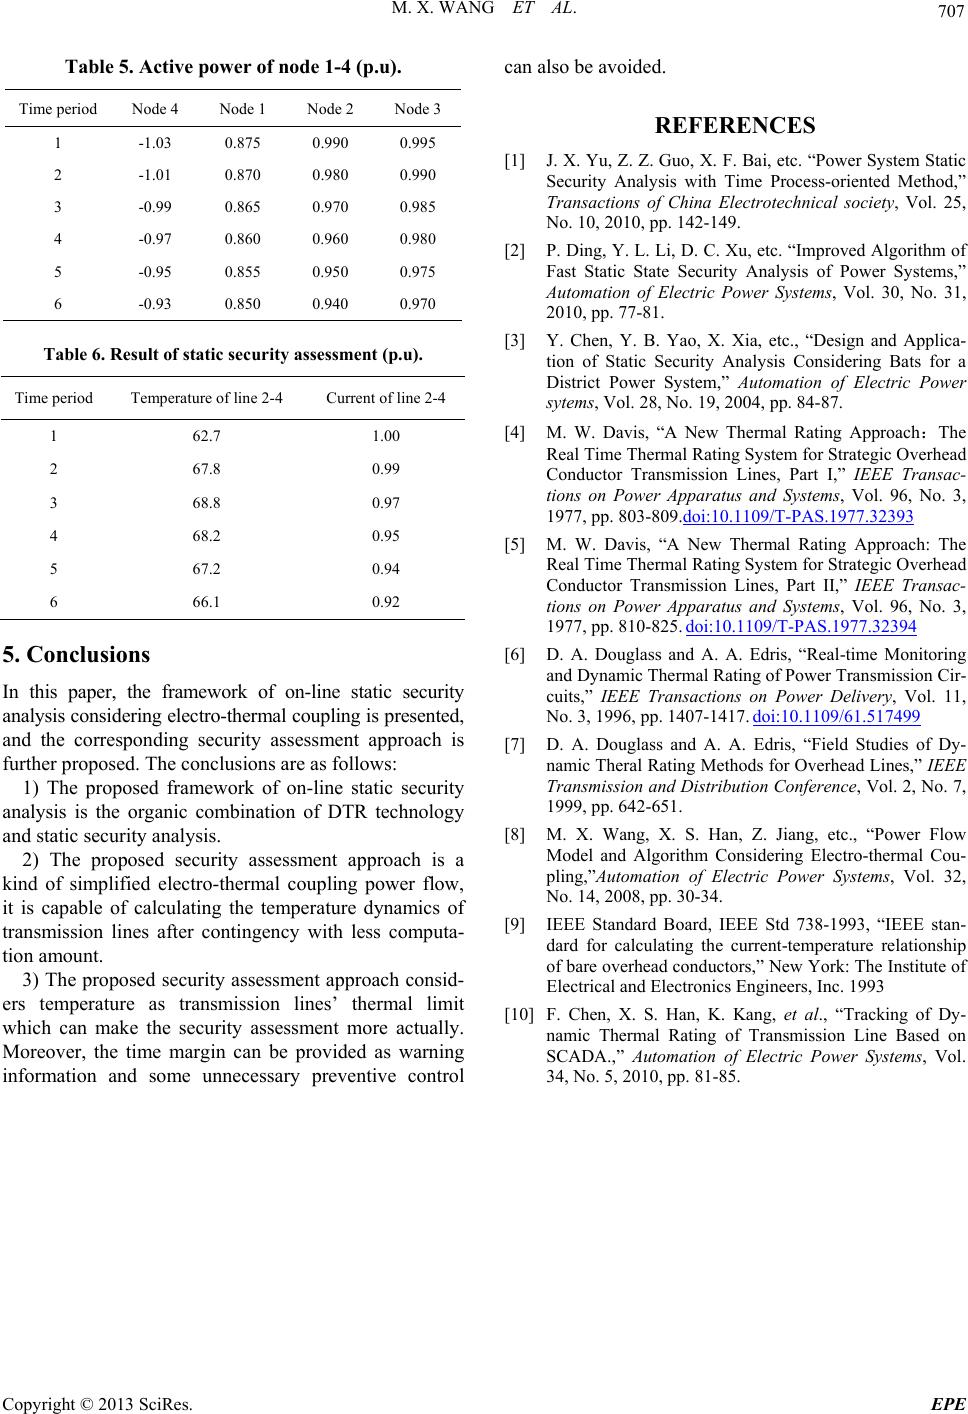 M. X. WANG ET AL. Copyright © 2013 SciRes. EPE 707 Table 5. Active power of node 1-4 (p.u). Time period Node 4 Node 1 Node 2 Node 3 1 -1.03 0.875 0.990 0.995 2 -1.01 0.870 0.980 0.990 3 -0.99 0.865 0.970 0.985 4 -0.97 0.860 0.960 0.980 5 -0.95 0.855 0.950 0.975 6 -0.93 0.850 0.940 0.970 Table 6. Result of static security assessment (p.u). Time period Temperature of line 2-4 Current of line 2- 4 1 62.7 1.00 2 67.8 0.99 3 68.8 0.97 4 68.2 0.95 5 67.2 0.94 6 66.1 0.92 5. Conclusions In this paper, the framework of on-line static security analysis considering electro-ther mal coupling is presented, and the corresponding security assessment approach is further proposed. The conclusions are as follows: 1) The proposed framework of on-line static security analysis is the organic combination of DTR technology and static security analysis. 2) The proposed security assessment approach is a kind of simplified electro-thermal coupling power flow, it is capable of calculating the temperature dynamics of transmission lines after contingency with less computa- tion amount. 3) The proposed security assessment approach consid- ers temperature as transmission lines’ thermal limit which can make the security assessment more actually. Moreover, the time margin can be provided as warning information and some unnecessary preventive control can also be avoided. REFERENCES [1] J. X. Yu, Z. Z. Guo, X. F. Bai, etc. “Power System Static Security Analysis with Time Process-oriented Method,” Transactions of China Electrotechnical society, Vol. 25, No. 10, 2010, pp. 142-149. [2] P. Ding, Y. L. Li, D. C. Xu, etc. “Improved Algorithm of Fast Static State Security Analysis of Power Systems,” Automation of Electric Power Systems, Vol. 30, No. 31, 2010, pp. 77-81. [3] Y. Chen, Y. B. Yao, X. Xia, etc., “Design and Applica- tion of Static Security Analysis Considering Bats for a District Power System,” Automation of Electric Power sytems, Vol. 28, No. 19, 2004, pp. 84-87. [4] M. W. Davis, “A New Thermal Rating Approach:The Real Time Thermal Rating System for Strategic Overhead Conductor Transmission Lines, Part I,” IEEE Transac- tions on Power Apparatus and Systems, Vol. 96, No. 3, 1977, pp. 803-809.doi:10.1109/T-PAS.1977.32393 [5] M. W. Davis, “A New Thermal Rating Approach: The Real Time Thermal Rating System for Strategic Overhead Conductor Transmission Lines, Part II,” IEEE Transac- tions on Power Apparatus and Systems, Vol. 96, No. 3, 1977, pp. 810-825. doi:10.1109/T-PAS.1977.32394 [6] D. A. Douglass and A. A. Edris, “Real-time Monitoring and Dynamic Thermal Rating of Power Transmission Cir- cuits,” IEEE Transactions on Power Delivery, Vol. 11, No. 3, 1996, pp. 1407-1417. doi:10.1109/61.517499 [7] D. A. Douglass and A. A. Edris, “Field Studies of Dy- namic Theral Rating Methods for Overhead Lines,” IEEE Transmission and Distribution Conference, Vol. 2, No. 7, 1999, pp. 642-651. [8] M. X. Wang, X. S. Han, Z. Jiang, etc., “Power Flow Model and Algorithm Considering Electro-thermal Cou- pling,”Automation of Electric Power Systems, Vol. 32, No. 14, 2008, pp. 30-34. [9] IEEE Standard Board, IEEE Std 738-1993, “IEEE stan- dard for calculating the current-temperature relationship of bare overhead conductors,” New York: The Institute of Electrical and Electronics Engineers, Inc. 1993 [10] F. Chen, X. S. Han, K. Kang, et al., “Tracking of Dy- namic Thermal Rating of Transmission Line Based on SCADA.,” Automation of Electric Power Systems, Vol. 34, No. 5, 2010, pp. 81-85. |