

Paper Menu >>
Journal Menu >>
 Engineering, 2013, 5, 284-291 http://dx.doi.org/10.4236/eng.2013.510B059 Published Online October 2013 (http://www.scirp.org/journal/eng) Copyright © 2013 SciRes. ENG Mean Threshold and ARNN Algorithms for Identification of Eye Commands in an EEG-Contr olled Wheelchair Nguyen Thanh Hai1, Nguyen Van Trung2, Vo Van Toi1 1Biomedical Engineering Department, International University, Vietnam National University, Ho Chi Minh City, Vietnam 2Faculty of Ele ctrical-Electronics Engineering, University of Technical Education, Ho Chi Minh City, Vietnam Email: [email protected] Received July 2013 ABSTRACT This paper represented Autoregressive Neural Network (ARNN) and meant threshold methods for recognizing eye movements for control of an electrical wheelchair using EEG technology. The eye movements such as eyes open, eyes blinks, glancing left and glancing right related to a few areas of human brain were investigated. A Hamming low pass filter was applied to remove noise and artifacts of the eye signals and to extract the frequency range of the measured signals. An autoregressive model was employed to produce coefficients containing features of the EEG eye signals. The coefficients obtained were inserted the input layer of a neural network model to classify the eye activities. In addition, a mean threshold algorithm was employed for classifying eye movements. Two metho ds were compared to find the better one for applying in the wheelchair control to follow users to reach the desired direction. Experimental results of con- trolling the wheelchair in the indoor environment illustr ated the effectiveness of the proposed approaches. Keywords: Autoregre ss ive NN Mo de l ; Threshold algorithm; EEG Technology; Eye Activity and Electrical Wheelchair 1. Introduction Human brain plays an important role in controlling all body activities [1]. Moreover, it is a complex structure, in which there are about around 100 billion neurons which communicate from one to another with or without external excitations to make control decisions (cognition, motion, pattern recognition, etc.). For these reasons, non- invasive technologies such as EEG, functional Magnetic Resonance Imaging (fMRI) and functional Near-infrared Spectroscopy (fNIRS) have been investigated to quantify motor proc e s s ing funct i on of huma n bra in [2-4]. Thus the exploration of these technologies can allow us to perform rehabilitative problems or brain simulator leading to im- prove or recover the motor/cognitive functions of tetrap- legic patients with spinal cord injuries and degenerative nerve diseases. In recent years, EEG technology has quickly devel- oped and also attracted many researchers related to hu- man brain. Many Brain-computer Interface (BCI) appli- cations as well as Brain-based diagnoses have been suc- cessfully represented, in which BCI problems have been investigated to implement on human in recent years. In particular, a BCI system can allow people to communi- cate and to control external devices [5-7]. It means that one can translate brain activities into messages or com- mands to control devices [8-10]. Blankertz et al. devel- oped the non-invasive BCI system, in which the key fea- tures were considered to predict the laterality of upcom- ing left vs. right hand movements to produce the result of very high information transfer rate. An EEG system has been used to measure delta signal of human brain corresponding to eye blinks [11]. However, to determine the problem of eye activities, a threshold algorithm was employed to control electric wheelchair. In this paper, we develop a neural network model [12-14], in which the inputs of the network are AR coefficients [15] which were determined based on the filtered EEG signals using a Hamming lowpass filter from the identi- fied outputs of the network. In addition, a threshold algo- rithm is employed to find the m ean thresholds for eye move- ments. In this res earch, two of these methods will be com- pared to determine the best one to control the wheelchair. 2. Materials and Methods 2.1. Data Acquisition Data at Fp1, F7, F8 areas of human brain were obtained from an Active-Two system as shown in Figure 1. Nine subjects (males and females, average age: 22 ± 5.33) were invited to participate into this study. The subjects informed consents agreement after reading and under- standing of the experiment protocol and the EEG tech- 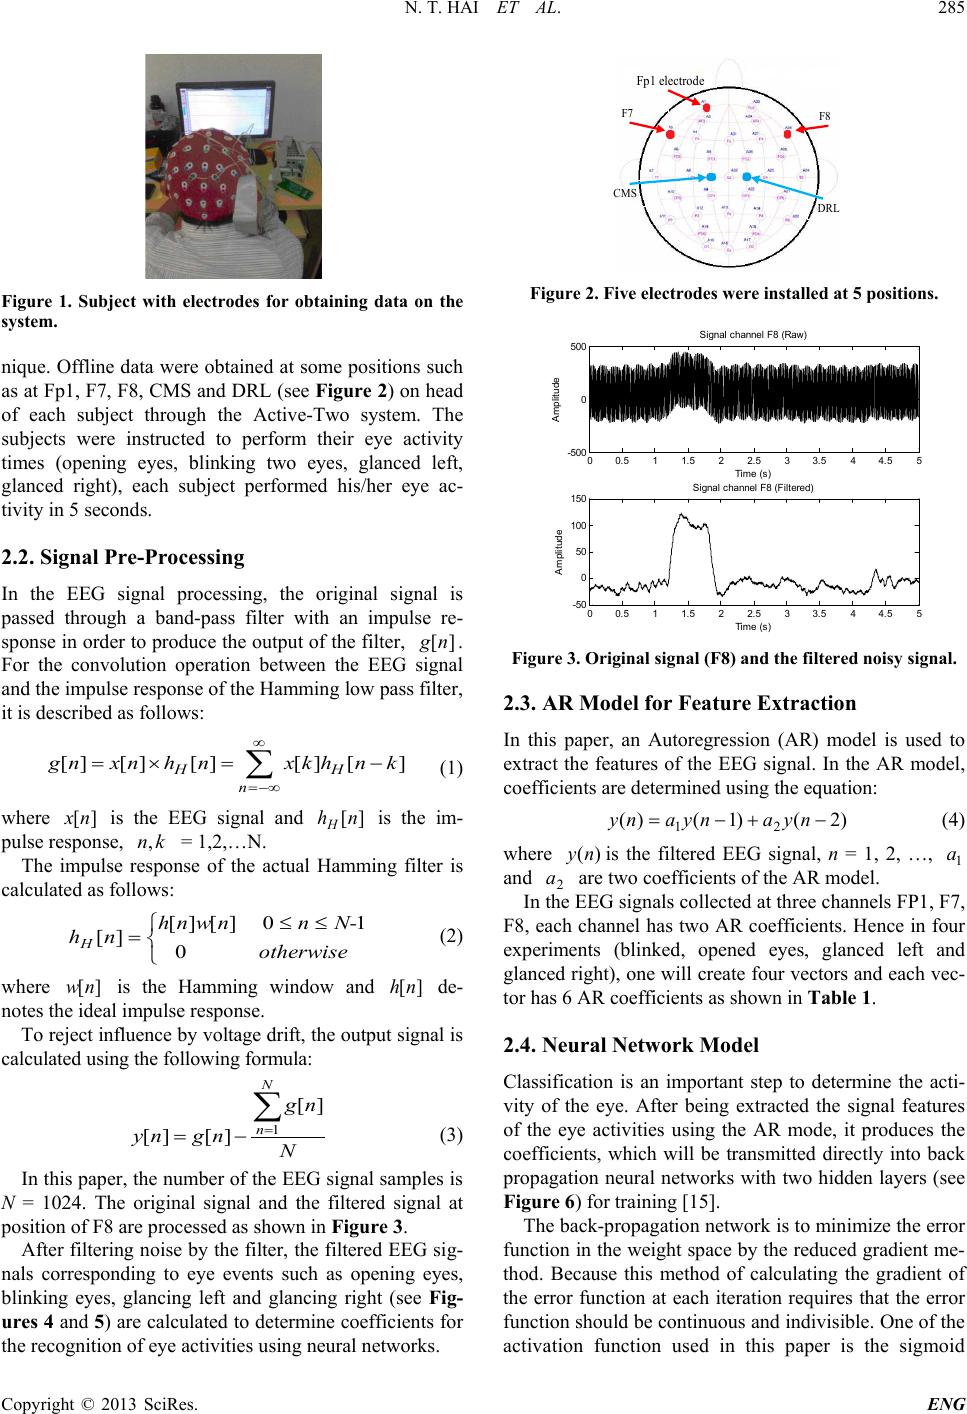 N. T. HAI ET AL. Copyright © 2013 SciRes. ENG 285 Figure 1. Subject with electrodes for obtaining data on the system. nique. Offline data were obtained at some positions such as at Fp1, F 7, F8, CMS and DR L (see Figure 2) on h ead of each subject through the Active-Two system. The subjects were instructed to perform their eye activity times (opening eyes, blinking two eyes, glanced left, glanced right), each subject performed his/her eye ac- tivity in 5 seconds. 2.2. Signal Pre-Processing In the EEG signal processing, the original signal is passed through a band-pass filter with an impulse re- sponse in ord er to produce the output of the filter , ][ ng . For the convolution operation between the EEG signal and the impulse response of the Hamming low pass filter, it is described as follows: [][][][] [] HH n gnxnh nxkhnk ∞ =−∞ =×= − ∑ (1) where ][ nx is the EEG signal and ][nhH is the im- pulse response, kn, = 1,2,…N. The impulse response of the actual Hamming filter is calculated as follows: ≤≤ =otherwise N-n nwnh nhH0 10][][ ][ (2 ) where ][nw is the Hamming window and ][nh de- notes the ideal impulse response. To reject influence by voltage drift, the output signal is calcula te d using the f ollowing formula: N ng ngny N n ∑ = −= 1 ][ ][][ (3) In this paper, the number of the EEG signal samples is N = 1024. The original signal and the filtered signal at position of F8 are processed as shown in Figure 3. After filtering noise by the filter, th e filtered EEG sig- nals corresponding to eye events such as opening eyes, blinking eyes, glancing left and glancing right (see Fig- ures 4 and 5) are calculated to determine coefficients for the recognition of eye activities using neural networ ks. Figure 2. Five electrodes were installed at 5 positions. Figure 3. Original signal (F8) and the filtered noisy signal. 2.3. AR Model for Feature Extraction In this paper, an Autoregression (AR) model is used to extract the features of the EEG signal. In the A R model, coefficients are determined using the equation: )2()1()( 21 −+−= nyanyany (4) where )(ny is the filtered EEG signal, n = 1, 2, …, 1 a and 2 a are two coefficients of the AR model. In the EEG signals collected at three channels FP1, F7, F8, each channel has two AR coefficients. H ence in four experiments (blinked, opened eyes, glanced left and glanced right), one will create four vectors and each vec- tor has 6 AR coefficients as shown in Table 1. 2.4. Neural Network Model Classification is an important step to determine the acti- vity of the eye. After being extracted the signal features of the eye activities using the AR mode, it produces the coefficients, which will be transmitted directly into back propagation neural networks with two hidden layers (see Figure 6) for training [15]. The back-propagation network is to minimize the erro r function in the weight space by the reduced gradient me- thod. Because this method of calculating the gradient of the error function at each iteration requires that the error function should be continuous and indivisible. One of the activation function used in this paper is the sigmoid CMS F7 F8 DRL Fp1 electrode 00.5 11.5 22.5 33.5 44.5 5 -500 0 500 Si gnal channel F 8 (Raw) Ti me (s) Amplitude 00.5 11.5 22.5 33.5 44.5 5 -50 0 50 100 150 Si gnal channel F 8 (Fi l tered) Ti me (s) Amplitude 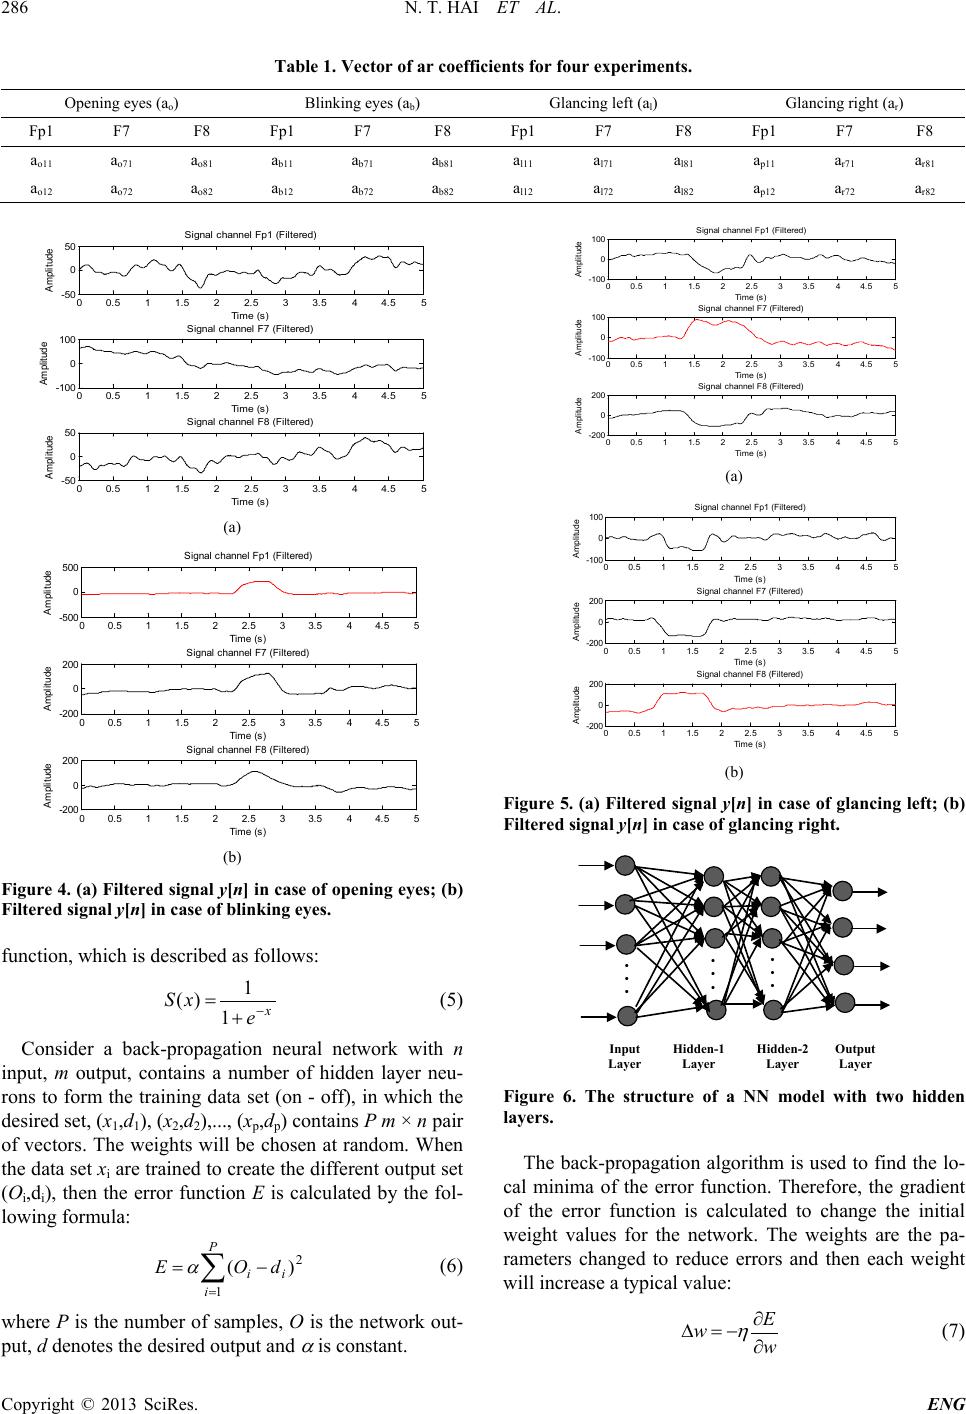 N. T. HAI ET AL. Copyright © 2013 SciRes. ENG 286 Table 1. Vector of ar coefficients for four experiments. Opening eyes (ao) Blinking eyes (ab) Glancing left (al) Glancing right (ar) Fp1 F7 F8 Fp1 F7 F8 Fp1 F7 F8 Fp1 F7 F8 ao11 ao71 ao81 ab11 ab71 ab81 al11 al71 al81 ap11 ar71 ar81 ao12 ao72 ao82 ab12 ab72 ab82 al12 al72 al82 ap12 ar72 ar82 (a) (b) Figure 4. (a) Filtered signal y[n] in case of opening eyes; (b) Filtered signal y[n] in case of blinking eyes . function, which is described as follows: x e xS − + =1 1 )( (5) Consider a back-propagation neural network with n input, m output, contains a number of hidden layer neu- rons to form the training data set (on - off), in which the desired set, (x1,d1), (x2,d2),..., (xp,dp) contains P m × n pair of vectors. The weights will be chosen at random. When the data set xi are trained to create the different outpu t set (Oi,di), then the error function E is calculated by the fol- lowing f ormula: ∑ = −= P i ii dOE 1 2 )( α (6) where P is the number of samples, O is the network out- put, d de n otes the de s i r ed output and α is constant. (a) (b) Figure 5. (a) Filtered signal y[n] in case of glancing left; (b) Filtered signal y[n] in case of glancing right. Figure 6. The structure of a NN model with two hidden layers. The back-propagation algorithm is used to find the lo- cal minima of the error function. Therefore, the gradient of the error function is calculated to change the initial weight values for the network. The weights are the pa- rameters changed to reduce errors and then each weight will increase a typical value: w E w∂ ∂ −=∆ η (7) 00.5 11.5 22.5 33.5 44.5 5 -50 0 50 Si gnal channel F p1 (Fi l tered) Ti me (s) Ampl itude 00.5 11.5 22.5 33.5 44.5 5 -100 0 100 Si gnal channel F 7 (Fi l tered) Ti me (s) Ampl itude 00.5 11.5 22.5 33.5 44.5 5 -50 0 50 Si gnal channel F 8 (Fi l tered) Ti me (s) Ampl itude 00.5 11.5 22.5 33.5 44.5 5 -500 0 500 Si gnal channel F p1 (Fi l tered) Ti me (s) Amplitude 00.5 11.5 22.5 33.5 44.5 5 -200 0 200 Si gnal channel F7 (F i l t ered) Ti me (s) Amplitude 00.5 11.5 22.5 33.5 44.5 5 -200 0 200 Si gnal channel F8 (F i l t ered) Ti me (s) Amplitude 00.5 11.5 22.5 33.5 44.5 5 -100 0 100 Si gnal channel F p1 (F il tered) Ti me (s) Amplitude 00.5 11.5 22.5 33.5 44.5 5 -100 0 100 Si gnal channel F 7 (F il tered) Ti me (s) Amplitude 00.5 11.5 22.5 33.5 44.5 5 -200 0 200 Si gnal channel F 8 (F il tered) Ti me (s) Amplitude 00.5 11.5 22.5 33.5 44.5 5 -100 0 100 Si gnal channel Fp1 (F i l t ered) Ti me ( s) Amplitude 00.5 11.5 22.5 33.5 44.5 5 -200 0 200 Si gnal channel F7 (F i l t ered) Ti me ( s) Amplitude 00.5 11.5 22.5 33.5 44.5 5 -200 0 200 Si gnal channel F8 (F i l t ered) Ti me ( s) Amplitude • • • • • • • • • Input Layer Hidden-1 Layer Output Layer Hidden-2 Layer 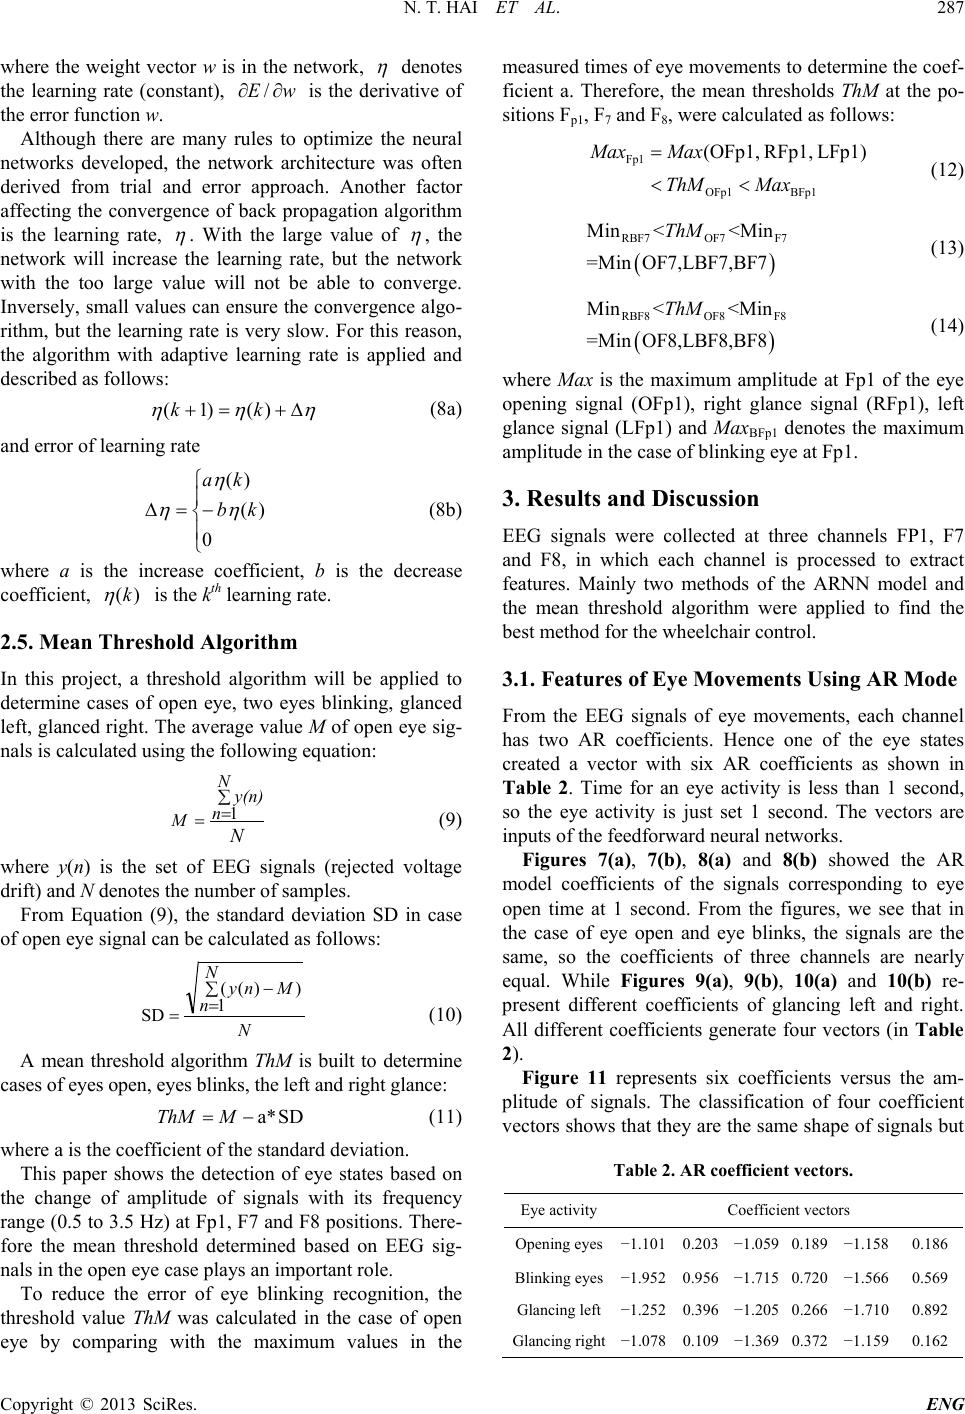 N. T. HAI ET AL. Copyright © 2013 SciRes. ENG 287 where the weight vector w is in the network, η denotes the learning rate (constant), wE ∂∂ / is the derivative of the error function w. Although there are many rules to optimize the neural networks developed, the network architecture was often derived from trial and error approach. Another factor affecting the convergence of back propagation algorithm is the learning rate, η . With the large value of η , the network will increase the learning rate, but the network with the too large value will not be able to converge. Inversely, small values can ensure the convergence algo- rithm, but the learning rate is very slow. For this reason, the algorithm with adaptive learning rate is applied and described as follows: ηηη ∆+=+ )()1( kk (8a) and error of learning rate −=∆ 0 )( )( kb ka η η η (8b) where a is the increase coefficient, b is the decrease coefficient, )(k η is the kth learning rate. 2.5. Mean Threshold Algorithm In this project, a threshold algorithm will be applied to determine cases of open eye, two eyes blinking, glanced left, glanced right. The average value M of open eye sig- nals is calculated using the following equation: N N ny(n) M ∑ = =1 (9) where y(n) is the set of EEG signals (rejected voltage drift) and N denotes the number of samples. From Equation (9), the standard deviation SD in case of open eye signal can be calculated as follows: N N nMny ∑ =− =1))(( SD (10) A mean threshold algorithm ThM is built to determine cases of eyes open, eyes blinks, the left and right glance: SDa*−= MThM (11) where a is the coefficient of the standard deviation. This paper shows the detection of eye states based on the change of amplitude of signals with its frequency range (0.5 to 3.5 Hz) at Fp1, F7 and F8 positions. There- fore the mean threshold determined based on EEG sig- nals in the open eye case plays an important role. To reduce the error of eye blinking recognition, the threshold value ThM was calculated in the case of open eye by comparing with the maximum values in the measured times of eye movements to determine the coef- ficient a. Therefore, the mean thresholds ThM at the po- sitions Fp1, F7 and F 8, w ere calculated as follows: Fp1 OFp1 BFp1 (OFp1, R F p1, LF p1)Max Max ThM Max = << (12) ( ) RBF7OF7 F7 Min <<Min =Min OF7,LBF7,BF7 ThM (13) ( ) RBF8OF8 F8 Min <<Min =Min OF8,LBF8,BF8 ThM (14) where Max is the maximum amplitude at Fp1 of the eye opening signal (OFp1), right glance signal (RFp1), left glance signal (LFp1) and MaxBFp1 denotes the maximum amplitude in the case of blinking eye at Fp1. 3. Results and Discussion EEG signals were collected at three channels FP1, F7 and F8, in which each channel is processed to extract features. Mainly two methods of the ARNN model and the mean threshold algorithm were applied to find the best method for the wheelchair control. 3.1. Features of Eye Movements Using AR Mode From the EEG signals of eye movements, each channel has two AR coefficients. Hence one of the eye states created a vector with six AR coefficients as shown in Table 2. Time for an eye activity is less than 1 second, so the eye activity is just set 1 second. The vectors are inputs of the feedforward neural networks. Figures 7(a), 7(b), 8(a) and 8(b) showed the AR model coefficients of the signals corresponding to eye open time at 1 second. From the figures, we see that in the case of eye open and eye blinks, the signals are the same, so the coefficients of three channels are nearly equal. While Figures 9(a), 9(b), 10(a) and 10(b) re- present different coefficients of glancing left and right. All different coefficients generate four vectors (in Table 2). Figure 11 represents six coefficients versus the am- plitude of signals. The c la ssification of four coefficient vectors shows that they are the same shape of signals but Table 2. AR coefficient vectors. Eye activity Coefficient vectors Opening eyes −1.101 0.203 −1.059 0.189 −1.158 0.186 Blinking eyes −1.952 0.956 −1.715 0.720 −1.566 0.569 Glancing left −1.252 0.396 −1.205 0.266 −1.710 0.892 Glancing right −1.078 0.109 −1.369 0.372 −1.159 0.162 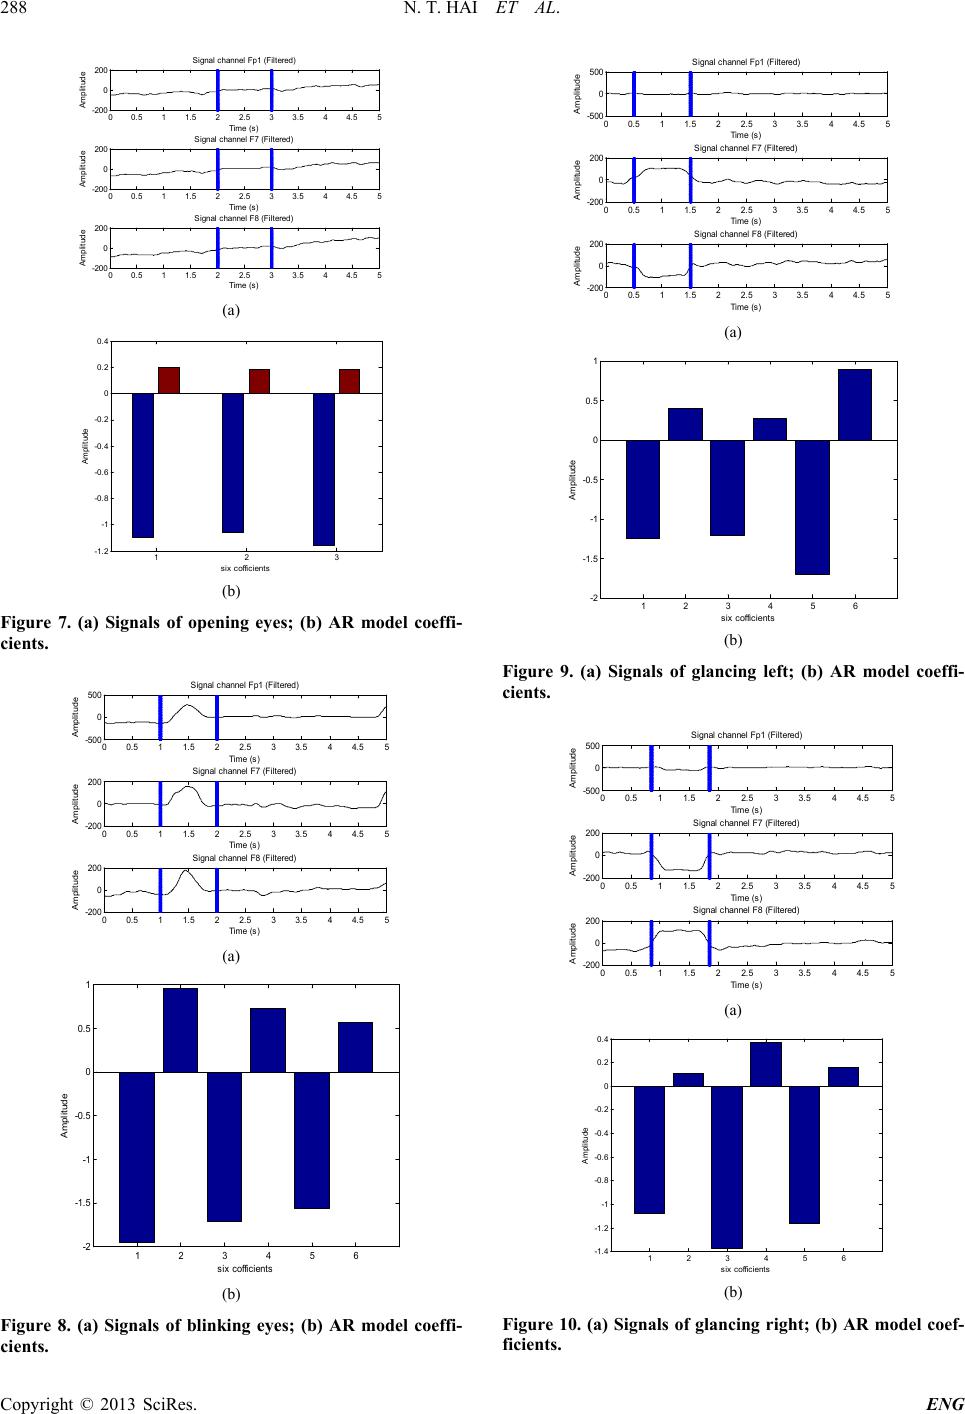 N. T. HAI ET AL. Copyright © 2013 SciRes. ENG 288 (a) (b) Figure 7. (a) Signals of opening eyes; (b) AR model coeffi- cients. (a) (b) Figure 8. (a) Signals of blinking eyes; (b) AR model coeffi- cients. (a) (b) Figure 9. (a) Signals of glancing left; (b) AR model coeffi- cients. (a) (b) Figure 10. (a) Signals of glancing right; (b) AR model coef- ficients. 00.5 11.5 22.5 33.5 44.5 5 -200 0 200 Si gnal channel F p1 (F il tered) Ti me (s) Ampli tude 00.5 11.5 22.5 33.5 44.5 5 -200 0 200 Si gnal channel F 7 (F il tered) Ti me (s) Ampli tude 00.5 11.5 22.5 33.5 44.5 5 -200 0 200 Si gnal channel F 8 (F il tered) Ti me (s) Ampli tude 123 -1.2 -1 -0.8 -0.6 -0.4 -0.2 0 0.2 0.4 six cofficients Ampli tude 00.5 11.5 22.5 33.5 44.5 5 -500 0 500 Si gnal channel Fp1 (F i l t ered) Ti me ( s) Ampli tude 00.5 11.5 22.5 33.5 44.5 5 -200 0 200 Si gnal channel F7 (F i l t ered) Ti me ( s) Ampli tude 00.5 11.5 22.5 33.5 44.5 5 -200 0 200 Si gnal channel F8 (F i l t ered) Ti me ( s) Ampli tude 123456 -2 -1.5 -1 -0.5 0 0.5 1 six cofficients Amplitude 00.5 11.5 22.5 33.5 44.5 5 -500 0 500 Signal channel F p1 (Fi l tered) Ti me ( s) Ampli tude 00.5 11.5 22.5 33.5 44.5 5 -200 0 200 Signal channel F 7 (Fi l tered) Ti me ( s) Ampli tude 00.5 11.5 22.5 33.5 44.5 5 -200 0 200 Signal channel F 8 (Fi l tered) Ti me ( s) Ampli tude 123456 -2 -1.5 -1 -0.5 0 0.5 1 six cofficients Amplit ude 00.5 11.5 22.5 33.5 44.5 5 -500 0 500 Si gnal channel Fp1 (F i l t ered) Ti me ( s) Amplitude 00.5 11.5 22.5 33.5 44.5 5 -200 0 200 Si gnal channel F7 (F i l t ered) Ti me ( s) Amplitude 00.5 11.5 22.5 33.5 44.5 5 -200 0 200 Si gnal channel F8 (F i l t ered) Ti me ( s) Amplitude 1 2 3 4 5 6 -1. 4 -1. 2 -1 -0. 8 -0. 6 -0. 4 -0. 2 0 0.2 0.4 six cofficients Ampli tude 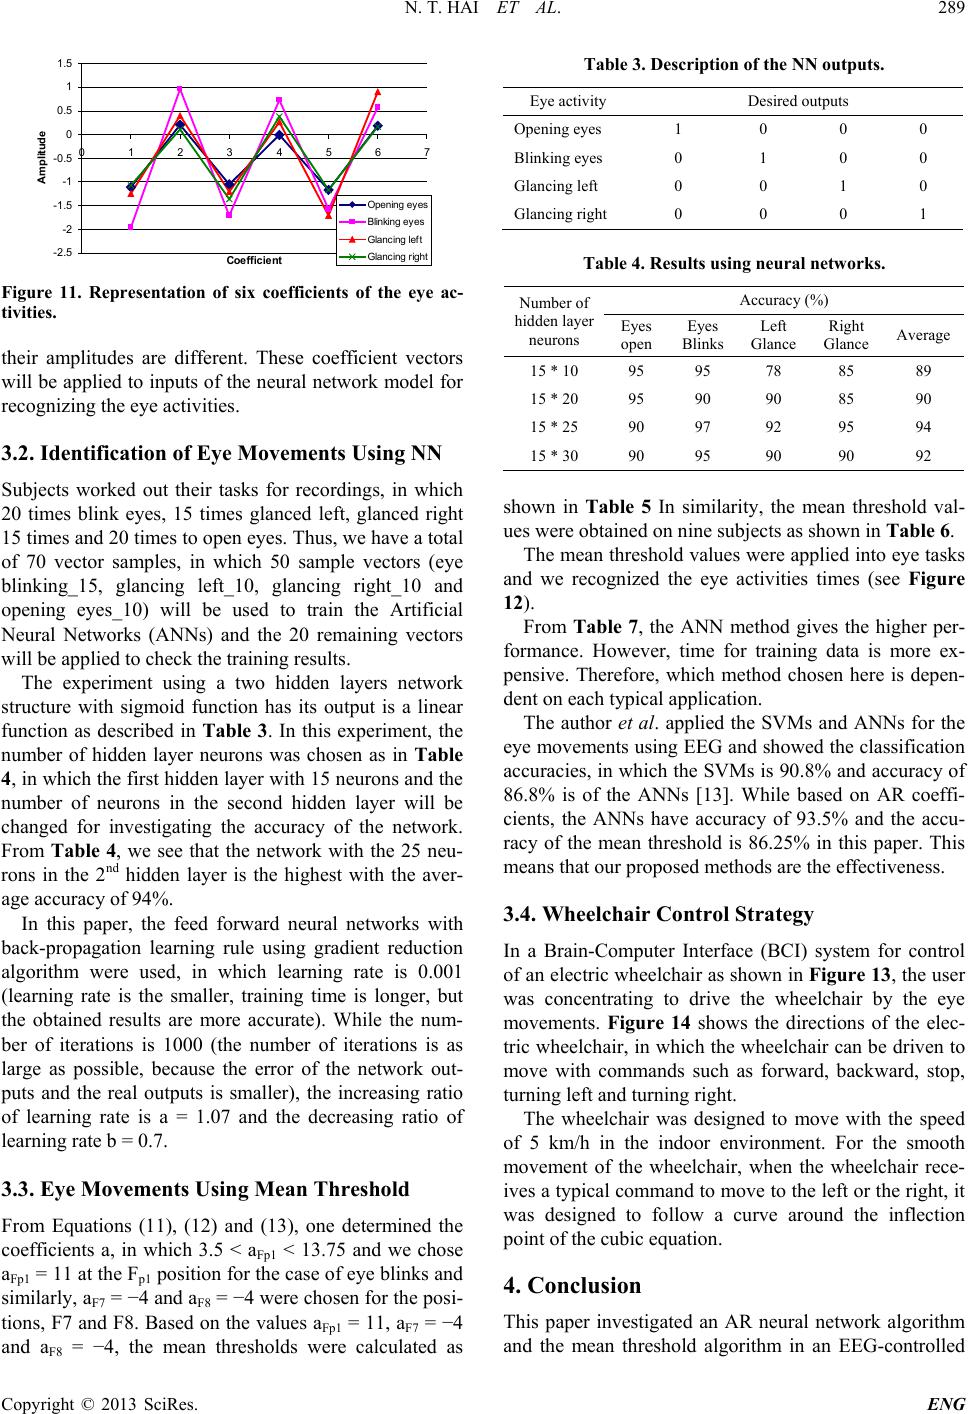 N. T. HAI ET AL. Copyright © 2013 SciRes. ENG 289 Figure 11. Representation of six coefficients of the eye ac- tivities. their amplitudes are different. These coefficient vectors will be applied to inputs of the neural network model for recognizing the eye activities. 3.2. Identification o f E ye Movements Using NN Subjects worked out their tasks for recordings, in which 20 times blink eyes, 15 times glanced left, glanced right 15 times and 20 times to open eyes. Thus, we have a total of 70 vector samples, in which 50 sample vectors (eye blinking_15, glancing le ft_10, glancing right_10 and opening eyes_10) will be used to train the Artificial Neural Networks (ANNs) and the 20 remaining vectors will be applied to check the training results. The experiment using a two hidden layers network structure with sigmoid function has its output is a linear function as described in Table 3. In this experiment, the number of hidden layer neurons was chosen as in Table 4, in which the first hidden layer with 15 neurons and the number of neurons in the second hidden layer will be changed for investigating the accuracy of the network. From Table 4, we see that the network with the 25 neu- rons in the 2nd hidden layer is the highest with the aver- age accuracy of 94%. In this paper, the feed forward neural networks with back-propagation learning rule using gradient reduction algorithm were used, in which learning rate is 0.001 (learning rate is the smaller, training time is longer, but the obtained results are more accurate). While the num- ber of iterations is 1000 (the number of iterations is as large as possible, because the error of the network out- puts and the real outputs is smaller), the increasing ratio of learning rate is a = 1.07 and the decreasing ratio of learning rate b = 0.7. 3.3. Eye Movements Using M ean Threshold From Equations (11), (12) and (13), one determined the coefficients a, in which 3.5 < aFp1 < 13.75 and we chose aFp1 = 11 at the Fp1 position for the case of eye blink s and similarly, aF7 = −4 and aF8 = −4 were chosen for the posi- tions, F7 and F8. Based on the v alues aFp1 = 11, aF7 = −4 and aF8 = −4, the mean thresholds were calculated as Table 3. Description of the NN outputs. Eye activity Desired outputs Opening eyes 1 0 0 0 Blinking eyes 0 1 0 0 Glancing left 0 0 1 0 Glancing right 0 0 0 1 Table 4. Results using neural networks. Number of hidden layer neurons Accuracy (%) Eyes open Eyes Blinks Left Glance Right Glance Average 15 * 10 95 95 78 85 89 15 * 20 95 90 90 85 90 15 * 25 90 97 92 95 94 15 * 30 90 95 90 90 92 shown in Table 5 In similarity, the mean threshold val- ues were obtained on nine subjects as shown in Table 6. The mean threshold values were applied into eye tasks and we recognized the eye activities times (see Figure 12). From Table 7, the ANN method gives the higher per- formance. However, time for training data is more ex- pensive. Therefore, which method chosen here is depen- dent on each typical application. The author et al. applied the SVMs and ANNs for the eye movements using EEG and showed the classification accuracies, in which the SVMs is 90.8% and accuracy of 86.8% is of the ANNs [13]. While based on AR coeffi- cients, the ANNs have accuracy of 93.5% and the accu- racy of the mean threshold is 86.25% in this paper. This means that our proposed methods are the effectiveness. 3.4. Wheelchair Control Strategy In a Brain-Computer Interface (BCI) system for control of an electric wheelchair as shown in Figure 13, the user was concentrating to drive the wheelchair by the eye movements. Figure 14 shows the directions of the elec- tric wheelchair, in which the wheelchair can be driven to move with commands such as forward, backward, stop, turning left and turning right. The wheelchair was designed to move with the speed of 5 km/h in the indoor environment. For the smooth movement of the wheelchair, when the wheelchair rece- ives a typical command to move to the left or the right, it was designed to follow a curve around the inflection point of the cubic equa tion. 4. Conclusion This paper investigated an AR neural network algorithm and the mean threshold algorithm in an EEG-controlled -2 .5 -2 -1 .5 -1 -0 .5 0 0 .5 1 1 .5 012 34567 Coefficient Amplitude Opening eyes Blinking eyes Glancing left Glancing right 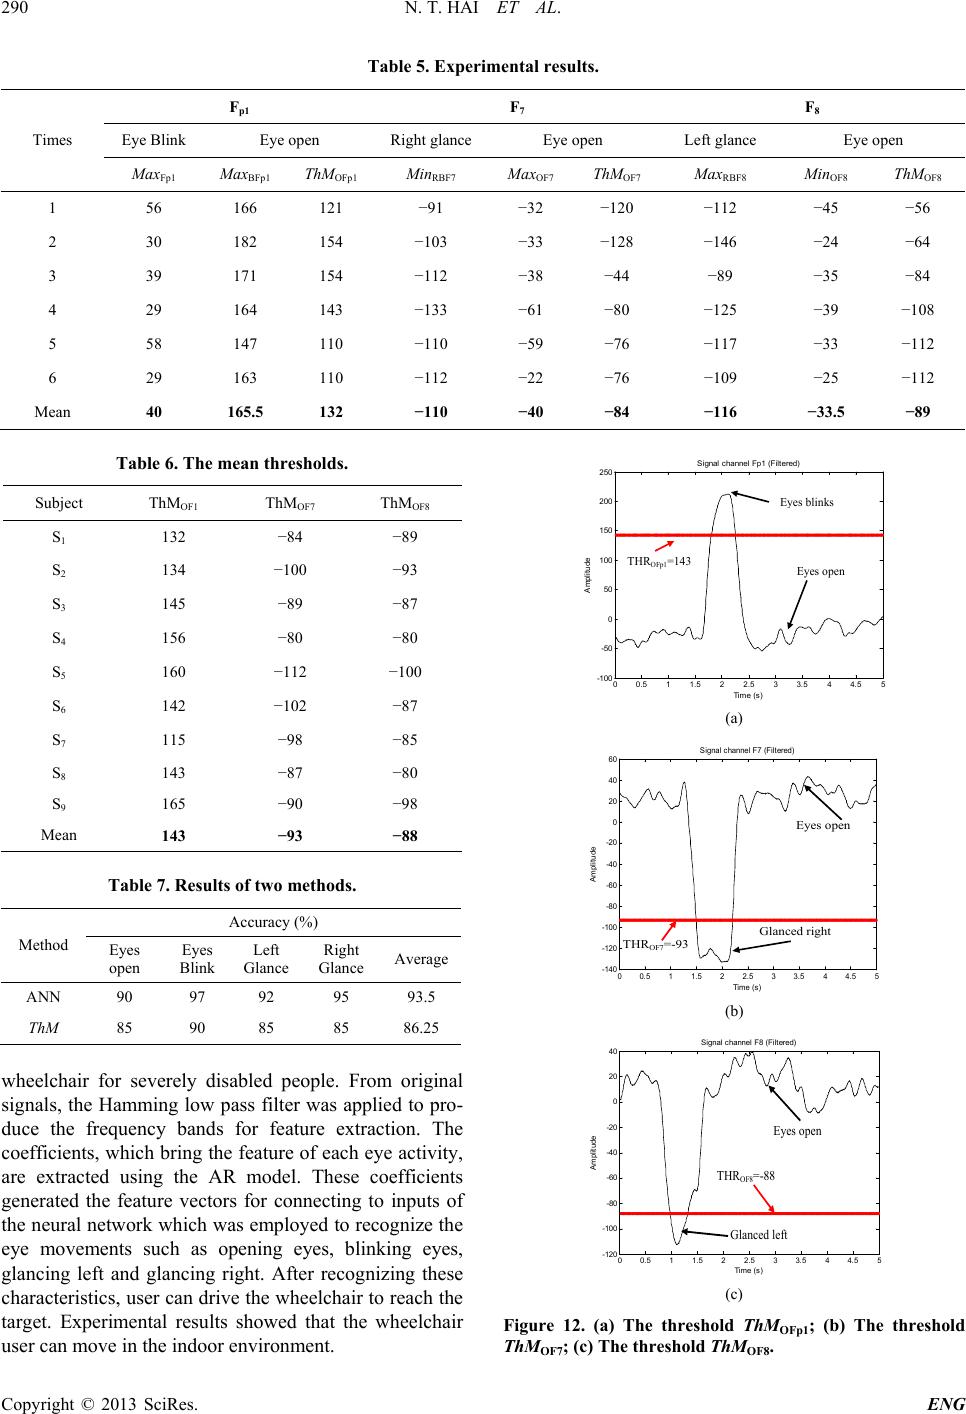 N. T. HAI ET AL. Copyright © 2013 SciRes. ENG 290 Table 5. Experimental results. Times Fp1 F7 F8 Eye Blink Eye open Right glance Eye open Left glance Eye open MaxFp1 MaxBFp1 ThMOFp1 MinRB F7 MaxOF7 ThMOF7 MaxRBF8 MinOF8 ThMOF8 1 56 166 121 −91 −32 −120 −112 −45 −56 2 30 182 154 −103 −33 −128 −146 −24 −64 3 39 171 154 −112 −38 −44 −89 −35 −84 4 29 164 143 −133 −61 −80 −125 −39 −108 5 58 147 110 −110 −59 −76 −117 −33 −112 6 29 163 110 −112 −22 −76 −109 −25 −112 Mean 40 165.5 132 −110 −40 −84 −116 −33.5 −89 Table 6. The mean thresholds. Subject ThMOF1 ThMOF7 ThMOF8 S1 132 −84 −89 S2 134 −100 −93 S3 145 −89 −87 S4 156 −80 −80 S5 160 −112 −100 S6 142 −102 −87 S7 115 −98 −85 S8 143 −87 −80 S9 165 −90 −98 Mean 143 −93 −88 Table 7. Results of two methods. Method Accuracy (%) Eyes open Eyes Blink Left Glance Right Glance Average ANN 90 97 92 95 93.5 ThM 85 90 85 85 86.25 wheelchair for severely disabled people. From original signals, the Hamming low pass filter was applied to pro- duce the frequency bands for feature extraction. The coefficients, which bring the feature of each eye activity, are extracted using the AR model. These coefficients generated the feature vectors for connecting to inputs of the neural network which was employed to recognize the eye movements such as opening eyes, blinking eyes, glancing left and glancing right. After recognizing these characteristics, user can drive the wheelchair to reach the target. Experimental results showed that the wheelchair user can move in the indoor environment. (a) (b) (c) Figure 12. (a) The threshold ThMOFp1; (b) The threshold ThMOF7; (c) The threshol d ThMOF8. 00.5 11.5 22.5 33.5 44.5 5 -100 -50 0 50 100 150 200 250 Si gnal c hannel F p1 (F i ltered) Ti me ( s) Ampli tude THR OFp1 =143 Eyes open Eyes blinks 00.5 11.5 22.5 33.5 44.5 5 -140 -120 -100 -80 -60 -40 -20 0 20 40 60 Si gnal channel F 7 (Fi l tered) Ti me (s) Amplitude THR OF7 =-93 Eyes open Glanced right 00.5 11.5 22.5 33.5 44.5 5 -120 -100 -80 -60 -40 -20 0 20 40 Si gnal channel F 8 (Fi l tered) Ti me ( s) Amplitude THR OF8 =-88 Eyes open Glanced left 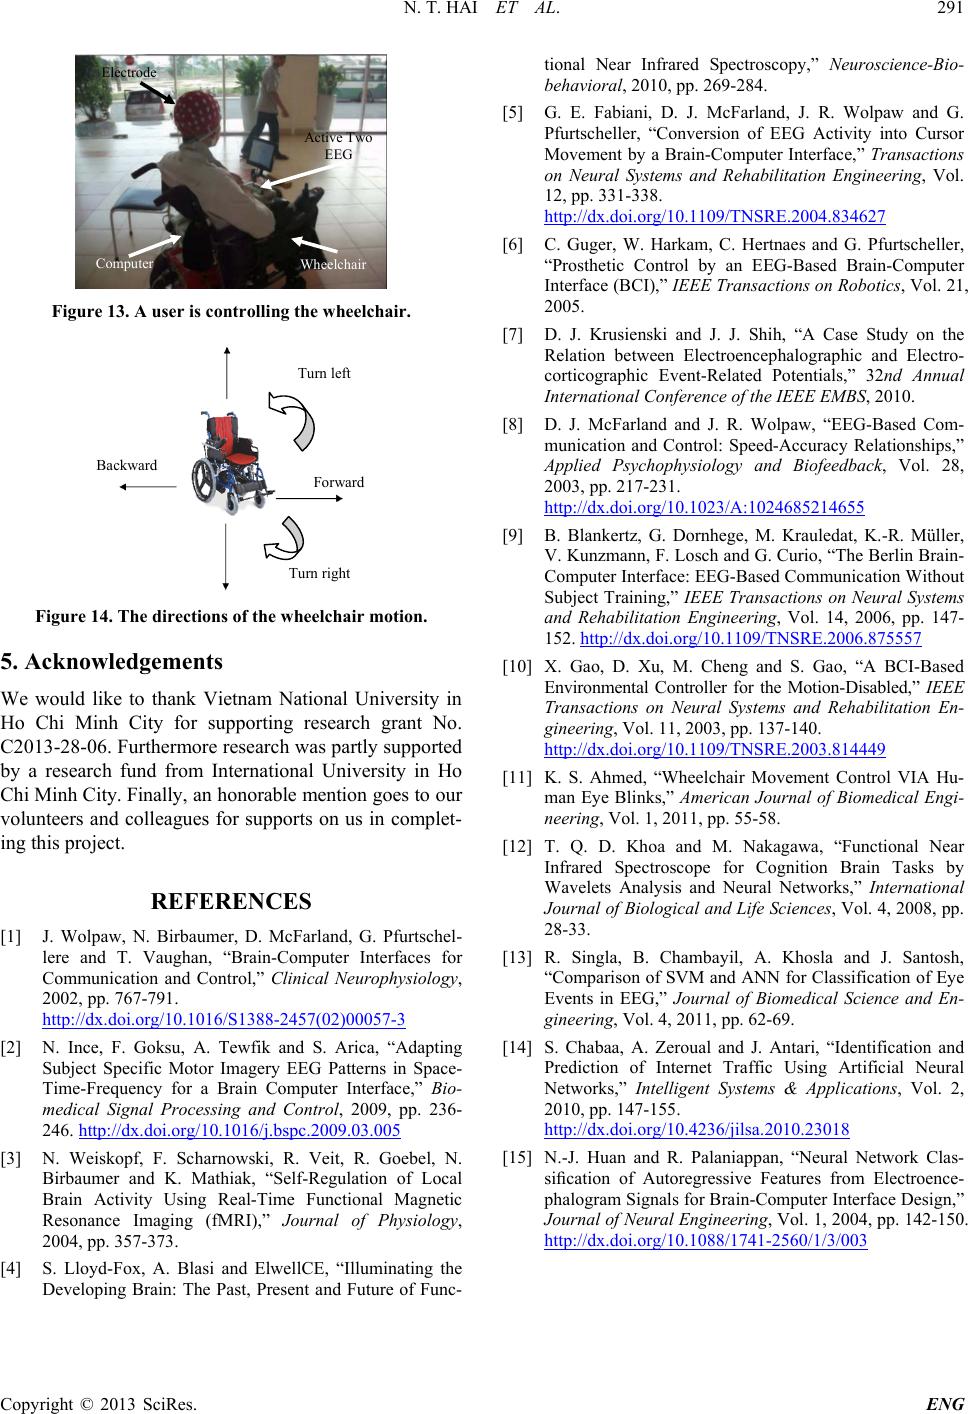 N. T. HAI ET AL. Copyright © 2013 SciRes. ENG 291 Figure 13. A user is controlling the wheelchair. Figure 14. The directions of the wheelchair motion. 5. Acknowledgements We would like to thank Vietnam National University in Ho Chi Minh City for supporting research grant No. C2013-28-06. Furthermore research was partly supported by a research fund from International University in Ho Chi Minh City. Finally, an honorable mention goes to our volunteers and colleagues for supports on us in complet- ing this project. REFERENCES [1] J. Wolpaw, N. Birbaumer, D. McFarland, G. Pfurtschel- lere and T. Vaughan, “Brain-Computer Interfaces for Communication and Control,” Clinical Neurophysiology, 2002, pp. 767-791. http://dx.doi.org/10.1016/S1388-2457(02)00057-3 [2] N. Ince, F. Goksu, A. Tewfik and S. Arica, “Adapting Subject Specific Motor Imagery EEG Patterns in Space- Time-Frequency for a Brain Computer Interface,” Bio- medical Signal Processing and Control, 2009, pp. 236- 246. http://dx.doi.org/10.1016/j.bspc.2009.03.005 [3] N. Weiskopf, F. Scharnowski, R. Veit, R. Goebel, N. Birbaumer and K. Mathiak, “Self-Regulation of Local Brain Activity Using Real-Time Functional Magnetic Resonance Imaging (fMRI),” Journal of Physiology, 2004, pp. 357-373. [4] S. Lloyd-Fox, A. Blasi and ElwellCE, “Illuminating the Developing Brain: The Past, Present and Future of Func- tional Near Infrared Spectroscopy,” Neuroscience-Bio- behavioral, 2010, pp. 269-284. [5] G. E. Fabiani, D. J. McFarland, J. R. Wolpaw and G. Pfurtscheller, “Conversion of EEG Activity into Cursor Movement by a Brain-Computer Interface,” Transactions on Neural Systems and Rehabilitation Engineering, Vol. 12, pp. 331-338. http://dx.doi.org/10.1109/TNSRE.2004.834627 [6] C. Guger, W. Harkam, C. Hertnaes and G. Pfurtscheller, “Prosthetic Control by an EEG-Based Brain-Computer Interface (BCI),” IEEE Transactions on Robotics, Vol. 21, 2005. [7] D. J. Krusienski and J. J. Shih, “A Case Study on the Relation between Electroencephalographic and Electro- corticographic Event-Related Potentials,” 32nd Annual International Conference of the IEEE EMBS, 2010. [8] D. J. McFarland and J. R. Wolpaw, “EEG-Based Com- munication and Control: Speed-Accuracy Relationships,” Applied Psychophysiology and Biofeedback, Vol. 28, 2003, pp. 217-231. http://dx.doi.org/10.1023/A:1024685214655 [9] B. Blankertz, G. Dornhege, M. Krauledat, K.-R. Müller, V. Kunzmann, F. Losch and G. Curio, “The Berlin Brain- Computer Interface: EEG-Based Communication Without Subject Training,” IEEE Transactions on Neural Systems and Rehabilitation Engineering, Vol. 14, 2006, pp. 147- 152. http://dx.doi.org/10.1109/TNSRE.2006.875557 [10] X. Gao, D. Xu, M. Cheng and S. Gao, “A BCI-Based Environmental Controller for the Motion-Disabled,” IEEE Transactions on Neural Systems and Rehabilitation En- gineering, Vol. 11, 2003, pp. 137-140. http://dx.doi.org/10.1109/TNSRE.2003.814449 [11] K. S. Ahmed, “Wheelchair Movement Control VIA Hu- man Eye Blinks,” American Journal of Biomedical Engi- neering, Vol. 1, 2011, pp. 55-58. [12] T. Q. D. Khoa and M. Nakagawa, “Functional Near Infrared Spectroscope for Cognition Brain Tasks by Wavelets Analysis and Neural Networks,” International Journal of Biological and Life Sciences, Vol. 4, 2008, pp. 28-33. [13] R. Singla, B. Chambayil, A. Khosla and J. Santosh, “Comparison of SVM and ANN for Classification of Eye Events in EEG,” Journal of Biomedical Science and En- gineering, Vol. 4, 2011, pp. 62-69. [14] S. Chabaa, A. Zeroual and J. Antari, “Identification and Prediction of Internet Traffic Using Artificial Neural Networks,” Intelligent Systems & Applications, Vol. 2, 2010, pp. 147-155. http://dx.doi.org/10.4236/jilsa.2010.23018 [15] N.-J. Huan and R. Palaniappan, “Neural Network Clas- sification of Autoregressive Features from Electroence- phalogram Signals for Brain-Computer Interface Design,” Journal of Neural Engineering, Vol. 1, 2004, pp. 142-150. http://dx.doi.org/10.1088/1741-2560/1/3/003 Wheelchair Computer Active Two EEG Electrod e For wa r d Backward Turn right Turn left |