

Paper Menu >>
Journal Menu >>
 Journal of Financial Risk Management 2013. Vol.2, No.4, 71-76 Published Online December 2013 in SciRes (http://www.scirp.org/journal/jfrm) http://dx.doi.org/10.4236/jfrm.2013.24012 Open Access 71 Empirical Study on Overreaction and Underreaction in Chinese Stock Market Based on ANAR-TGARCH Model Yong Fang1,2,3 1Post-Doctoral Scientific Research Workstation, Shanghai International Group Co., Ltd. (SIG), Shanghai, China 2Post-Doctoral Research Station for Applied Economics, Fudan University, Shanghai, China 3Department of Applied Mathematics, Shanghai Finance University, Shanghai, China Email: [email protected] Received July 26th, 2013; August 26th, 2013; September 5th, 2013 Copyright © 2013 Yong Fang. This is an open access article distributed under the Creative Commons Attribu- tion License, which permits unrestricted use, distribution, and reproduction in any medium, provided the original work is properly cited. An ANAR-TGARCH model is adopted in this paper. By using a first-order asymmetric autoregressive mean equation, we conduct a series of robust tests on overreaction and underreaction in the Chinese stock market by taking the abnormal value, run length, time scale, size, industry, style, and market cycle into account. We then comprehensively compare the intensities of the first-order autocorrelation by using Wald coefficients tests. Results could provide strong empirical support for generating stock market in- vestment strategies. Keywords: Overreaction; Underreaction; ANAR-TGARCH Model Introduction Since the mid-1980s, behavioral finance has rapidly risen and become an entire theory system. Behavioral finance dem- onstrates broad prospects because of its theoretical analysis of real investment behavior, and causes significant changes in modern financial theory structure and financial research para- digm (Kahneman & Tversky, 1979; Thaler, 1985; De Long, Shleifer, Summers, & Waldmann, 1990a; De Long, Shleifer, Summers, & Waldmann, 1990b; Gervais & Odean, 2001; Bac- chetta & Wincoop, 2008; Barberis, Huang, & Santos, 2001). Overreaction or underreaction to information is one of the important behavioral characteristics of investors with limited rationale. A number of empirical studies reported that stock returns show significant autocorrelation. Traditional financial theory based on the rational person hypothesis cannot provide a reasonable explanation for this phenomenon. Behavioral fi- nance attributes the significant autocorrelation of stock returns to the biased reaction of investors to new information, including overreaction and underreaction. Thus, as new information ap- pears, investors cannot revise their views according to the Bayesian rule. In behavioral finance theory, many classical models are used to analyze the overreaction or underreaction of investors. Bar- beris, Shleifer, & Vishny (1998) assumed that investors have two kinds of mental biases when making investment decisions. One is the representative bias, in which investors make infer- ences and judgments according to a small sample and ignore the population. Another is the conservative bias, in which in- vestors are unable to update their expectations in a timely manner according to new information. The representative bias causes overraeaction and the conservative bias causes underre- action to new information. Daniel, Hirshleifer, & Subrah- manyam (1998) explained overreaction and underreaction from another perspective. They divided all investors into informed and uninformed investors. Uninformed investors do not have mental biases but informed investors do. These mental biases include overconfidence and self-attribution. Commonly over- confident, informed investors depend excessively on private information and underestimate the value of public information. Such investors likewise overestimate their ability to forecast and underestimate their forecasting error. Overconfidence can lead to mispricing of stocks. Generally, overconfidence is usu- ally encouraged by another mental bias, namely, self-attribution, which is when investors attribute their success to their own abilities and attribute failure to external noise. De Bondt & Thaler (1985) sorted all stocks listed in the New York Stock Exchange according to accumulated returns over the past years and constructed two portfolios. One portfolio was called “win- ners” and comprised 35 stocks with the best performance. The other portfolio was called “losers” and comprised 35 stocks with the worst performance. The accumulated returns of these two portfolios over the next three years were then examined. Losers were found to greatly outperform winners. Behavioral finance can provide a feasible explanation for this phenomenon. Investors usually overestimate the value of winners and under- estimate the value of losers, resulting in mispricing. When mis- pricing is corrected after a period of time, the accumulated returns of losers would be greater than that of winners.In this paper, an ANAR-TGARCH model is adopted to test overreac- tion or underreaction in the Chinese stock market. A series of robust tests were conducted on the underreaction or overreac- tion of investors by taking run length, abnormality degree, time scale, size, sector, style, and market cycle into account. Wald coefficients tests are then used to compare autocorrelation in- tensities. The empirical results in this paper could help inves- 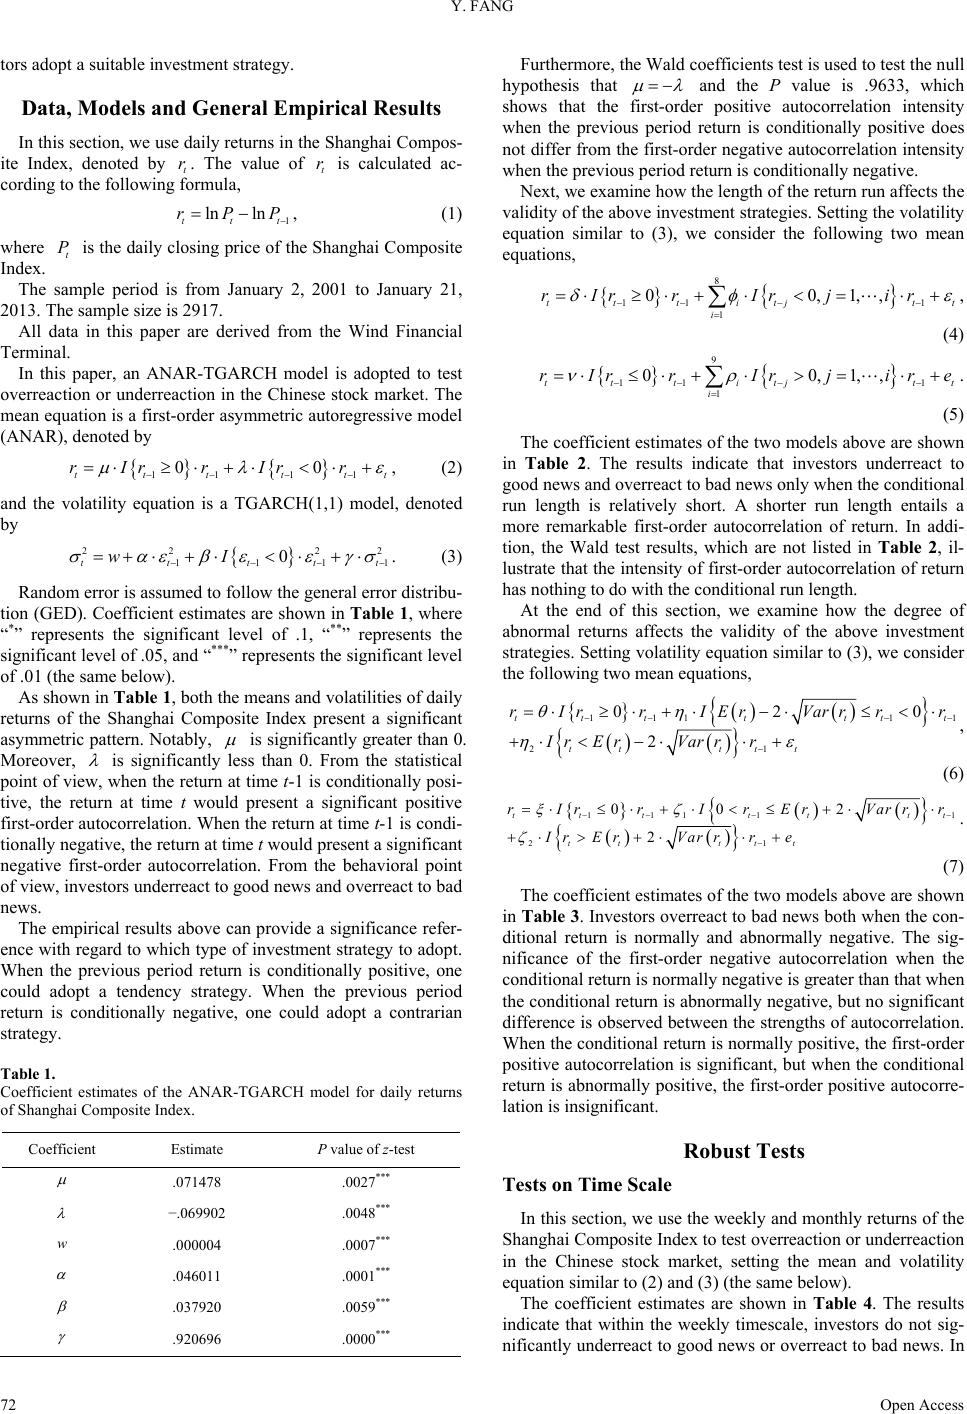 Y. FANG tors adopt a suitable investment strategy. Data, Models and General Empirical Results In this section, we use daily returns in the Shanghai Compos- ite Index, denoted by t. The value of is calculated ac- cording to the following formula, rt r 1 ln ln tt rPP t , (1) where is the daily closing price of the Shanghai Composite Index. t P The sample period is from January 2, 2001 to January 21, 2013. The sample size is 2917. All data in this paper are derived from the Wind Financial Terminal. In this paper, an ANAR-TGARCH model is adopted to test overreaction or underreaction in the Chinese stock market. The mean equation is a first-order asymmetric autoregressive model (ANAR), denoted by 11 11 00 ttttt rIrr Irr t , (2) and the volatility equation is a TGARCH(1,1) model, denoted by 22 2 111 0 tttt wI 2 1t . (3) Random error is assumed to follow the general error distribu- tion (GED). Coefficient estimates are shown in Table 1, where “*” represents the significant level of .1, “**” represents the significant level of .05, and “***” represents the significant level of .01 (the same below). As shown in Table 1, both the means and volatilities of daily returns of the Shanghai Composite Index present a significant asymmetric pattern. Notably, is significantly greater than 0. Moreover, is significantly less than 0. From the statistical point of view, when the return at time t-1 is conditionally posi- tive, the return at time t would present a significant positive first-order autocorrelation. When the return at time t-1 is condi- tionally negative, the return at time t would present a significant negative first-order autocorrelation. From the behavioral point of view, investors underreact to good news and overreact to bad news. The empirical results above can provide a significance refer- ence with regard to which type of investment strategy to adopt. When the previous period return is conditionally positive, one could adopt a tendency strategy. When the previous period return is conditionally negative, one could adopt a contrarian strategy. Table 1. Coefficient estimates of the ANAR-TGARCH model for daily returns of Shanghai Composite Index. Coefficient Estimate P value of z-test .071478 .0027*** −.069902 .0048*** w .000004 .0007*** .046011 .0001*** .037920 .0059*** .920696 .0000*** Furthermore, the Wald coefficients test is used to test the null hypothesis that and the P value is .9633, which shows that the first-order positive autocorrelation intensity when the previous period return is conditionally positive does not differ from the first-order negative autocorrelation intensity when the previous period return is conditionally negative. Next, we examine how the length of the return run affects the validity of the above investment strategies. Setting the volatility equation similar to (3), we consider the following two mean equations, 8 11 1 1 00,1,, tttitj t i rIrrIr jir t , (4) 9 11 1 1 00,1,, tttitj t i rIrrIr jir t e . (5) The coefficient estimates of the two models above are shown in Table 2. The results indicate that investors underreact to good news and overreact to bad news only when the conditional run length is relatively short. A shorter run length entails a more remarkable first-order autocorrelation of return. In addi- tion, the Wald test results, which are not listed in Table 2, il- lustrate that the intensity of first-order autocorrelation of return has nothing to do with the conditional run length. At the end of this section, we examine how the degree of abnormal returns affects the validity of the above investment strategies. Setting volatility equation similar to (3), we consider the following two mean equations, 111 1 21 02 2 ttt ttt tt ttt rIrr IErVarrrr Ir ErVarrr 1 0 t , (6) 111 1 21 00 2 2 tttttt tt ttt rIrr IrErVarrr Ir ErVarrre 1t . (7) The coefficient estimates of the two models above are shown in Table 3. Investors overreact to bad news both when the con- ditional return is normally and abnormally negative. The sig- nificance of the first-order negative autocorrelation when the conditional return is normally negative is greater than that when the conditional return is abnormally negative, but no significant difference is observed between the strengths of autocorrelation. When the conditional return is normally positive, the first-order positive autocorrelation is significant, but when the conditional return is abnormally positive, the first-order positive autocorre- lation is insignificant. Robust Tests Tests on Time Scale In this section, we use the weekly and monthly returns of the Shanghai Composite Index to test overreaction or underreaction in the Chinese stock market, setting the mean and volatility equation similar to (2) and (3) (the same below). The coefficient estimates are shown in Table 4. The results indicate that within the weekly timescale, investors do not sig- nificantly underreact to good news or overreact to bad news. In Open Access 72 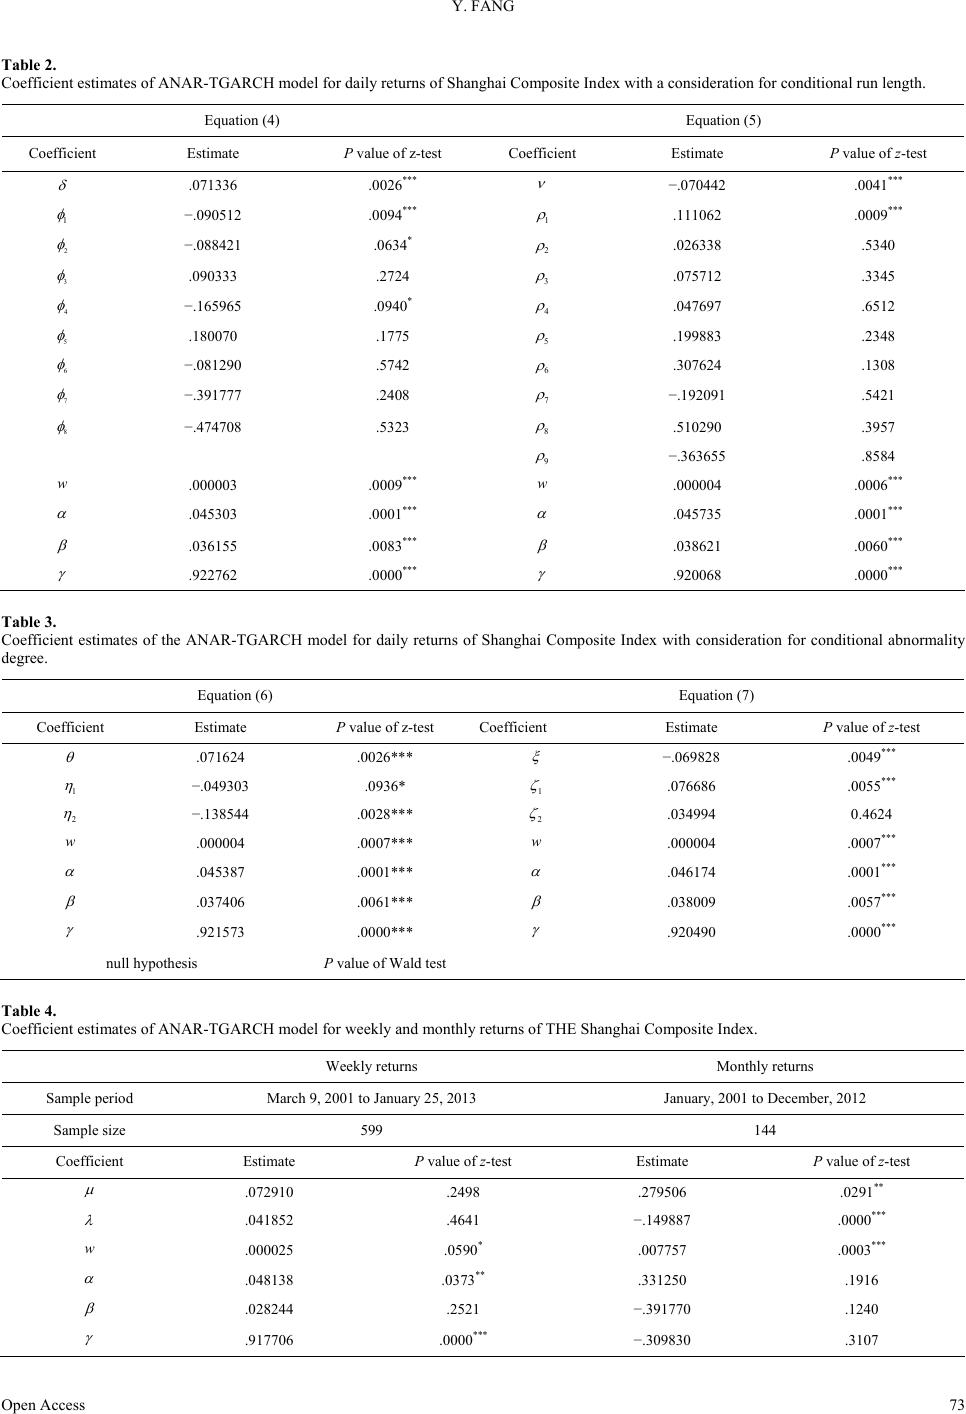 Y. FANG Open Access 73 Table 2. Coefficient estimates of ANAR-TGARCH model for daily returns of Shanghai Composite Index with a consideration for conditional run length. Equation (4) Equation (5) Coefficient Estimate P value of z-test Coefficient Estimate P value of z-test .071336 .0026*** −.070442 .0041*** 1 −.090512 .0094*** 1 .111062 .0009*** 2 −.088421 .0634* 2 .026338 .5340 3 .090333 .2724 3 .075712 .3345 4 −.165965 .0940* 4 .047697 .6512 5 .180070 .1775 5 .199883 .2348 6 −.081290 .5742 6 .307624 .1308 7 −.391777 .2408 7 −.192091 .5421 8 −.474708 .5323 8 .510290 .3957 9 −.363655 .8584 w .000003 .0009*** w .000004 .0006*** .045303 .0001*** .045735 .0001*** .036155 .0083*** .038621 .0060*** .922762 .0000*** .920068 .0000*** Table 3. Coefficient estimates of the ANAR-TGARCH model for daily returns of Shanghai Composite Index with consideration for conditional abnormality degree. Equation (6) Equation (7) Coefficient Estimate P value of z-test Coefficient Estimate P value of z-test .071624 .0026*** −.069828 .0049*** 1 −.049303 .0936* 1 .076686 .0055*** 2 −.138544 .0028*** 2 .034994 0.4624 w .000004 .0007*** w .000004 .0007*** .045387 .0001*** .046174 .0001*** .037406 .0061*** .038009 .0057*** .921573 .0000*** .920490 .0000*** null hypothesis P value of Wald test Table 4. Coefficient estimates of ANAR-TGARCH model for weekly and monthly returns of THE Shanghai Composite Index. Weekly returns Monthly returns Sample period March 9, 2001 to January 25, 2013 January, 2001 to December, 2012 Sample size 599 144 Coefficient Estimate P value of z-test Estimate P value of z-test .072910 .2498 .279506 .0291** .041852 .4641 −.149887 .0000*** w .000025 .0590* .007757 .0003*** .048138 .0373** .331250 .1916 .028244 .2521 −.391770 .1240 .917706 .0000*** −.309830 .3107 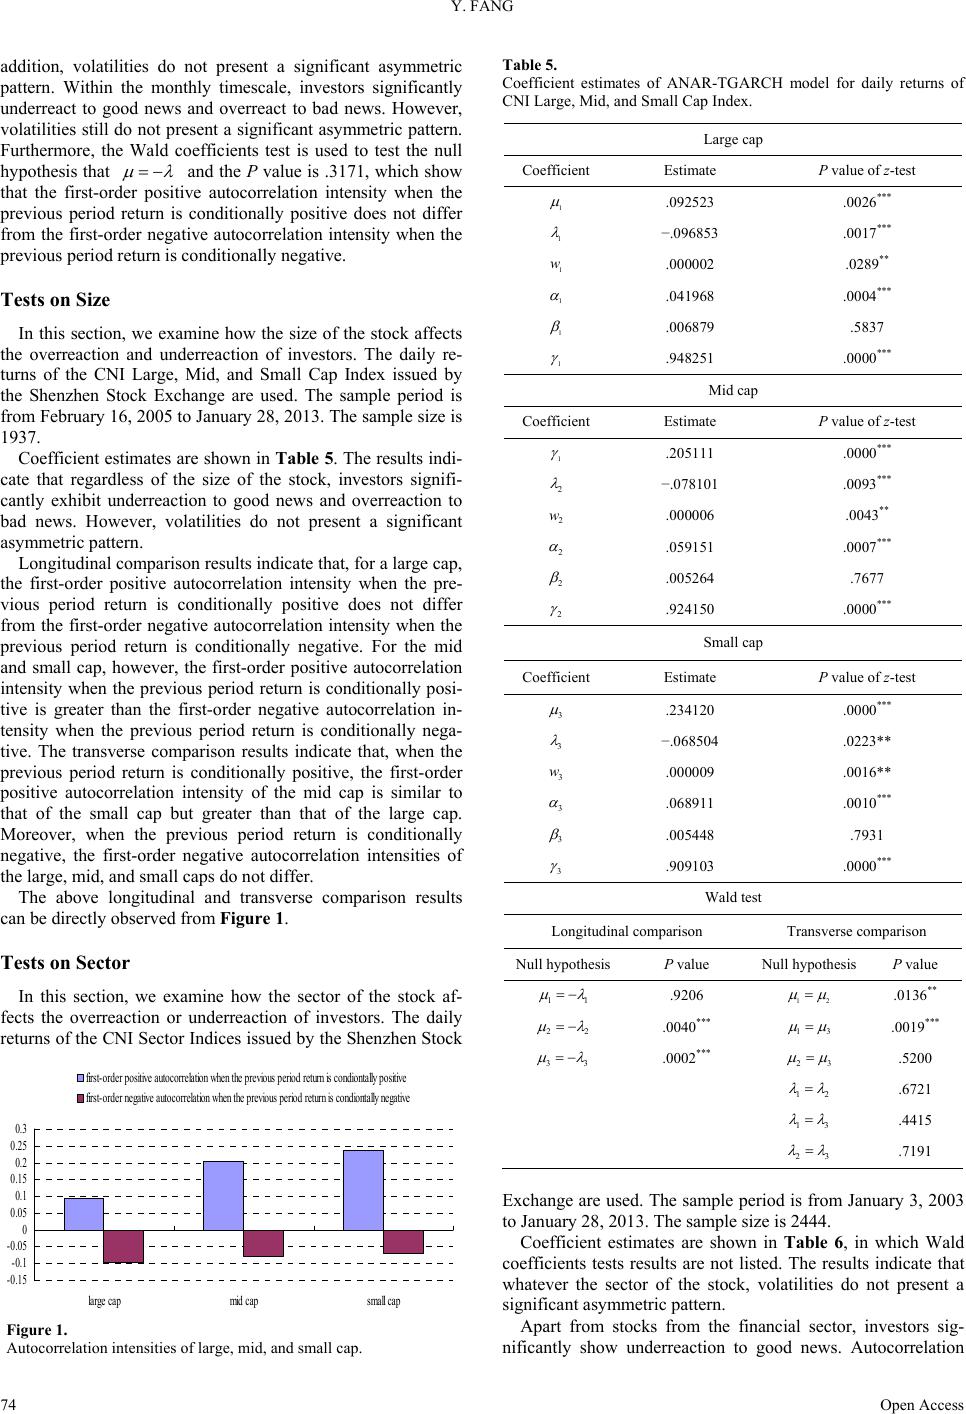 Y. FANG addition, volatilities do not present a significant asymmetric pattern. Within the monthly timescale, investors significantly underreact to good news and overreact to bad news. However, volatilities still do not present a significant asymmetric pattern. Furthermore, the Wald coefficients test is used to test the null hypothesis that and the P value is .3171, which show that the first-order positive autocorrelation intensity when the previous period return is conditionally positive does not differ from the first-order negative autocorrelation intensity when the previous period return is conditionally negative. Tests on Size In this section, we examine how the size of the stock affects the overreaction and underreaction of investors. The daily re- turns of the CNI Large, Mid, and Small Cap Index issued by the Shenzhen Stock Exchange are used. The sample period is from February 16, 2005 to January 28, 2013. The sample size is 1937. Coefficient estimates are shown in Table 5. The results indi- cate that regardless of the size of the stock, investors signifi- cantly exhibit underreaction to good news and overreaction to bad news. However, volatilities do not present a significant asymmetric pattern. Longitudinal comparison results indicate that, for a large cap, the first-order positive autocorrelation intensity when the pre- vious period return is conditionally positive does not differ from the first-order negative autocorrelation intensity when the previous period return is conditionally negative. For the mid and small cap, however, the first-order positive autocorrelation intensity when the previous period return is conditionally posi- tive is greater than the first-order negative autocorrelation in- tensity when the previous period return is conditionally nega- tive. The transverse comparison results indicate that, when the previous period return is conditionally positive, the first-order positive autocorrelation intensity of the mid cap is similar to that of the small cap but greater than that of the large cap. Moreover, when the previous period return is conditionally negative, the first-order negative autocorrelation intensities of the large, mid, and small caps do not differ. The above longitudinal and transverse comparison results can be directly observed from Figure 1. Tests on Sector In this section, we examine how the sector of the stock af- fects the overreaction or underreaction of investors. The daily returns of the CNI Sector Indices issued by the Shenzhen Stock -0.15 -0.1 -0.05 0 0.05 0.1 0.15 0.2 0.25 0.3 lar g e ca p mid ca p small ca p first-order positive autocorrelation when the previous period return is condiontally positive first-order negative autocorrelation when the previous period return is condiontally negative Figure 1. Autocorrelation intensities of large, mid, and small cap. Table 5. Coefficient estimates of ANAR-TGARCH model for daily returns of CNI Large, Mid, and Small Cap Index. Large cap Coefficient Estimate P value of z-test 1 .092523 .0026*** 1 −.096853 .0017*** 1 w .000002 .0289** 1 .041968 .0004*** 1 .006879 .5837 1 .948251 .0000*** Mid cap Coefficient Estimate P value of z-test 1 .205111 .0000*** 2 −.078101 .0093*** 2 w .000006 .0043** 2 .059151 .0007*** 2 .005264 .7677 2 .924150 .0000*** Small cap Coefficient Estimate P value of z-test 3 .234120 .0000*** 3 −.068504 .0223** 3 w .000009 .0016** 3 .068911 .0010*** 3 .005448 .7931 3 .909103 .0000*** Wald test Longitudinal comparison Transverse comparison Null hypothesisP value Null hypothesis P value 11 .9206 12 .0136** 22 .0040*** 13 .0019*** 33 .0002*** 23 .5200 12 .6721 13 .4415 23 .7191 Exchange are used. The sample period is from January 3, 2003 to January 28, 2013. The sample size is 2444. Coefficient estimates are shown in Table 6, in which Wald coefficients tests results are not listed. The results indicate that whatever the sector of the stock, volatilities do not present a significant asymmetric pattern. Apart from stocks from the financial sector, investors sig- nificantly show underreaction to good news. Autocorrelation Open Access 74 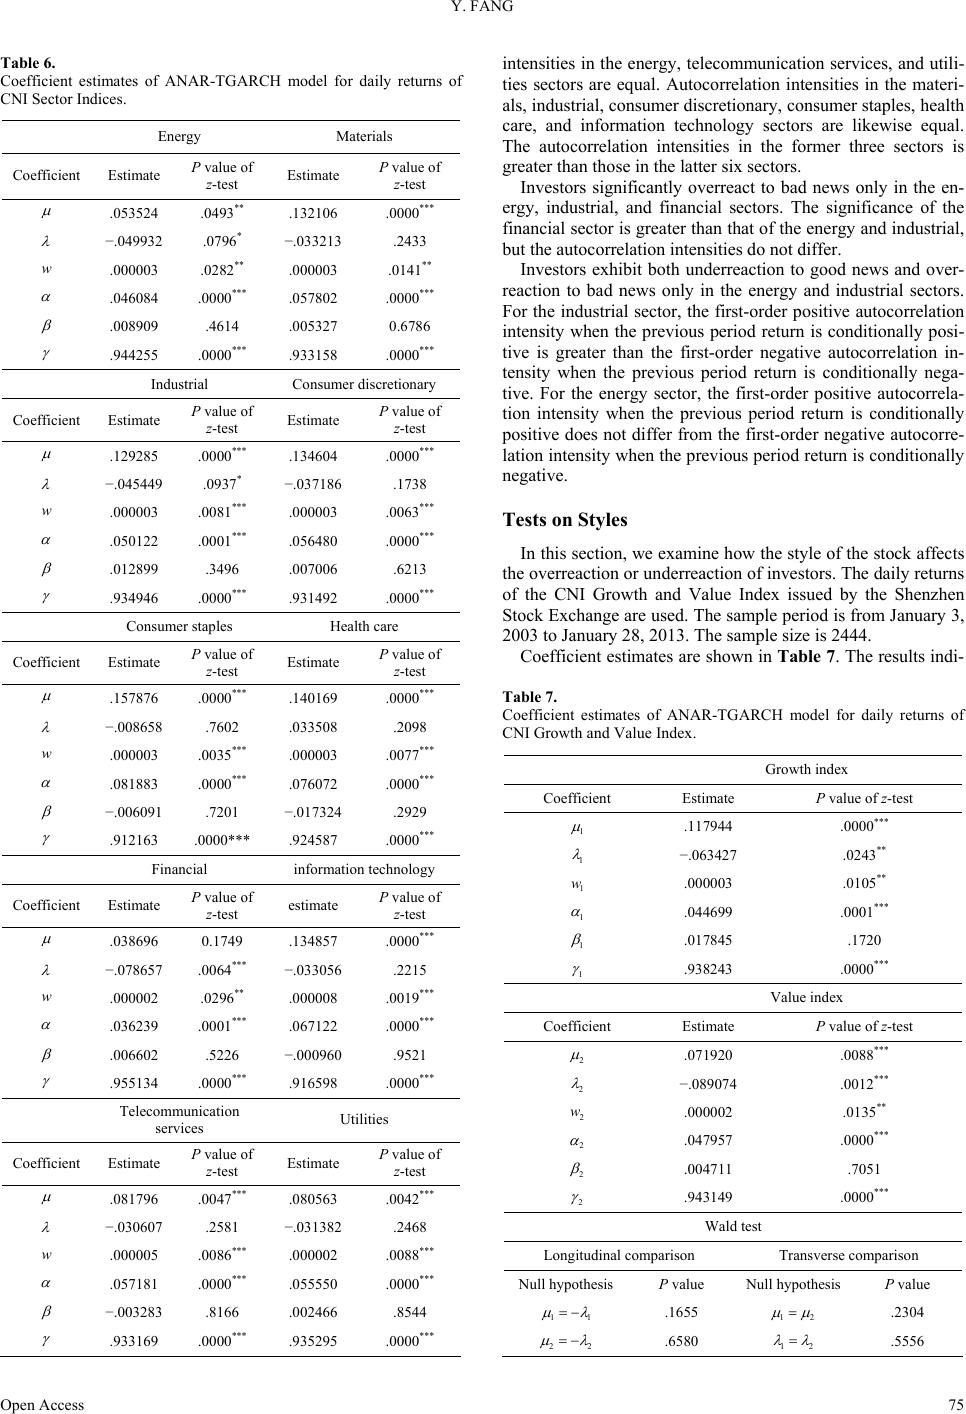 Y. FANG Table 6. Coefficient estimates of ANAR-TGARCH model for daily returns of CNI Sector Indices. Energy Materials Coefficient Estimate P value of z-test Estimate P value of z-test .053524 .0493** .132106 .0000*** −.049932 .0796* −.033213 .2433 w .000003 .0282** .000003 .0141** .046084 .0000*** .057802 .0000*** .008909 .4614 .005327 0.6786 .944255 .0000*** .933158 .0000*** Industrial Consumer discretionary Coefficient Estimate P value of z-test Estimate P value of z-test .129285 .0000*** .134604 .0000*** −.045449 .0937* −.037186 .1738 w .000003 .0081*** .000003 .0063*** .050122 .0001*** .056480 .0000*** .012899 .3496 .007006 .6213 .934946 .0000*** .931492 .0000*** Consumer staples Health care Coefficient Estimate P value of z-test Estimate P value of z-test .157876 .0000*** .140169 .0000*** −.008658 .7602 .033508 .2098 w .000003 .0035*** .000003 .0077*** .081883 .0000*** .076072 .0000*** −.006091 .7201 −.017324 .2929 .912163 .0000*** .924587 .0000*** Financial information technology Coefficient Estimate P value of z-test estimate P value of z-test .038696 0.1749 .134857 .0000*** −.078657 .0064*** −.033056 .2215 w .000002 .0296** .000008 .0019*** .036239 .0001*** .067122 .0000*** .006602 .5226 −.000960 .9521 .955134 .0000*** .916598 .0000*** Telecommunication services Utilities Coefficient Estimate P value of z-test Estimate P value of z-test .081796 .0047*** .080563 .0042*** −.030607 .2581 −.031382 .2468 w .000005 .0086*** .000002 .0088*** .057181 .0000*** .055550 .0000*** −.003283 .8166 .002466 .8544 .933169 .0000*** .935295 .0000*** intensities in the energy, telecommunication services, and utili- ties sectors are equal. Autocorrelation intensities in the materi- als, industrial, consumer discretionary, consumer staples, health care, and information technology sectors are likewise equal. The autocorrelation intensities in the former three sectors is greater than those in the latter six sectors. Investors significantly overreact to bad news only in the en- ergy, industrial, and financial sectors. The significance of the financial sector is greater than that of the energy and industrial, but the autocorrelation intensities do not differ. Investors exhibit both underreaction to good news and over- reaction to bad news only in the energy and industrial sectors. For the industrial sector, the first-order positive autocorrelation intensity when the previous period return is conditionally posi- tive is greater than the first-order negative autocorrelation in- tensity when the previous period return is conditionally nega- tive. For the energy sector, the first-order positive autocorrela- tion intensity when the previous period return is conditionally positive does not differ from the first-order negative autocorre- lation intensity when the previous period return is conditionally negative. Tests on Styles In this section, we examine how the style of the stock affects the overreaction or underreaction of investors. The daily returns of the CNI Growth and Value Index issued by the Shenzhen Stock Exchange are used. The sample period is from January 3, 2003 to January 28, 2013. The sample size is 2444. Coefficient estimates are shown in Table 7. The results indi- Table 7. Coefficient estimates of ANAR-TGARCH model for daily returns of CNI Growth and Value Index. Growth index Coefficient Estimate P value of z-test 1 .117944 .0000*** 1 −.063427 .0243** 1 w .000003 .0105** 1 .044699 .0001*** 1 .017845 .1720 1 .938243 .0000*** Value index Coefficient Estimate P value of z-test 2 .071920 .0088*** 2 −.089074 .0012*** 2 w .000002 .0135** 2 .047957 .0000*** 2 .004711 .7051 2 .943149 .0000*** Wald test Longitudinal comparison Transverse comparison Null hypothesis P value Null hypothesis P value 11 .1655 12 .2304 22 .6580 12 .5556 Open Access 75 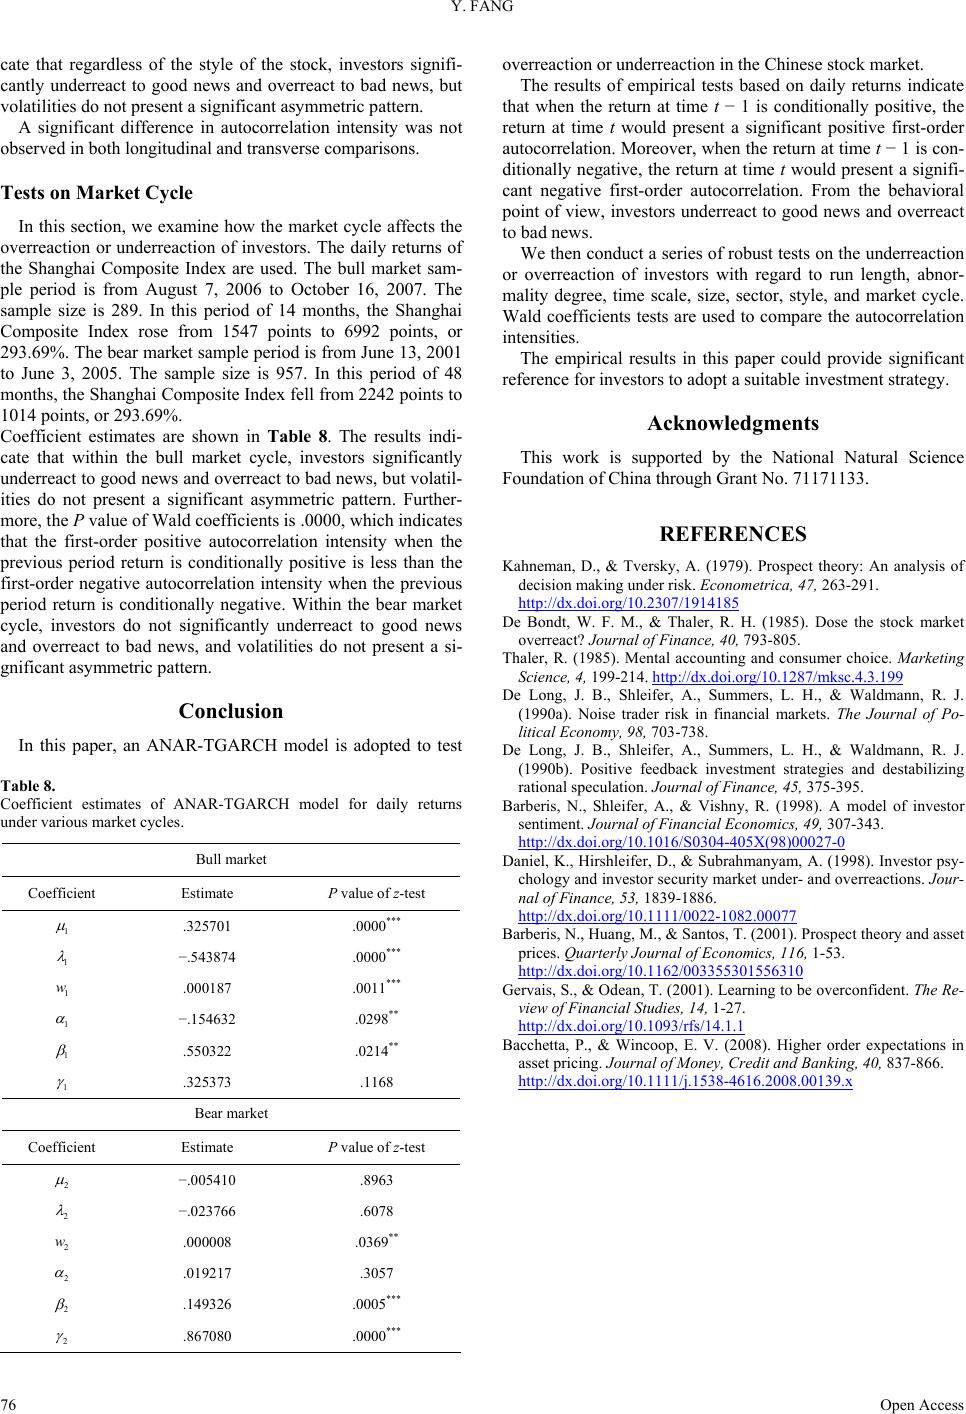 Y. FANG Open Access 76 cate that regardless of the style of the stock, investors signifi- cantly underreact to good news and overreact to bad news, but volatilities do not present a significant asymmetric pattern. overreaction or underreaction in the Chinese stock market. The results of empirical tests based on daily returns indicate that when the return at time t − 1 is conditionally positive, the return at time t would present a significant positive first-order autocorrelation. Moreover, when the return at time t − 1 is con- ditionally negative, the return at time t would present a signifi- cant negative first-order autocorrelation. From the behavioral point of view, investors underreact to good news and overreact to bad news. A significant difference in autocorrelation intensity was not observed in both longitudinal and transverse comparisons. Tests on Market Cycle In this section, we examine how the market cycle affects the overreaction or underreaction of investors. The daily returns of the Shanghai Composite Index are used. The bull market sam- ple period is from August 7, 2006 to October 16, 2007. The sample size is 289. In this period of 14 months, the Shanghai Composite Index rose from 1547 points to 6992 points, or 293.69%. The bear market sample period is from June 13, 2001 to June 3, 2005. The sample size is 957. In this period of 48 months, the Shanghai Composite Index fell from 2242 points to 1014 points, or 293.69%. We then conduct a series of robust tests on the underreaction or overreaction of investors with regard to run length, abnor- mality degree, time scale, size, sector, style, and market cycle. Wald coefficients tests are used to compare the autocorrelation intensities. The empirical results in this paper could provide significant reference for investors to adopt a suitable investment strategy. Acknowledgments Coefficient estimates are shown in Table 8. The results indi- cate that within the bull market cycle, investors significantly underreact to good news and overreact to bad news, but volatil- ities do not present a significant asymmetric pattern. Further- more, the P value of Wald coefficients is .0000, which indicates that the first-order positive autocorrelation intensity when the previous period return is conditionally positive is less than the first-order negative autocorrelation intensity when the previous period return is conditionally negative. Within the bear market cycle, investors do not significantly underreact to good news and overreact to bad news, and volatilities do not present a si- gnificant asymmetric pattern. This work is supported by the National Natural Science Foundation of China through Grant No. 71171133. REFERENCES Kahneman, D., & Tversky, A. (1979). Prospect theory: An analysis of decision making under risk. Econometrica, 47, 263-291. http://dx.doi.org/10.2307/1914185 De Bondt, W. F. M., & Thaler, R. H. (1985). Dose the stock market overreact? Journal of Finance, 40, 793-805. Thaler, R. (1985). Mental accounting and consumer choice. Marketing Science, 4, 199-214. http://dx.doi.org/10.1287/mksc.4.3.199 De Long, J. B., Shleifer, A., Summers, L. H., & Waldmann, R. J. (1990a). Noise trader risk in financial markets. The Journal of Po- litical Economy, 98, 703-738. Conclusion In this paper, an ANAR-TGARCH model is adopted to test De Long, J. B., Shleifer, A., Summers, L. H., & Waldmann, R. J. (1990b). Positive feedback investment strategies and destabilizing rational speculation. Journal of Finance, 45, 375-395. Table 8. Coefficient estimates of ANAR-TGARCH model for daily returns under various market cycles. Bull market Coefficient Estimate P value of z-test 1 .325701 .0000*** 1 −.543874 .0000*** 1 w .000187 .0011*** 1 −.154632 .0298** 1 .550322 .0214** 1 .325373 .1168 Bear market Coefficient Estimate P value of z-test 2 −.005410 .8963 2 −.023766 .6078 2 w .000008 .0369** 2 .019217 .3057 2 .149326 .0005*** 2 .867080 .0000*** Barberis, N., Shleifer, A., & Vishny, R. (1998). A model of investor sentiment. Journal of Financial Economics, 49, 307-343. http://dx.doi.org/10.1016/S0304-405X(98)00027-0 Daniel, K., Hirshleifer, D., & Subrahmanyam, A. (1998). Investor psy- chology and investor security market under- and overreactions. Jour- nal of Finance, 53, 1839-1886. http://dx.doi.org/10.1111/0022-1082.00077 Barberis, N., Huang, M., & Santos, T. (2001). Prospect theory and asset prices. Quarterly Journal of Economics, 116, 1-53. http://dx.doi.org/10.1162/003355301556310 Gervais, S., & Odean, T. (2001). Learning to be overconfident. The Re- view of Financial Studies, 14, 1-27. http://dx.doi.org/10.1093/rfs/14.1.1 Bacchetta, P., & Wincoop, E. V. (2008). Higher order expectations in asset pricing. Journal of Money , Credit and Banking, 40, 837-866. http://dx.doi.org/10.1111/j.1538-4616.2008.00139.x |