

Paper Menu >>
Journal Menu >>
 Journal of Crystallization Process and Technology, 2013, 3, 170-174 http://dx.doi.org/10.4236/jcpt.2013.34026 Published Online October 2013 (http://www.scirp.org/journal/jcpt) Copyright © 2013 SciRes. JCPT Decomposition of Solutions in Front of the Interface Induced by Directional Crystallization A. Guskov1, L. Nekrasova2 1Institute of Solid State Physics of RAS, Chernogolovka, Russia; 2A. N. Sysin Research Institute of Human Ecology and of Environ- ment Hygiene RAMS, Mosc ow, Russia. Email: [email protected] Received October 7th, 2013; revised November 7th, 2013; accepted November 14th, 2013 Copyright © 2013 A. Guskov, L. Nekrasova. This is an open access article distributed under the Creative Commons Attribution Li- cense, which permits unrestricted use, distribution, and reproduction in any medium, provided the original work is properly cited. ABSTRACT Here we show the results of experimental observation of decomposition of the solution components into the neighbor- ing cells. The liquid solu tion under crystallization first gets into the unstable state and then decomposes. Th e decompo- sition result is fixed in the solid phase as inhomogeneous component distribution. Our experimental results enable to argue that the eutectic pattern forms due to interface instability and spinodal decomposition of non-equilibrium solution forming in front of the interface. Keywords: Spinodal Decomposition; Directional Crystallization; Eutectic; Phase Transformation; Metastable Phases 1. Introduction It has long been known that crystallization of liquid ho- mogeneous solutions of near eutectic composition often produces structures with periodic solid phase distribution. On the one hand, such structures are attractive for ap- plied science as materials with unique properties. On the other hand, their formation is of interest for fundamental science since their complicated space-time formation dy- namics remains unclear [1-3]. The most popular theory now in use is the Hunt-Jackson (HJ) one that enables a quantitative description of the feasibility of periodic com- ponent distribution upon liquid-solid phase transition of solutions [4]. Within this model the existing periodic solution of the diffusion equation along the interface pro- vides a formally adequate description of the experimen- tally obtained eutectic pattern. The undeniable advantage of the model is the hyperbolic d ependence o f the eutectic pattern period on the interface displacement rate. How- ever, some statements of the H-J theory raise questions. It is primarily the statement about periodic equilibrium component distribution on the interface. The assumption is a boundary condition for the diffusion problem and plays a key role in the whole H-J theory. According to the latter, on the interface there are three solution con- centration jumps: two concentration jumps between each of the two solid phases and the liquid phase and a jump between the solid phases located periodically along the interface. The problem is formally set similarly to the sta- tionary one-dimensional quasi-equilibrium Burton-Prim- Slichter (BPS) theory [5] that has a thermodynamic justi- fication, namely, small deviation of interface temperature and concentration from equilibrium conditions. In this case concentratio n jump occurs due to the equality of the chemical potentials of the co-existing phases. These con- ditions are also fulfilled within the H-J theory, yet, there is an additional phenomenon: periodic alternation of solid phases along the interface which is introduced as a formal dependence providing correct approximation of numerous experimental data. The phase alternation pe- riod is calculated using extra hypotheses. The periodic boundary condition brings about decomposition of solid solution in front of the interface. The thermodynamic condition of decomposition of solutions is their transition into the metastable (bino dal region) or unstab le (spinodal region) states. Such conditions are not considered within the H-J theory. Periodic interface distribution of concen- tration is usually explained by instability o f the interface. The extensive review presented in [6] considers the theo- ries of cell crystallization. However, there are no avail- able theories relating occurrence of a cell interface to alternation of cells in which the phase concentration is equal to its equilibrium values near eutectic tempera- ture. We present the results of experimental observation of formation of periodic eutectic pattern of two-component 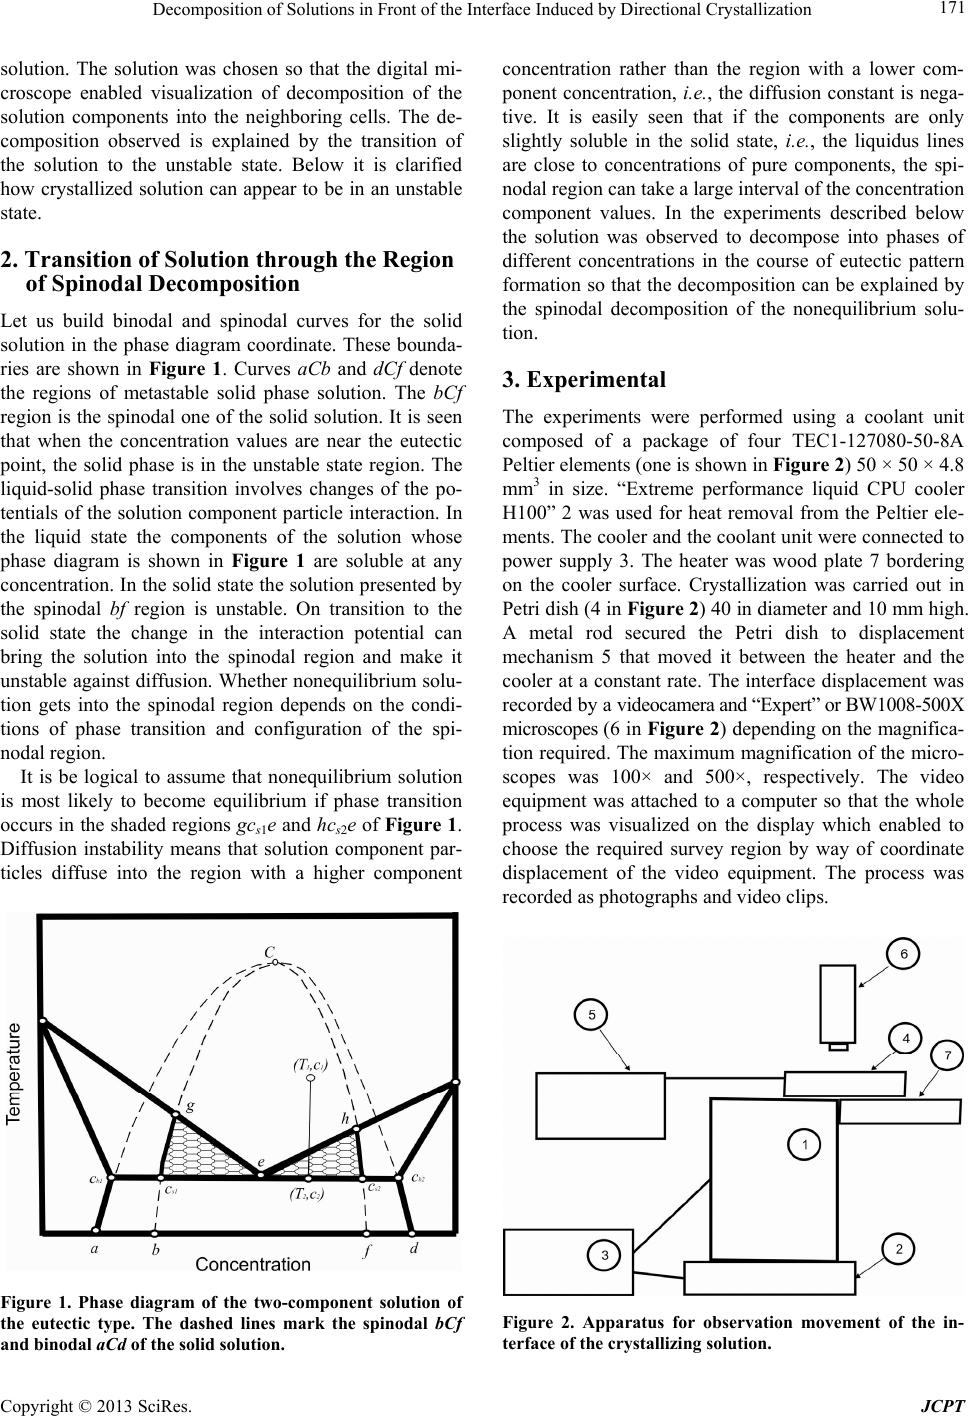 Decomposition of Solutions in Front of the Interface Induced by Directional Crystallization Copyright © 2013 SciRes. JCPT 171 solution. The solution was chosen so that the digital mi- croscope enabled visualization of decomposition of the solution components into the neighboring cells. The de- composition observed is explained by the transition of the solution to the unstable state. Below it is clarified how crystallized solution can appear to be in an unstable state. 2. Transition of Solution through the Region of Spinodal Decomposition Let us build binodal and spinodal curves for the solid solution in the phase diagram coordinate. These bounda- ries are shown in Figure 1. Curves aCb and dCf denote the regions of metastable solid phase solution. The bCf region is the spinodal one of the solid solution. It is seen that when the concentration values are near the eutectic point, the solid phase is in the unstable state region. The liquid-solid phase transition involves changes of the po- tentials of the solution component particle interaction. In the liquid state the components of the solution whose phase diagram is shown in Figure 1 are soluble at any concentration. In the solid state the solution presented by the spinodal bf region is unstable. On transition to the solid state the change in the interaction potential can bring the solution into the spinodal region and make it unstable against diffusion. Whether nonequilibrium solu- tion gets into the spinodal region depends on the condi- tions of phase transition and configuration of the spi- nodal region. It is be logical to assume that nonequilibrium solution is most likely to become equilibrium if phase transition occurs in the shaded regions gcs1e and hcs2e of Figure 1. Diffusion instability means that solution component par- ticles diffuse into the region with a higher component Figure 1. Phase diagram of the two-component solution of the eutectic type. The dashed lines mark the spinodal bCf and binodal aCd of the solid solution. concentration rather than the region with a lower com- ponent concentration, i.e., the diffusion constant is nega- tive. It is easily seen that if the components are only slightly soluble in the solid state, i.e., the liquidus lines are close to concentrations of pure components, the spi- nodal region can take a large interval of the concentration component values. In the experiments described below the solution was observed to decompose into phases of different concentrations in the course of eutectic pattern formation so that the decomposition can be explained by the spinodal decomposition of the nonequilibrium solu- tion. 3. Experimental The experiments were performed using a coolant unit composed of a package of four TEC1-127080-50-8A Peltier elements (one is shown in Figure 2) 50 × 50 × 4.8 mm3 in size. “Extreme performance liquid CPU cooler H100” 2 was used for heat removal from the Peltier ele- ments. The cooler and the coolant unit were connected to power supply 3. The heater was wood plate 7 bordering on the cooler surface. Crystallization was carried out in Petri dish (4 in Figure 2) 40 in diameter and 10 mm high. A metal rod secured the Petri dish to displacement mechanism 5 that moved it between the heater and the cooler at a constant rate. The interface displacement was rec ord e d by a videocamera and “Expert” or BW1008-500X microscopes (6 i n Figure 2) depending on the magnifica- tion required. The maximum magnification of the micro- scopes was 100× and 500×, respectively. The video equipment was attached to a computer so that the whole process was visualized on the display which enabled to choose the required survey region by way of coordinate displacement of the video equipment. The process was recorded as photographs and video clips. Figure 2. Apparatus for observation movement of the in- terface of the crystallizing solution. 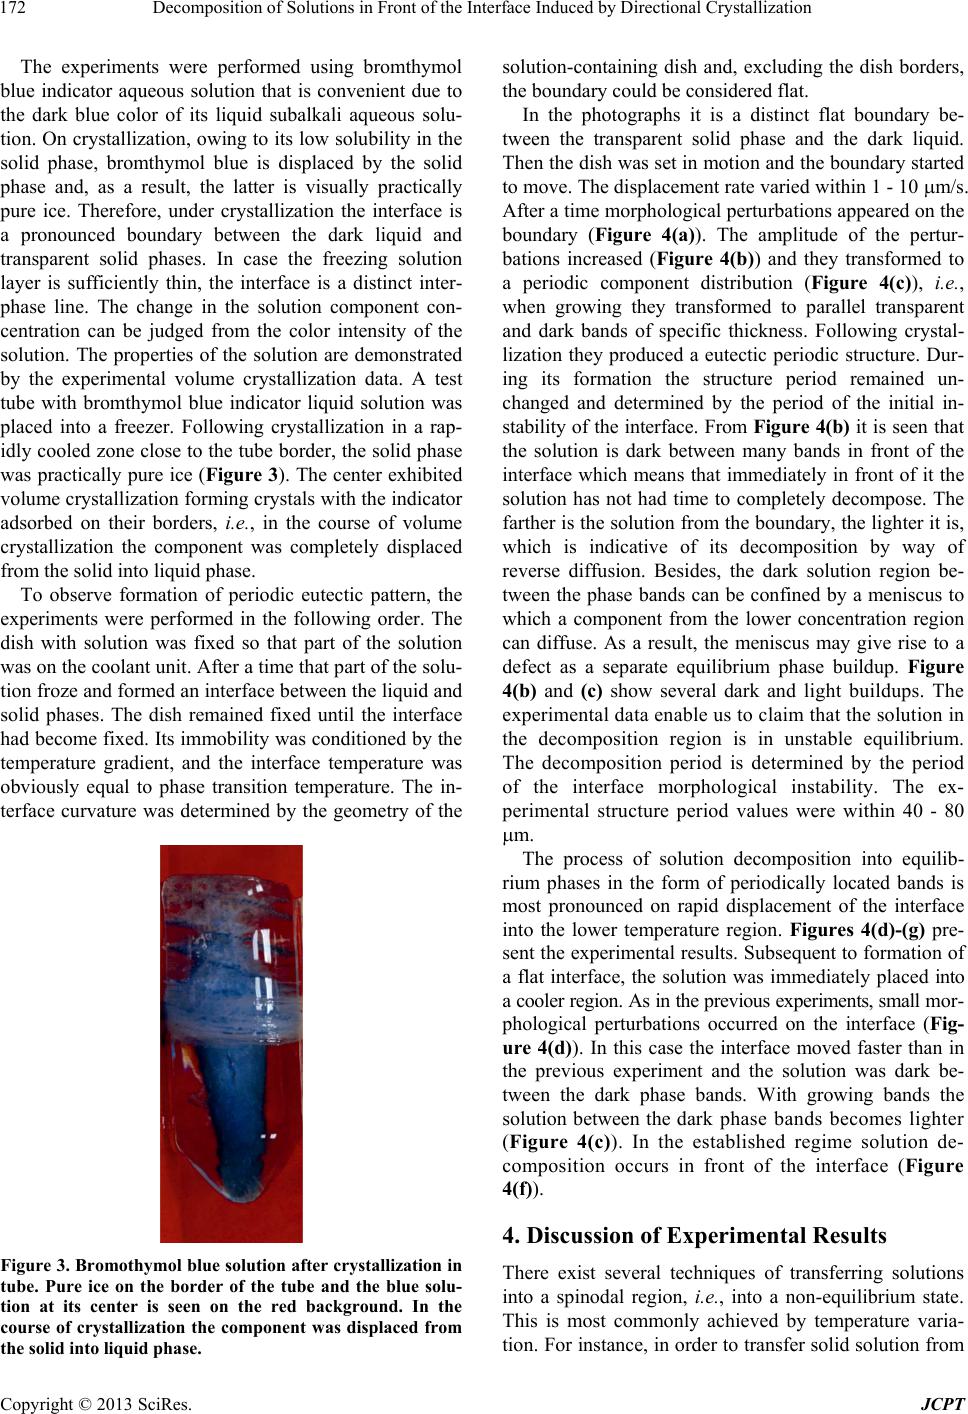 Decomposition of Solutions in Front of the Interface Induced by Directional Crystallization Copyright © 2013 SciRes. JCPT 172 The experiments were performed using bromthymol blue indicator aqueous solution that is convenient due to the dark blue color of its liquid subalkali aqueous solu- tion. On crystallization, owing to its low solubility in the solid phase, bromthymol blue is displaced by the solid phase and, as a result, the latter is visually practically pure ice. Therefore, under crystallization the interface is a pronounced boundary between the dark liquid and transparent solid phases. In case the freezing solution layer is sufficiently thin, the interface is a distinct inter- phase line. The change in the solution component con- centration can be judged from the color intensity of the solution. The properties of the solution are demonstrated by the experimental volume crystallization data. A test tube with bromthymol blue indicator liquid solution was placed into a freezer. Following crystallization in a rap- idly cooled zone close to the tube border, the solid phase was practically pure ice (Figure 3). The center exhibited volume crystallization forming crystals with the indicator adsorbed on their borders, i.e., in the course of volume crystallization the component was completely displaced from the solid into liquid phase. To observe formation of periodic eutectic pattern, the experiments were performed in the following order. The dish with solution was fixed so that part of the solution was on the coolant unit. After a time that part of the solu- tion froze and formed an interface between the liquid and solid phases. The dish remained fixed until the interface had become fixed. Its immobility was cond itioned by the temperature gradient, and the interface temperature was obviously equal to phase transition temperature. The in- terface curvature was determined by the geometry of the Figure 3. Bromothymol blue solution after crystallization in tube. Pure ice on the border of the tube and the blue solu- tion at its center is seen on the red background. In the course of crystallization the component was displaced from the solid into liquid phase. solution-containing dish and, excluding the dish borders, the boundary co uld be considered flat. In the photographs it is a distinct flat boundary be- tween the transparent solid phase and the dark liquid. Then the dish was set in motion and the boun dary started to move. The displacement rate varied within 1 - 10 m/s. After a time morphological perturbations appeared on the boundary (Figure 4(a)). The amplitude of the pertur- bations increased (Figure 4(b)) and they transformed to a periodic component distribution (Figure 4(c)), i.e., when growing they transformed to parallel transparent and dark bands of specific thickness. Following crystal- lization they produced a eutectic periodic structure. Dur- ing its formation the structure period remained un- changed and determined by the period of the initial in- stability of the interface. From Figure 4(b) it is seen that the solution is dark between many bands in front of the interface which means that immediately in front of it the solution has not had time to completely decompose. The farther is the solution from the bound ary, the lighter it is, which is indicative of its decomposition by way of reverse diffusion. Besides, the dark solution region be- tween the phase bands can be confined by a meniscus to which a component from the lower concentration region can diffuse. As a result, the meniscus may give rise to a defect as a separate equilibrium phase buildup. Figure 4(b) and (c) show several dark and light buildups. The experimental data enable us to claim that the solution in the decomposition region is in unstable equilibrium. The decomposition period is determined by the period of the interface morphological instability. The ex- perimental structure period values were within 40 - 80 m. The process of solution decomposition into equilib- rium phases in the form of periodically located bands is most pronounced on rapid displacement of the interface into the lower temperature region. Figures 4(d)-(g) pre- sent the experimental results. Subsequent to formation of a flat interface, the solution was immediately placed into a cooler region. As in the previous experiments, small mor - phological perturbations occurred on the interface (Fig- ure 4(d)). In this case the interface moved faster than in the previous experiment and the solution was dark be- tween the dark phase bands. With growing bands the solution between the dark phase bands becomes lighter (Figure 4(c)). In the established regime solution de- composition occurs in front of the interface (Figure 4(f)). 4. Discussion of Experimental Results There exist several techniques of transferring solutions into a spinodal region, i.e., into a non-equilibrium state. This is most commonly achieved by temperature varia- tion. For instance, in order to transfer solid so lution from 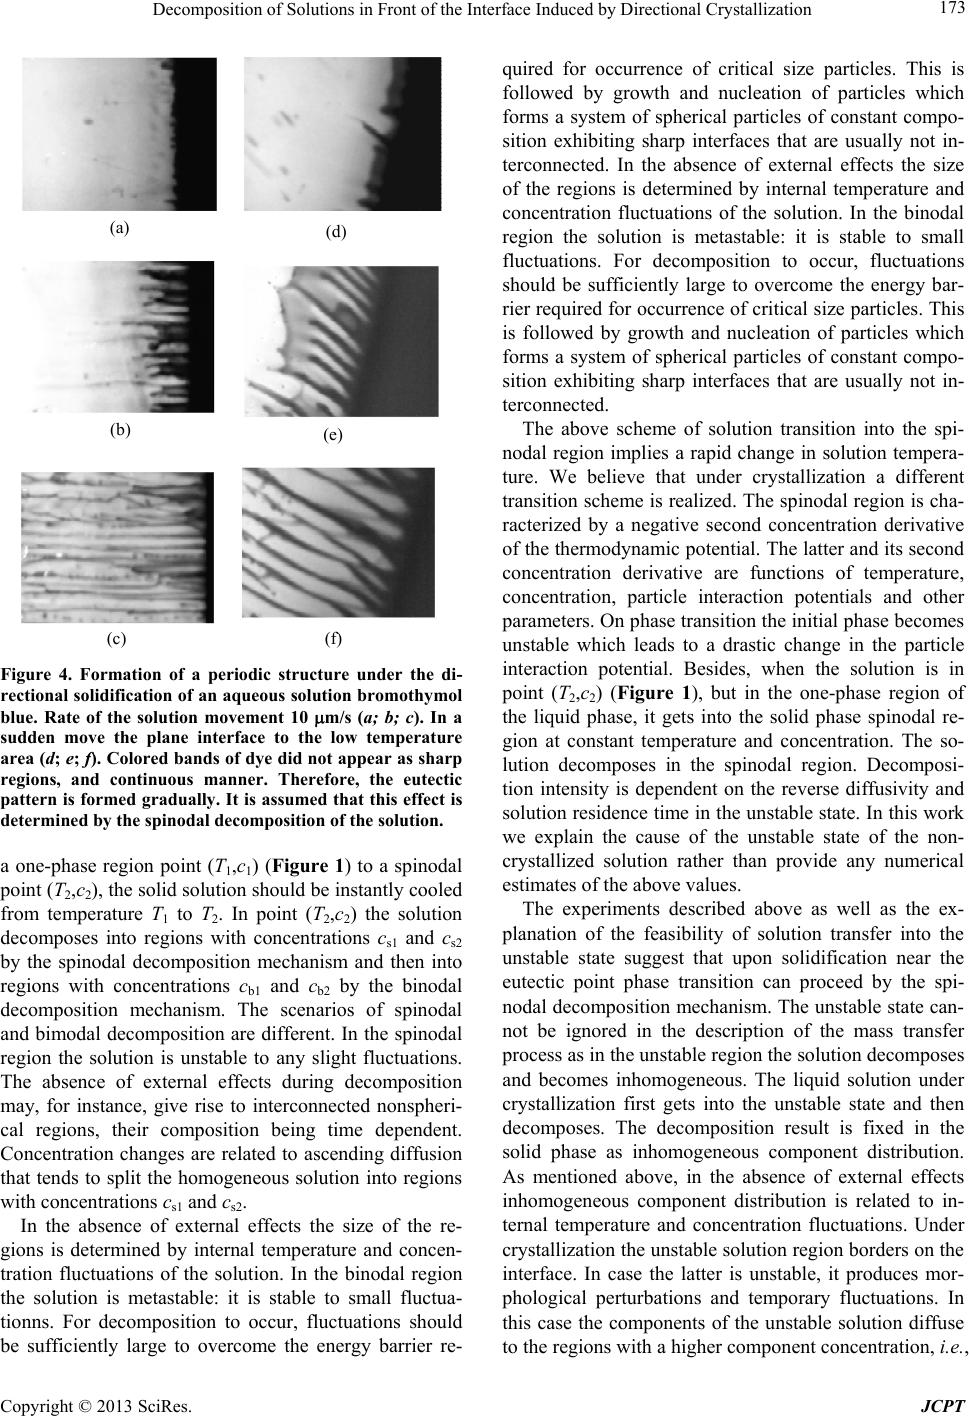 Decomposition of Solutions in Front of the Interface Induced by Directional Crystallization Copyright © 2013 SciRes. JCPT 173 (a) (d) (b) (e) (c) (f) Figure 4. Formation of a periodic structure under the di- rectional solidification of an aqueous solution bromothymol blue. Rate of the solution movement 10 m/s (a; b; c). In a sudden move the plane interface to the low temperature area (d; e; f). Colored bands of dye did not appear as sharp regions, and continuous manner. Therefore, the eutectic pattern is formed gradually. It is assumed that this effect is determined by the spinodal decomposition of the solution. a one-phase region point (T1,c1) (Figure 1) to a spinodal point (T2,c2), the solid solution should be in stantly co oled from temperature T1 to T2. In point (T2,c2) the solution decomposes into regions with concentrations cs1 and cs2 by the spinodal decomposition mechanism and then into regions with concentrations cb1 and cb2 by the binodal decomposition mechanism. The scenarios of spinodal and bimodal decomposition are different. In the spinodal region the solution is unstable to any slight fluctuations. The absence of external effects during decomposition may, for instance, give rise to interconnected nonspheri- cal regions, their composition being time dependent. Concentration changes are related to ascending diffusion that tends to split the homogeneous solution into regions with concen trations cs1 and cs2. In the absence of external effects the size of the re- gions is determined by internal temperature and concen- tration fluctuations of the solution. In the binodal region the solution is metastable: it is stable to small fluctua- tionns. For decomposition to occur, fluctuations should be sufficiently large to overcome the energy barrier re- quired for occurrence of critical size particles. This is followed by growth and nucleation of particles which forms a system of spherical particles of constant compo- sition exhibiting sharp interfaces that are usually not in- terconnected. In the absence of external effects the size of the regions is determined by internal temperature and concentration fluctuations of the solution. In the binodal region the solution is metastable: it is stable to small fluctuations. For decomposition to occur, fluctuations should be sufficiently large to overcome the energy bar- rier required for occurrence of critical size particles. This is followed by growth and nucleation of particles which forms a system of spherical particles of constant compo- sition exhibiting sharp interfaces that are usually not in- terconnected. The above scheme of solution transition into the spi- nodal region implies a rapid change in solution tempera- ture. We believe that under crystallization a different transition scheme is realized. The spinod al region is cha- racterized by a negative second concentration derivative of the thermodynamic potential. Th e latter and its second concentration derivative are functions of temperature, concentration, particle interaction potentials and other parameters. On phase transition the initial phase becomes unstable which leads to a drastic change in the particle interaction potential. Besides, when the solution is in point (T2,c2) (Figure 1), but in the one-phase region of the liquid phase, it gets into the solid phase spinodal re- gion at constant temperature and concentration. The so- lution decomposes in the spinodal region. Decomposi- tion intensity is dependent on the reverse diffusivity and solution residence time in the unstable state. In this work we explain the cause of the unstable state of the non- crystallized solution rather than provide any numerical estimates of the above values. The experiments described above as well as the ex- planation of the feasibility of solution transfer into the unstable state suggest that upon solidification near the eutectic point phase transition can proceed by the spi- nodal decompositio n mechanism. The unstable state can- not be ignored in the description of the mass transfer process as in the unstable region the solution decomposes and becomes inhomogeneous. The liquid solution under crystallization first gets into the unstable state and then decomposes. The decomposition result is fixed in the solid phase as inhomogeneous component distribution. As mentioned above, in the absence of external effects inhomogeneous component distribution is related to in- ternal temperature and concentration fluctuations. Under crystallization the unstab le solution region bord ers on the interface. In case the latter is unstable, it produces mor- phological perturbations and temporary fluctuations. In this case the components of the unstable solution diffuse to the regions with a higher component concentration, i.e.,  Decomposition of Solutions in Front of the Interface Induced by Directional Crystallization Copyright © 2013 SciRes. JCPT 174 towards the concentration maxima of the same compo- nent. Hence, the solution decomposes into stable phases with an interface instab ility period. In contrast to the H-J theory, this scheme of periodic eutectic pattern develop- ment does not require equilibrium conditions for a peri- odic component distribution along the interface; neither does it require any relationship of component distribution to virtual liquidus and solidus lines that continue the lines of phase transition into the region of lower eutectic tem- perature. Within the scheme presented the dependence of eutectic pattern on the interface displacement rate is not defined by extra hypotheses as required by the H-J theory, but it is represented by the solution of the dispersion re- lation of the interface stability problem under specific conditions of phase transition. The scheme presented is in good agreement with the experimentally observed concentration component redis- tribution in the process of periodic structure formation. The latter can be described as follows. The immobile interface is flat. In accordance with the quasi-equilibrium problem statement, the interface separates the liquid and solid phases and the concentrations on the interface de- fined by the equilibrium phase diagram. In the statio nary regime of interface displacement the excess of one of the components is displaced from the solid phase into the melt and, hence, a concentration jump occurs on the in- terface. Assume that between the solid and liquid phases there is a non-equilibrium solution layer. Then there are two interfaces in the stationary phase transition regime: one of them is between the stable liquid phase and the unstable solution, the other between the unstable phase and the solid solution. In accordance with the equilibrium phase diagram, in the ideal case the unstable solution between the stable liquid and stable solid phases decom- poses into two equilibrium phases. This means that the concentrations of the unstable solution on the stable liq- uid and solid phase interfaces are related by the equilib- rium distribution ratio. In this case there are no concen- tration jumps on the interfaces. The solution concentra- tion changes continuously from the initial concentration of the liquid solution to the concentration of the solid phase solution. Let the interface between the solid phase and the non-equilibrium layer be unstable (the diffusion coeffi- cient is negative as the diffusion problem refers to the non-equilibrium layer), which gives rise to increasing morphological perturbations (Figures 4(a) and (b)). The perturbation period is defined by the wave number with a maximum growth increment of interface instability. Due to ascending diffusion, the perturbations extend to the whole non-equilibrium solution layer including the in- terface between the liquid and instable solutions. Figure 4(b) demonstrates the change in the solution concentra- tion between the dark bands. The dark component dif- fuses towards the dark bands. As a result, only the light equilibrium phase remains between the bands. Thus, the solution in the non-equilibrium layer decomposes into equilibrium phases with an interface instability period. During interface displacement the regions of solution de- composition solidify to form a periodic alternation of equilibrium solid phase bands (Figures 4(c) and (f)). The latter are periodic structures formed under crystallization of eutectic solutions. 5. Conclusion It has been shown that periodic eutectic pattern form by way of spinodal decomposition of the solution in front of the interface. This changes qualitatively the explanation of eutectic pattern formation within the H-J theory. The data obtained reveal that between the liquid and solid phases considered in the H-J theory there exists a non- equilibrium unstable solution layer. The eutectic pattern is the result of spinodal decomposition of the solution under the interface instability influence. The decomposi- tion period is determined by the maximum of the insta- bility growth increment. 6. Acknowledgements The reported study was partially supported by RFBR, re- search project No. 11-03 -01259 and research proj ect No. 13-02-91156-a. REFERENCES [1] T. Himemiya, K. Ohsasa and T. Saga, “Eutectic Growth Model Using Cell-Automaton Method,” Materials Trans- actions, Vol. 51, No. 1, 2010, pp. 110-115. http://dx.doi.org/10.2320/matertrans.M2009304 [2] M. Serefoglu and R. E. Napolitano, “On the Selection of Rod-Type Eutectic Morphologies: Geometrical Constraint and Array Orienta tion, ” Acta Materialia, Vol. 56, No. 15, 2010, pp. 3862-3873. http://dx.doi.org/10.1016/j.actamat.2008.02.050 [3] R. Trivedi and N. Wang, “Theory of Rod Eutectic Growth under Far-from-Equilibrium Conditions,” Acta Materialia, Vol. 60, No. 6-7, 2012, pp. 3140-3152. http://dx.doi.org/10.1016/j.actamat.2012.02.020 [4] K. A. Jackson and J. D. Hunt, “Lamellar and Rod Eutec- tic Growth,” Metal. Soc. AIME, Vol. 236, No. 8, 1966, pp. 1129-1141. [5] W. G. Pfann, “Zone melting,” Wiley, New York, 1966. [6] D. A. Kessler, “Pattern Selection in Fingered Growth Phe- nomena,” Advances in Physics, Vol. 37, No. 3, 1988, pp. 255-339. http://dx.doi.org/10.1080/00018738800101379 |