

Paper Menu >>
Journal Menu >>
 Energy and Power Engineering, 2013, 5, 661-666 doi:10.4236/epe.2013.54B128 Published Online July 2013 (http://www.scirp.org/journal/epe) The Coupling of Voltage and Frequecncy Response in Splitting Island and Its Effects on Load-shedding Relays* Hao Yang, Baohui Zhang School of Electrilcal Engineering, Xi’an Jiaotong University, Xi’an, China Email: [email protected] Received February, 2013 ABSTRACT The voltage and frequency dynamics interact with each other in the island after splitting. The current frequency re- sponse model without considering the voltage effect would bring remarkable errors when analyzing the frequency dy- namic progress in the island with large-capacity active-power shortage. In this paper, coupling effects of voltage and frequency are studied to indicate that initial reactive-power deficit and load characteristics have strong effects on the coupling effects of the voltage and frequency. Moreover, control effects of currently used under frequency load-shed- ding relays (UFLS) and under voltage load-shedding relays (UVLS) which are installed and executed independently are examined to find that it would sometimes cause excessive or inadequate control without considering the coupling, sug- gesting that it is necessary to develop coordinate control methods for voltage and frequency problems. Keywords: Frequency Response; Coupling Effects; Splitting Island; Coordination Control 1. Introduction Frequency, voltage and angle stability are three main kinds of power system stability, respectively [1]. How- ever, when compared with the other two kinds, frequency stability has drawn less attention [2]. Currently, power grids in China has stepped into the age called large power grids, high voltage and large units[3], the fre- quency instability risk for the whole grid has decreased, but the risk for the region grids has increased[4], espe- cially with the growing amount of renewable energy. Once the region grids disconnected with the main one due to splitting accident, currently installed under fre- quency load-shedding device (UFLS) may fail to ensure the island frequency stability [5]. At present, the last line of defense ensuring frequency stability is UFLS, whose setting is commonly based on single-machine single-load frequency model, ignoring voltage effects on frequency, such as the system fre- quency response model (SFR) [6] and average system frequency model (ASF) [7]. In fact, there are obvious differences for voltage and frequency at different buses due to space-time distribution characteristics [8]. How- ever, there have been few studies about voltage effect on frequency dynamic. Owing to load characteristics, the negative effect of load-shedding on frequency recovery was first reported in [9]. Considering load-voltage ef- fects,less amount of load can be shed when UFLS per- forms [10]. Although some researchers have realized the value of coupling effects on frequency dynamic, the key factors affecting the interaction and the mechanism have not been analyzed carefully yet. Furthermore, few studies have been done on the effect of the coupling on the third line of defense for power system safety. In this paper, we will analysis how the coupling affects the frequency dynamic based on simulations of the con- ventional system. Our results would help to find the key factors affecting the interaction. Then the effects of the coupling on the UVLS and UFLS performance are veri- fied to indicate that it is necessary to develop the fre- quency and voltage combined control method. 2. Frequency Changing Characteristic in the Island The frequency response is decided by the active-power balance dynamic on the generator as expressed in equa- tions (1) - (4), which suggest that the load voltage can affect the system frequency response through changing the absorbed active-power of its own : NN ,, 11 M. coi i mi etotal eq ii df PPP dt (1) *The work Project Supported by State Grid Corporation of China, Major Projects on Planning and Operation Control of Large Scale Grid(SGCC-MPLG030-2 012) ,, , 1 . N ie jlkl ijLkM PP P (2) Copyright © 2013 SciRes. EPE 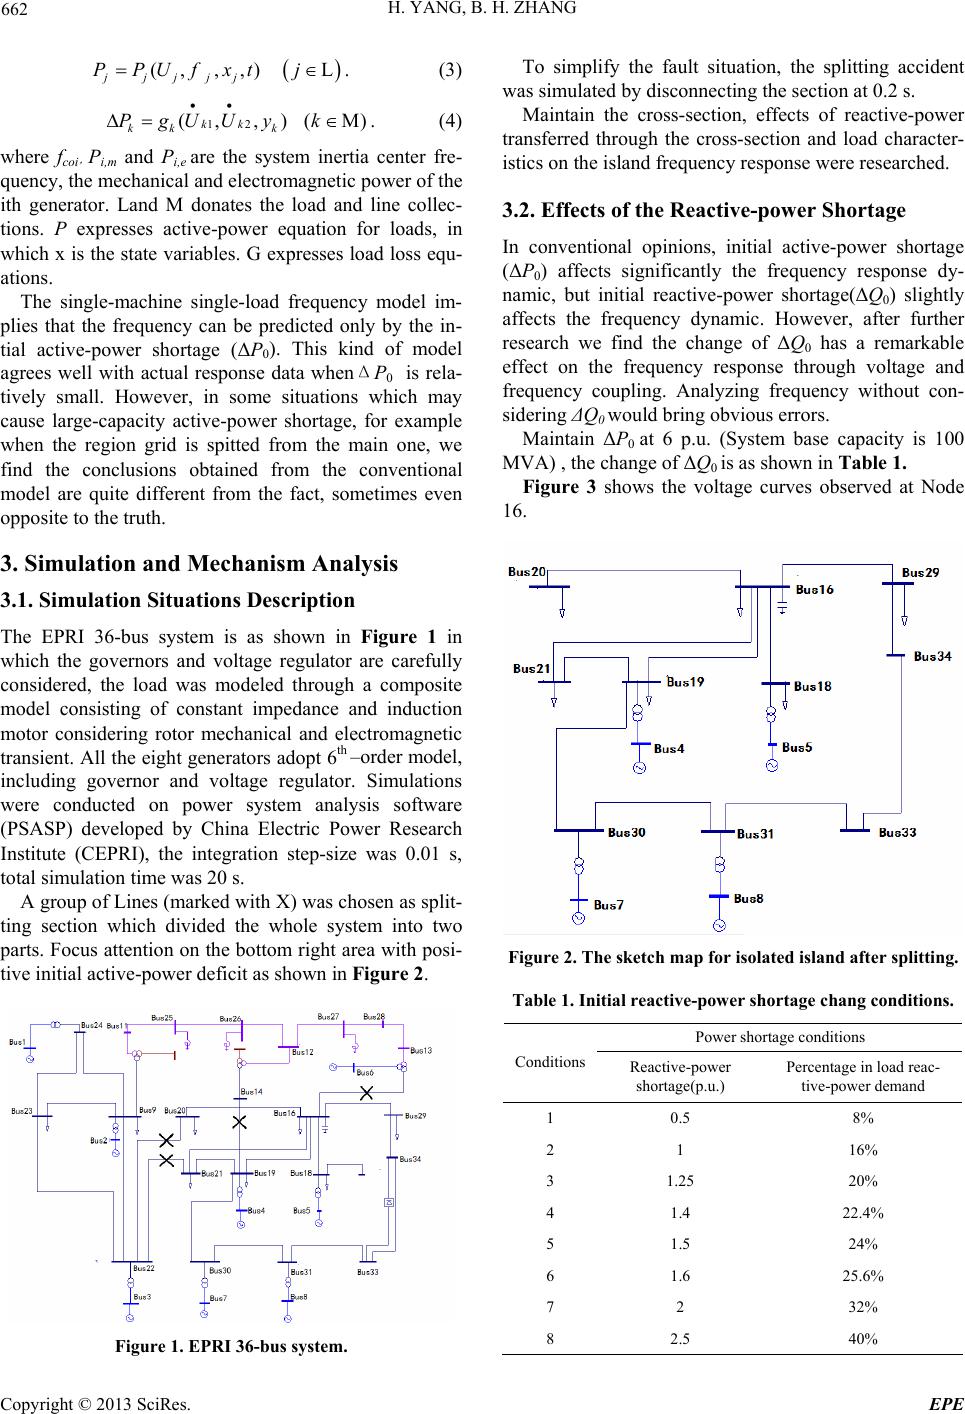 H. YANG, B. H. ZHANG 662 (, ,,)L. jjjjj PPUfxt j (3) 12 (, ,)(M) kk kk k PgUUy k . (4) where fcoi , Pi,m and Pi,e are the system inertia center fre- quency, the mechanical and electromagnetic power of the ith generator. Land M donates the load and line collec- tions. P expresses active-power equation for loads, in which x is the state variables. G expresses load loss equ- ations. The single-machine single-load frequency model im- plies that the frequency can be predicted only by the in- tial active-power shortage (ΔP0). This kind of model agrees well with actual response data whenΔP0 is rela- tively small. However, in some situations which may cause large-capacity active-power shortage, for example when the region grid is spitted from the main one, we find the conclusions obtained from the conventional model are quite different from the fact, sometimes even opposite to the truth. 3. Simulation and Mechanism Analysis 3.1. Simulation Situations Description The EPRI 36-bus system is as shown in Figure 1 in which the governors and voltage regulator are carefully considered, the load was modeled through a composite model consisting of constant impedance and induction motor considering rotor mechanical and electromagnetic transient. All the eight generators adopt 6th –order model, including governor and voltage regulator. Simulations were conducted on power system analysis software (PSASP) developed by China Electric Power Research Institute (CEPRI), the integration step-size was 0.01 s, total simulation time was 20 s. A group of Lines (marked with X) was chosen as split- ting section which divided the whole system into two parts. Focus attention on the bottom right area with posi- tive initial active-power deficit as shown in Figure 2. Figure 1. EPRI 36-bus system. To simplify the fault situation, the splitting accident was simulated by disconnecting the section at 0.2 s. Maintain the cross-section, effects of reactive-power transferred through the cross-section and load character- istics on the island frequency response were researched. 3.2. Effects of the Reactive-power Shortage In conventional opinions, initial active-power shortage (ΔP0) affects significantly the frequency response dy- namic, but initial reactive-power shortage(ΔQ0) slightly affects the frequency dynamic. However, after further research we find the change of ΔQ0 has a remarkable effect on the frequency response through voltage and frequency coupling. Analyzing frequency without con- sidering ΔQ0 would bring obvious errors. Maintain ΔP0 at 6 p.u. (System base capacity is 100 MVA) , the change of ΔQ0 is as shown in Table 1. Figure 3 shows the voltage curves observed at Node 16. Figure 2. The sketch map for isolated island after splitting. Table 1. Initial reactive-power shortage chang conditions. Power shortage conditions Conditions Reactive-power shortage(p.u.) Percentage in load reac- tive-power demand 1 0.5 8% 2 1 16% 3 1.25 20% 4 1.4 22.4% 5 1.5 24% 6 1.6 25.6% 7 2 32% 8 2.5 40% Copyright © 2013 SciRes. EPE 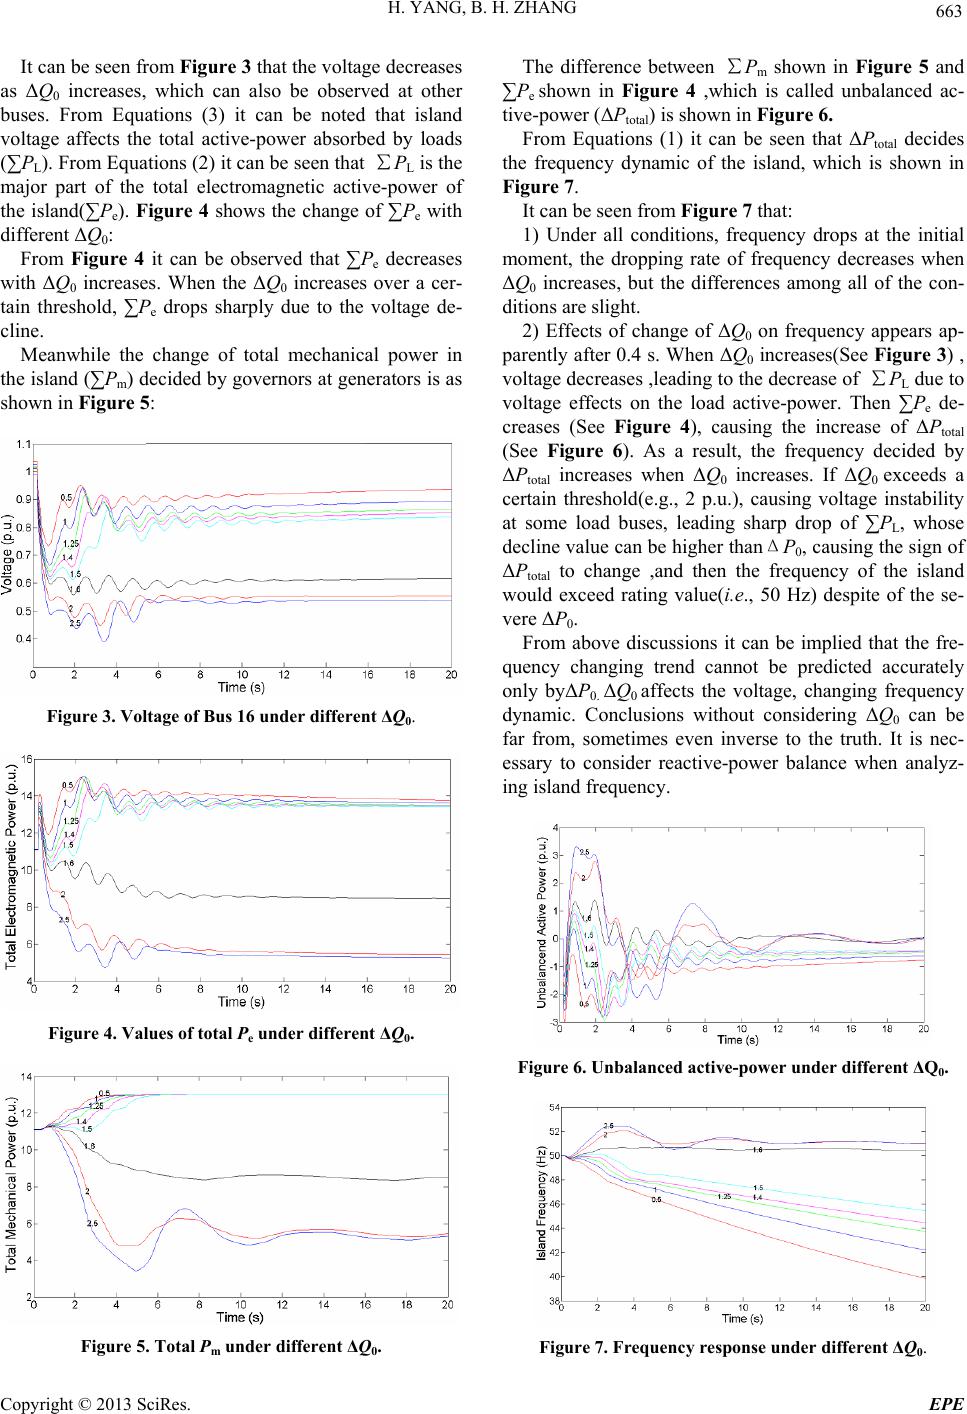 H. YANG, B. H. ZHANG 663 It can be seen from Figure 3 that the voltage decreases as ΔQ0 increases, which can also be observed at other buses. From Equations (3) it can be noted that island voltage affects the total active-power absorbed by loads (∑PL). From Equations (2) it can be seen that ∑PL is the major part of the total electromagnetic active-power of the island(∑Pe). Figure 4 shows the change of ∑Pe with different ΔQ0: From Figure 4 it can be observed that ∑Pe decreases with ΔQ0 increases. When the ΔQ0 increases over a cer- tain threshold, ∑Pe drops sharply due to the voltage de- cline. Meanwhile the change of total mechanical power in the island (∑Pm) decided by governors at generators is as shown in Figure 5: Figure 3. Voltage of Bus 16 under different ΔQ0. Figure 4. Values of total Pe under different ΔQ0. Figure 5. Total Pm under different ΔQ0. The difference between ∑Pm shown in Figure 5 and ∑Pe shown in Figure 4 ,which is called unbalanced ac- tive-power (ΔPtotal) is shown in Figure 6. From Equations (1) it can be seen that ΔPtotal decides the frequency dynamic of the island, which is shown in Figure 7. It can be seen from Figure 7 that: 1) Under all conditions, frequency drops at the initial moment, the dropping rate of frequency decreases when ΔQ0 increases, but the differences among all of the con- ditions are slight. 2) Effects of change of ΔQ0 on frequency appears ap- parently after 0.4 s. When ΔQ0 increases(See Figure 3) , voltage decreases ,leading to the decrease of ∑PL due to voltage effects on the load active-power. Then ∑Pe de- creases (See Figure 4), causing the increase of ΔPtotal (See Figure 6). As a result, the frequency decided by ΔPtotal increases when ΔQ0 increases. If ΔQ0 exceeds a certain threshold(e.g., 2 p.u.), causing voltage instability at some load buses, leading sharp drop of ∑PL, whose decline value can be higher thanΔP0, causing the sign of ΔPtotal to change ,and then the frequency of the island would exceed rating value(i.e., 50 Hz) despite of the se- vere ΔP0. From above discussions it can be implied that the fre- quency changing trend cannot be predicted accurately only byΔP0. ΔQ0 affects the voltage, changing frequency dynamic. Conclusions without considering ΔQ0 can be far from, sometimes even inverse to the truth. It is nec- essary to consider reactive-power balance when analyz- ing island frequency. Figure 6. Unbalanced active-power under different ΔQ0. Figure 7. Frequency response under different ΔQ0. Copyright © 2013 SciRes. EPE 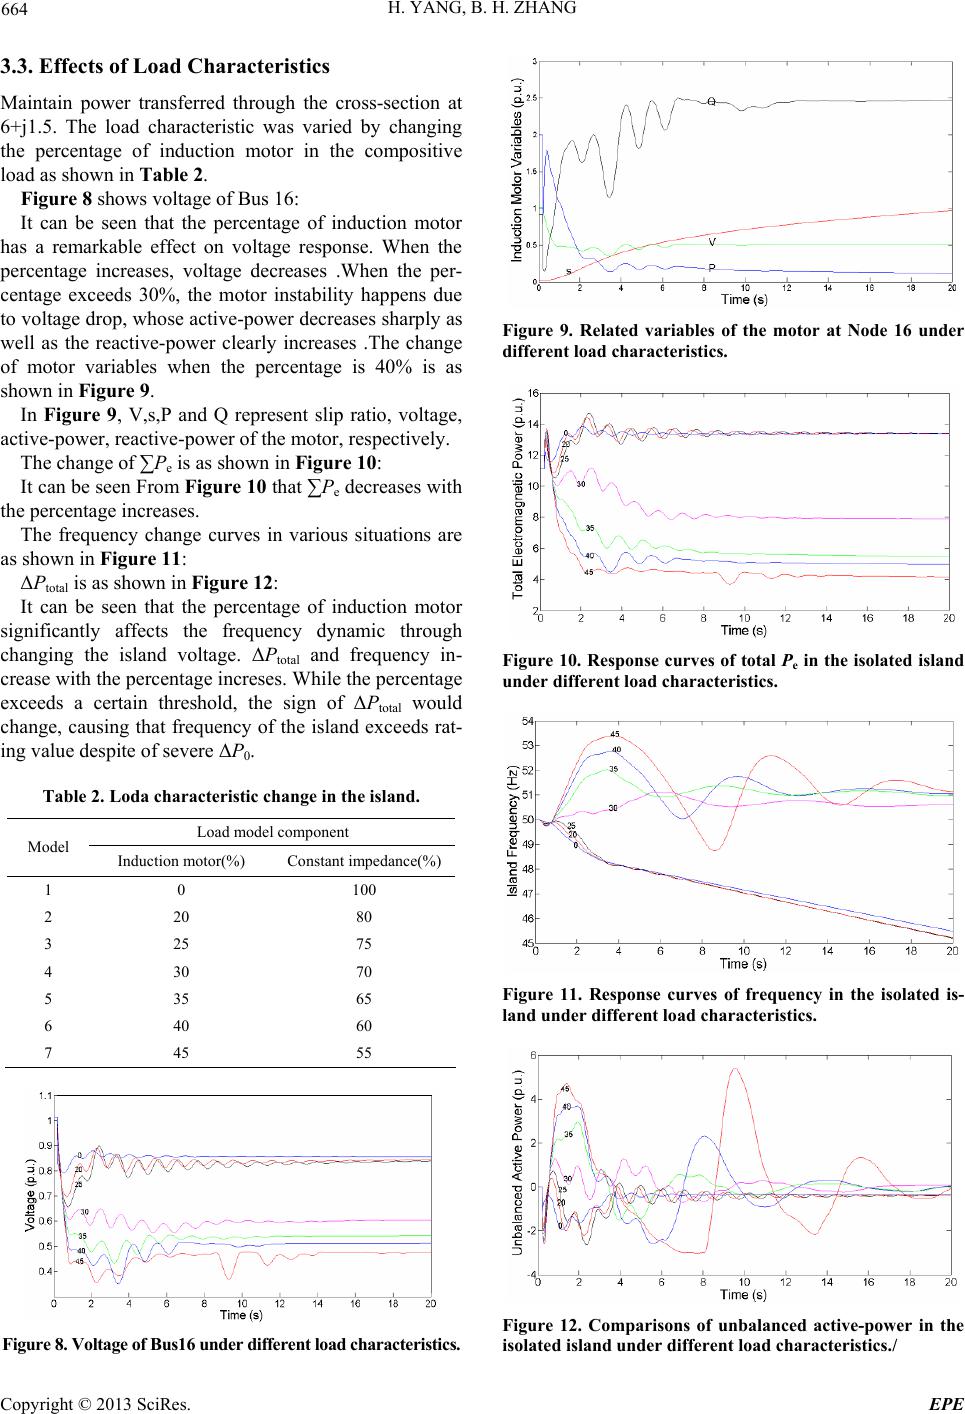 H. YANG, B. H. ZHANG 664 3.3. Effects of Load Characteristics Maintain power transferred through the cross-section at 6+j1.5. The load characteristic was varied by changing the percentage of induction motor in the compositive load as shown in Table 2. Figure 8 shows voltage of Bus 16: It can be seen that the percentage of induction motor has a remarkable effect on voltage response. When the percentage increases, voltage decreases .When the per- centage exceeds 30%, the motor instability happens due to voltage drop, whose active-power decreases sharply as well as the reactive-power clearly increases .The change of motor variables when the percentage is 40% is as shown in Figure 9. In Figure 9, V,s,P and Q represent slip ratio, voltage, active-power, reactive-power of the motor, respectively. The change of ∑Pe is as shown in Figure 10: It can be seen From Figure 10 that ∑Pe decreases with the percentage increases. The frequency change curves in various situations are as shown in Figure 11: ΔPtotal is as shown in Figure 12: It can be seen that the percentage of induction motor significantly affects the frequency dynamic through changing the island voltage. ΔPtotal and frequency in- crease with the percentage increses. While the percentage exceeds a certain threshold, the sign of ΔPtotal would change, causing that frequency of the island exceeds rat- ing value despite of severe ΔP0. Table 2. Loda characteristic change in the island. Load model component Model Induction motor(%) Constant impedance(%) 1 0 100 2 20 80 3 25 75 4 30 70 5 35 65 6 40 60 7 45 55 Figure 8. Voltage of Bus16 under different load characteristics. Figure 9. Related variables of the motor at Node 16 under different load characteristics. Figure 10. Response curves of total Pe in the isolated island under different load characteristics. Figure 11. Response curves of frequency in the isolated is- land under different load characteristics. Figure 12. Comparisons of unbalanced active-power in the isolated island under different load characteristics./ Copyright © 2013 SciRes. EPE 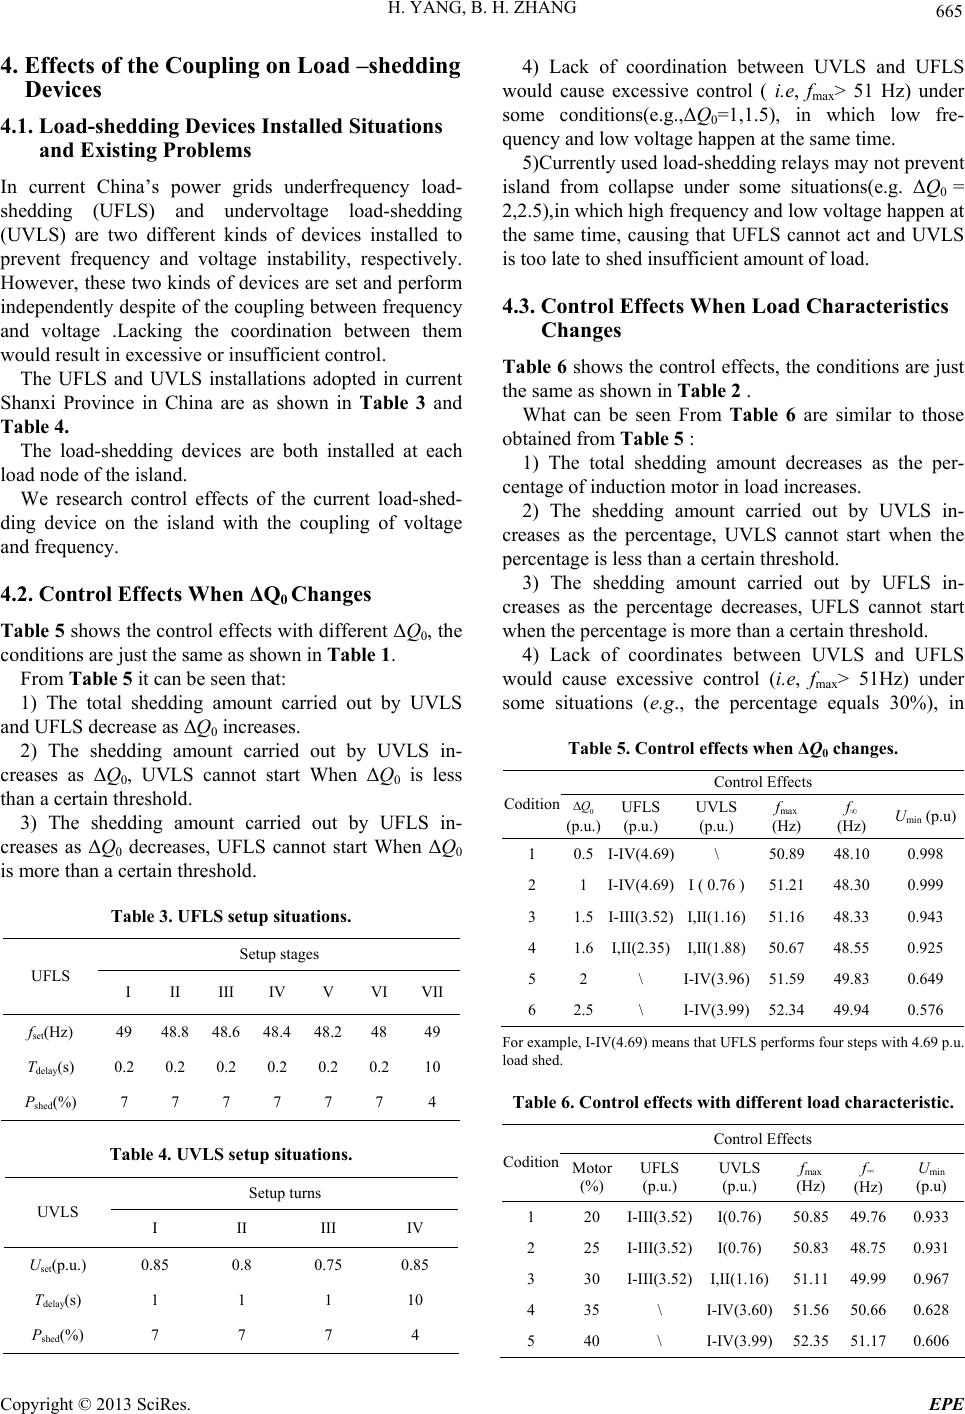 H. YANG, B. H. ZHANG 665 4. Effects of the Coupling on Load –shedding Devices 4.1. Load-shedding Devices Installed Situations and Existing Problems In current China’s power grids underfrequency load- shedding (UFLS) and undervoltage load-shedding (UVLS) are two different kinds of devices installed to prevent frequency and voltage instability, respectively. However, these two kinds of devices are set and perform independently despite of the coupling between frequency and voltage .Lacking the coordination between them would result in excessive or insufficient control. The UFLS and UVLS installations adopted in current Shanxi Province in China are as shown in Table 3 and Table 4. The load-shedding devices are both installed at each load node of the island. We research control effects of the current load-shed- ding device on the island with the coupling of voltage and frequency. 4.2. Control Effects When ΔQ0 Changes Table 5 shows the control effects with different ΔQ0, the conditions are just the same as shown in Table 1. From Table 5 it can be seen that: 1) The total shedding amount carried out by UVLS and UFLS decrease as ΔQ0 increases. 2) The shedding amount carried out by UVLS in- creases as ΔQ0, UVLS cannot start When ΔQ0 is less than a certain threshold. 3) The shedding amount carried out by UFLS in- creases as ΔQ0 decreases, UFLS cannot start When ΔQ0 is more than a certain threshold. Table 3. UFLS setup situations. Setup stages UFLS I II III IV V VI VII fset(Hz) 49 48.8 48.6 48.4 48.2 48 49 Tdelay(s) 0.2 0.2 0.2 0.2 0.2 0.210 Pshed(%) 7 7 7 7 7 7 4 Table 4. UVLS setup situations. Setup turns UVLS I II III IV Uset(p.u.) 0.85 0.8 0.75 0.85 Tdelay(s) 1 1 1 10 Pshed(%) 7 7 7 4 4) Lack of coordination between UVLS and UFLS would cause excessive control ( i.e, fmax > 51 Hz) under some conditions(e.g.,ΔQ0=1,1.5), in which low fre- quency and low voltage happen at the same time. 5)Currently used load-shedding relays may not prevent island from collapse under some situations(e.g. ΔQ0 = 2,2.5),in which high frequency and low voltage happen at the same time, causing that UFLS cannot act and UVLS is too late to shed insufficient amount of load. 4.3. Control Effects When Load Characteristics Changes Table 6 shows the control effects, the conditions are just the same as shown in Table 2 . What can be seen From Table 6 are similar to those obtained from Table 5 : 1) The total shedding amount decreases as the per- centage of induction motor in load increases. 2) The shedding amount carried out by UVLS in- creases as the percentage, UVLS cannot start when the percentage is less than a certain threshold. 3) The shedding amount carried out by UFLS in- creases as the percentage decreases, UFLS cannot start when the percentage is more than a certain threshold. 4) Lack of coordinates between UVLS and UFLS would cause excessive control (i.e, fmax> 51Hz) under some situations (e.g., the percentage equals 30%), in Table 5. Control effects when ΔQ0 changes. Control Effects Codition 0 Q (p.u.) UFLS (p.u.) UVLS (p.u.) fmax (Hz) f∞ (Hz) Umin (p.u) 1 0.5I-IV(4.69)\ 50.89 48.10 0.998 2 1 I-IV(4.69)I ( 0.76 ) 51.21 48.30 0.999 3 1.5I-III(3.52)I,II(1.16) 51.16 48.33 0.943 4 1.6I,II(2.35)I,II(1.88) 50.67 48.55 0.925 5 2 \ I-IV(3.96) 51.59 49.83 0.649 6 2.5\ I-IV(3.99) 52.34 49.94 0.576 For example, I-IV(4.69) means that UFLS performs four steps with 4.69 p.u. load shed. Table 6. Control effects with different load characteristic. Control Effects Codition Motor (%) UFLS (p.u.) UVLS (p.u.) fmax (Hz) f∞ (Hz) Umin (p.u) 1 20 I-III(3.52)I(0.76) 50.85 49.760.933 2 25 I-III(3.52)I(0.76) 50.83 48.750.931 3 30 I-III(3.52)I,II(1.16) 51.11 49.990.967 4 35 \ I-IV(3.60) 51.56 50.660.628 5 40 \ I-IV(3.99) 52.35 51.170.606 Copyright © 2013 SciRes. EPE 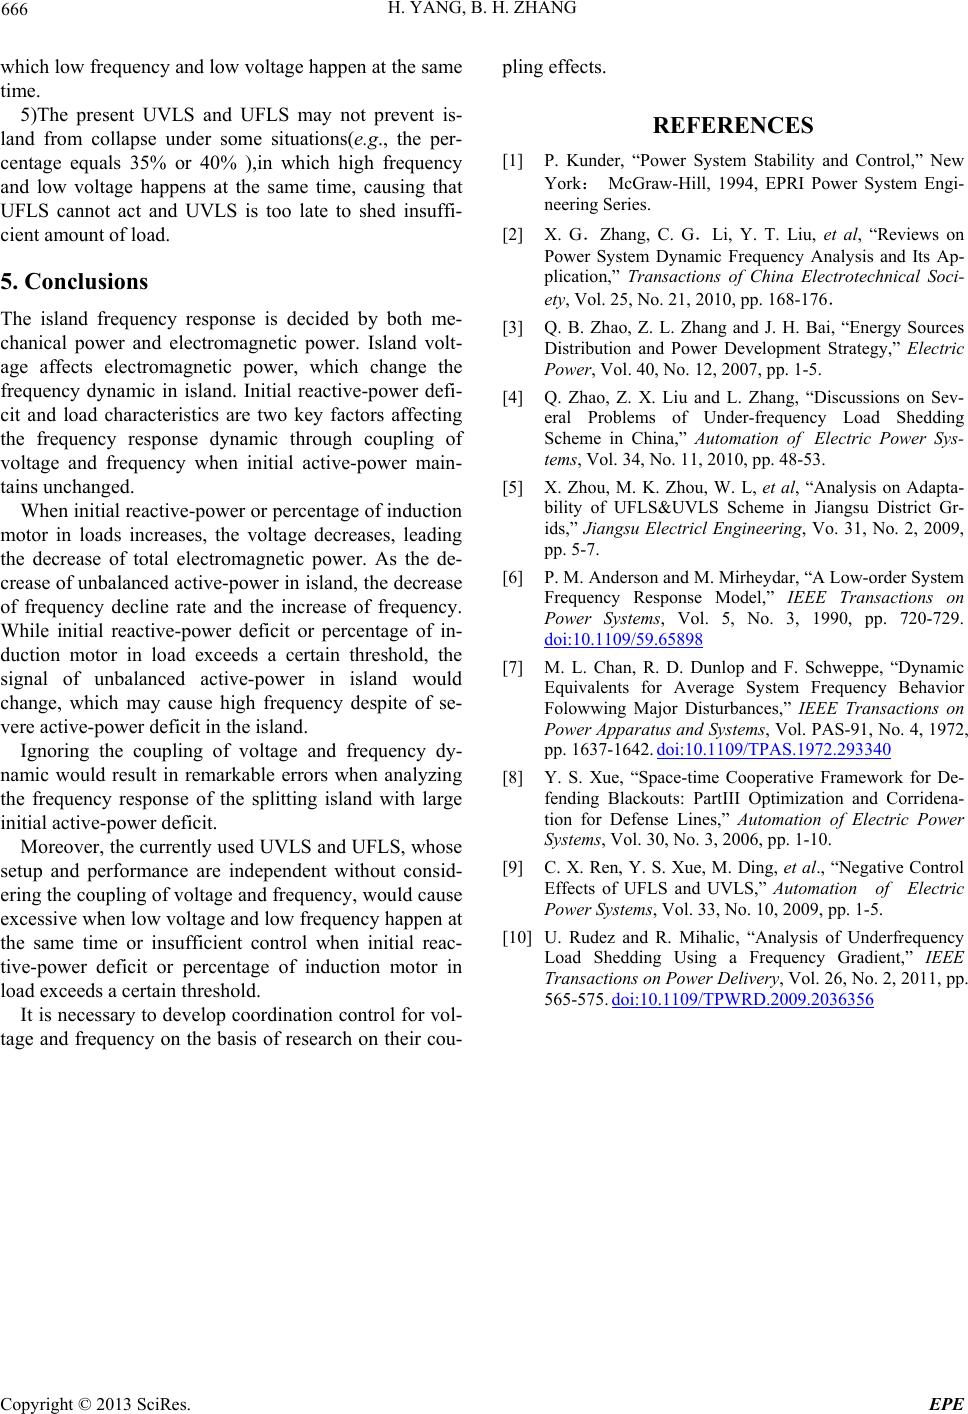 H. YANG, B. H. ZHANG Copyright © 2013 SciRes. EPE 666 which low frequency and low voltage happen at the same time. 5)The present UVLS and UFLS may not prevent is- land from collapse under some situations(e.g., the per- centage equals 35% or 40% ),in which high frequency and low voltage happens at the same time, causing that UFLS cannot act and UVLS is too late to shed insuffi- cient amount of load. 5. Conclusions The island frequency response is decided by both me- chanical power and electromagnetic power. Island volt- age affects electromagnetic power, which change the frequency dynamic in island. Initial reactive-power defi- cit and load characteristics are two key factors affecting the frequency response dynamic through coupling of voltage and frequency when initial active-power main- tains unchanged. When initial reactive-power or percentage of induction motor in loads increases, the voltage decreases, leading the decrease of total electromagnetic power. As the de- crease of unbalanced active-power in island, the decrease of frequency decline rate and the increase of frequency. While initial reactive-power deficit or percentage of in- duction motor in load exceeds a certain threshold, the signal of unbalanced active-power in island would change, which may cause high frequency despite of se- vere active-power deficit in the island. Ignoring the coupling of voltage and frequency dy- namic would result in remarkable errors when analyzing the frequency response of the splitting island with large initial active-power deficit. Moreover, the currently used UVLS and UFLS, whose setup and performance are independent without consid- ering the coupling of voltage and frequency, would cause excessive when low voltage and low frequency happen at the same time or insufficient control when initial reac- tive-power deficit or percentage of induction motor in load exceeds a certain threshold. It is necessary to develop coordination control for vol- tage and frequency on the basis of research on their cou- pling effects. REFERENCES [1] P. Kunder, “Power System Stability and Control,” New York: McGraw-Hill, 1994, EPRI Power System Engi- neering Series. [2] X. G.Zhang, C. G.Li, Y. T. Liu, et al, “Reviews on Power System Dynamic Frequency Analysis and Its Ap- plication,” Transactions of China Electrotechnical Soci- ety, Vol. 25, No. 21, 2010, pp. 168-176. [3] Q. B. Zhao, Z. L. Zhang and J. H. Bai, “Energy Sources Distribution and Power Development Strategy,” Electric Power, Vol. 40, No. 12, 2007, pp. 1-5. [4] Q. Zhao, Z. X. Liu and L. Zhang, “Discussions on Sev- eral Problems of Under-frequency Load Shedding Scheme in China,” Automation of Electric Power Sys- tems, Vol. 34, No. 11, 2010, pp. 48-53. [5] X. Zhou, M. K. Zhou, W. L, et al, “Analysis on Adapta- bility of UFLS&UVLS Scheme in Jiangsu District Gr- ids,” Jiangsu Electricl Engineering, Vo. 31, No. 2, 2009, pp. 5-7. [6] P. M. Anderson and M. Mirheydar, “A Low-order System Frequency Response Model,” IEEE Transactions on Power Systems, Vol. 5, No. 3, 1990, pp. 720-729. doi:10.1109/59.65898 [7] M. L. Chan, R. D. Dunlop and F. Schweppe, “Dynamic Equivalents for Average System Frequency Behavior Folowwing Major Disturbances,” IEEE Transactions on Power Apparatus and Systems, Vol. PAS-91, No. 4, 1972, pp. 1637-1642. doi:10.1109/TPAS.1972.293340 [8] Y. S. Xue, “Space-time Cooperative Framework for De- fending Blackouts: PartIII Optimization and Corridena- tion for Defense Lines,” Automation of Electric Power Systems, Vol. 30, No. 3, 2006, pp. 1-10. [9] C. X. Ren, Y. S. Xue, M. Ding, et al., “Negative Control Effects of UFLS and UVLS,” Automation of Electric Power Systems, Vol. 33, No. 10, 2009, pp. 1-5. [10] U. Rudez and R. Mihalic, “Analysis of Underfrequency Load Shedding Using a Frequency Gradient,” IEEE Transactions on Power Delivery, Vol. 26, No. 2, 2011, pp. 565-575. doi:10.1109/TPWRD.2009.2036356 |