

Paper Menu >>
Journal Menu >>
 Engineering, 2013, 5, 154-157 http://dx.doi.org/10.4236/eng.2013.510B033 Published Online October 2013 (http://www.scirp.org/journal/eng) Copyright © 2013 SciRes. ENG Determination of Eight Sudan Dyes in Chili Powder by UPLC-MS/MS Lin Wang, Jie Zheng, Zhe Zhang, Tiesong Wang, Baoquan Che* Beijing Institute for Drug Control, Beijing, 100035, China Email: *[email protected] Received April 2013 ABSTRACT Sudan dyes are synthetic azo dyes which are widely used in industry. Although th ey are not allowed in foods tuffs, they have been found contaminating in different food products and their presence is regularly reported. It is assumed that these appearances are due to cross-contamination or adulteration. In this paper, we present a newly developed fast and sensitive method for the quantification of eight Sudan dyes, using liquid-liquid extraction and UPLC-MS/MS an alysis. The calibration curves were linear over the range of 0.1 - 25 mg/kg. Mean recovery for the eight Sudan dyes ranged from 80.7% to 104.4%, and with the inter-day and intra-day precisions ranged from 2.24% to 12.2%. The method was successfully applied in the determination of Sudan dyes in chili powder of 10 samples. Keywords: Sudan Dyes; UPLC-MS/MS; Chili Powder 1. Introduction Sudan dyes are dynthetic fat-soluble azo-compounds, characterized by chromophoric azo groups (-N=N-) [1]. The chemical structures of Sudan I, Sudan II, Sudan III, Sudan IV, Sudan Red G, Sudan Red 7B, Sudan Black B and Sudan Y e llow are given in Figure 1. These dyes are extensively used as colorants in food, cosmetics, waxed, solvents, textiles, and so on. Lots of them are found in various foodstuffs, like chili powder, curry, or chili sauces fraudulently [2]. These azo dyes are metabolized to possible carcinogenic colorless amines that can form DNA adducts entailing mutations [3]. Su- dan I has been found to be carcinogenic in the rat and to produce tumors in the liver of mice. Sudan II increases the incidence of bladder carcinomas, and Sudan IV in- creases the risk of formation of local carcomas [4,5]. Besides, Sudan III is included in different laboratory techniques for tissue ceroid and lipofucsin analysis [6]. Also, Sudan Black B, which is considered slightly ha- zardous in the case of skin contact and toxic to mucus membranes, is extensively used in diagnostic methods [7]. Sudan I, II, and III as well as Sudan Red 7B, and Sudan Black B reaction products have been declared suspected carcinogens and classified group 3 compounds by the International Agency for Research on Cancer [8, 9]. Therefore, Sudan dyes are not safe for humans, and a sensitive and convenient method for the determination of Sudan dyes is required. Several methods based on liquid chromatography with UV or MS detection [10-12] or on gas chromatography mass spectrometry have been developed for analysis of Sudan I-IV. Although these methods have been success- fully applied to analysis of the dyes at trace levels in food products, they often require complicated pretreatment, for example, more than one solvent extraction, solid- phase extraction, rotary evaporation, etc. The extr action and concentration procedures are time-consuming and the results might be interfered in matrix effect. Un til now, the methods for the analysis of Sudan Red G, Sudan Red 7B, and Sudan Black B are very few [13], and no report on the analysis of Sudan Yellow. To our knowledge, this is the first research on the determination of eight Sudan dyes. In this study, a sensitive , robust, and fa st meth od ba sed on UPLC-ESI-MS/MS was developed to determine eight Sudan dyes in chili powder. The technique of extra ct io n current of mass spectrometry was to eliminate the inter- ference from the co-eluted substances in the complex samp l e. The matrix effect was discussed, and the deter- mination was accurate. The validated method was suc- cessfully applied in the quantification of eight Sudan dyes in 10 samples. 2. Experimental 2.1. Reagents Sudan I, Sudan II, Sudan III, Sudan IV, Sudan Red G, Sudan Red 7B, Sudan Black B and Sudan Yellow were *Corresponding a uthor. 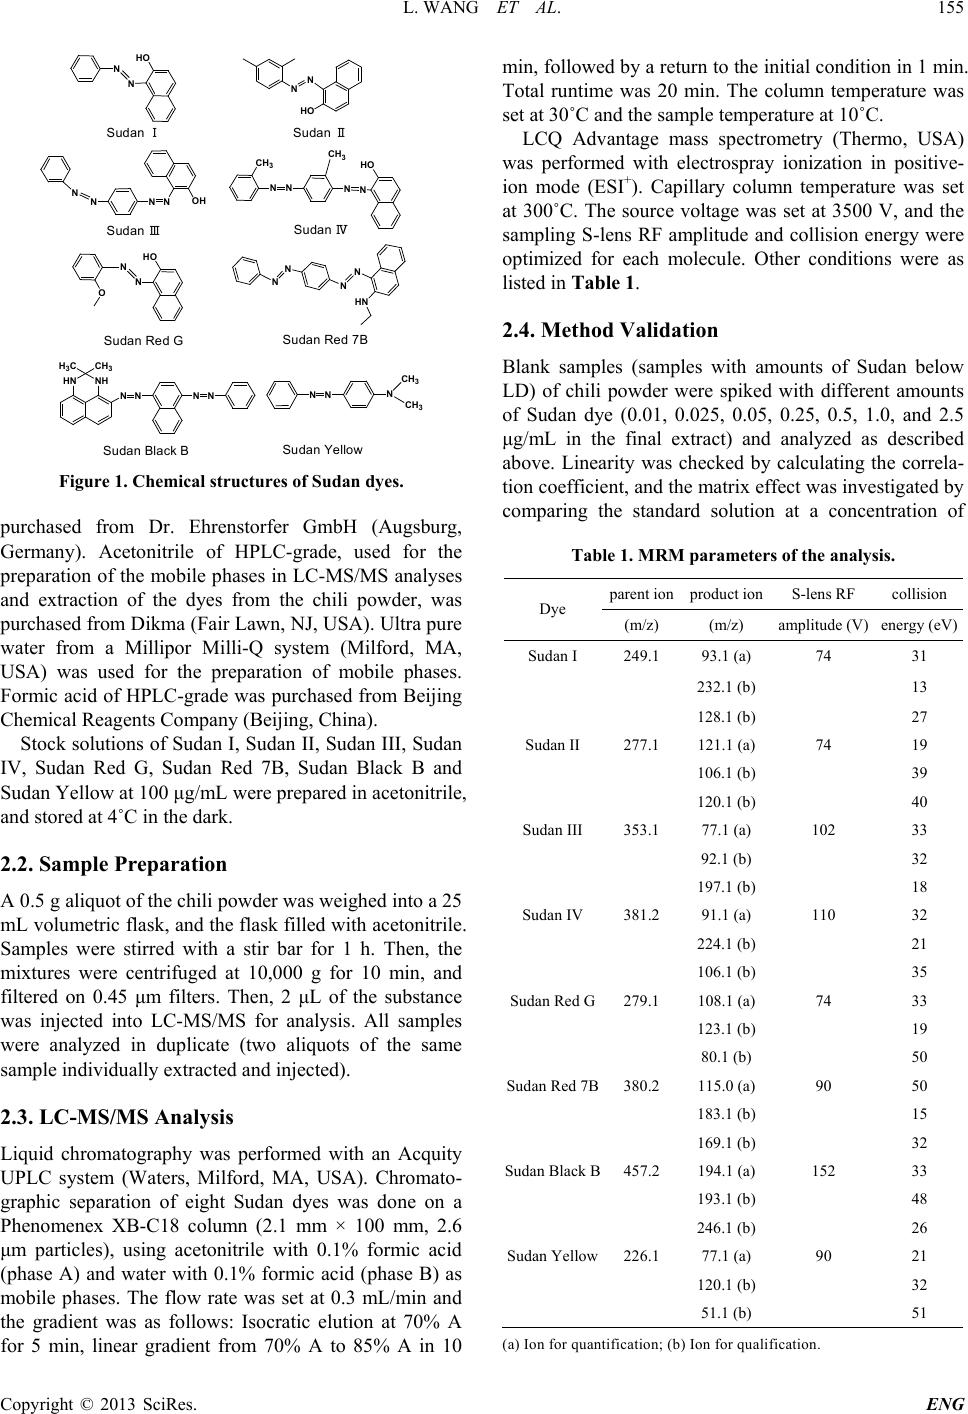 L. WANG ET AL. Copyright © 2013 SciRes. ENG 155 N N HO NN HO NNNNOH NN CH 3 NN HO CH 3 N ON HO NN N N HN HN NH CH 3 H 3 C NNNNN NN CH 3 CH 3 Sudan ⅠSudan Ⅱ Sudan ⅢSudan Ⅳ Sudan Red GSudan Red 7B Sudan Black BSudan Yellow Figure 1. Che m i cal structur es of Sudan dyes. purchased from Dr. Ehrenstorfer GmbH (Augsburg, Germany). Acetonitrile of HPLC-grade, used for the preparation of the mobile phases in LC-MS/MS analyses and extraction of the dyes from the chili powder, was purchased from Dikma (Fair Lawn, NJ, USA). Ultra pure water from a Millipor Milli-Q system (Milford, MA, USA) was used for the preparation of mobile phases. Formic acid of HPLC-grade was purchased from Beijing Chemical Reagents Company (Beijing , China). Stock solutions of Sudan I, Sudan II, Sudan III, Sudan IV, Sudan Red G, Sudan Red 7B, Sudan Black B and Sudan Yellow at 100 μg/m L were prepared in acetonitrile, and stored at 4˚C in the dark. 2.2. Sample Preparation A 0.5 g aliquo t of th e chili pow der wa s weigh ed in to a 25 mL volumetric flask, and the flask filled with aceton itrile. Samples were stirred with a stir bar for 1 h. Then, the mixtures were centrifuged at 10,000 g for 10 min, and filtered on 0.45 μm filters. Then, 2 μL of the substance was injected into LC-MS/MS for analysis. All samples were analyzed in duplicate (two aliquots of the same sample individually extracted and inj e cted). 2.3. LC-MS/MS Analysis Liquid chromatography was performed with an Acquity UPLC system (Waters, Milford, MA, USA). Chromato- graphic separation of eight Sudan dyes was done on a Phenomenex XB-C18 column (2.1 mm × 100 mm, 2.6 μm particles), using acetonitrile with 0.1% formic acid (phase A) and water with 0.1% formic acid (phase B) as mobile phases. The flow rate was set at 0.3 mL/min and the gradient was as follows: Isocratic elution at 70% A for 5 min, linear gradient from 70% A to 85% A in 10 min, followed by a return to the initial condition in 1 min. Total runtime was 20 min. The column temperature was set at 30˚C and the sample temperature at 10˚C. LCQ Advantage mass spectrometry (Thermo, USA) was performed with electrospray ionization in positive- ion mode (ESI+). Capillary column temperature was set at 300˚C. The source voltage was set at 3500 V, and the sampling S-lens RF amplitude and collision energy were optimized for each molecule. Other conditions were as listed in Table 1. 2.4. Method Validation Blank samples (samples with amounts of Sudan below LD) of chili powder were spiked with different amounts of Sudan dye (0.01, 0.025, 0.05, 0.25, 0.5, 1.0, and 2.5 μg/mL in the final extract) and analyzed as described above. Linearity was checked by calculating the correla- tion coefficient, and the matrix effect was investigated by comparing the standard solution at a concentration of Table 1. MRM parameters of the analysis. Dye parent ion product ion S-lens RF collision (m/z ) (m/ z ) amplitude (V) energy (eV) Sudan I 249.1 93.1 (a) 74 31 232.1 (b) 13 128.1 (b) 27 Sudan II 277.1 121.1 (a) 74 19 106.1 (b) 39 120.1 (b) 40 Sudan III 353.1 77.1 (a) 102 33 92.1 (b) 32 197.1 (b) 18 Sudan IV 381.2 91.1 (a) 110 32 224.1 (b) 21 106.1 (b) 35 Sudan Red G 279.1 108.1 (a) 74 33 123.1 (b) 19 80.1 (b) 50 Sudan Red 7B 380.2 115.0 (a) 90 50 183.1 (b) 15 169.1 (b) 32 Sudan Black B 457.2 194.1 (a) 152 33 193.1 (b) 48 246.1 (b) 26 Sudan Yellow 226.1 77.1 (a) 90 21 120.1 (b) 32 51.1 (b) 51 (a) Ion for quantification; (b) Ion fo r qu alification. 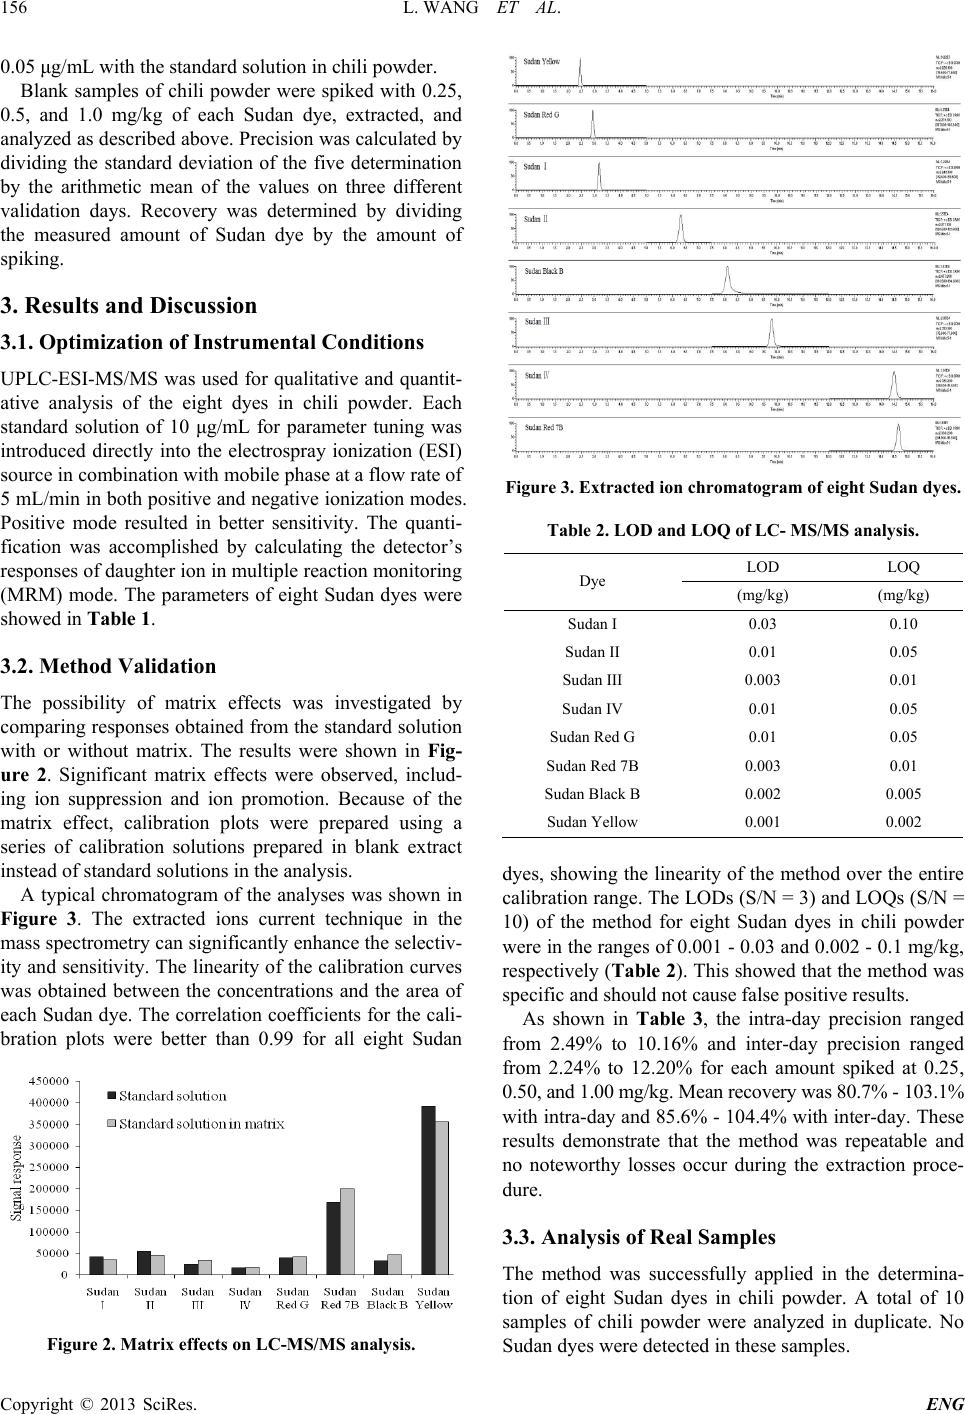 L. WANG ET AL. Copyright © 2013 SciRes. ENG 156 0.05 μg/mL with the standard solution in chili powder. Blank samples of chili powder were spiked with 0.25, 0.5, and 1.0 mg/kg of each Sudan dye, extracted, and analyzed as described above. Precision was calculated by dividing the standard deviation of the five determination by the arithmetic mean of the values on three different validation days. Recovery was determined by dividing the measured amount of Sudan dye by the amount of spiking. 3. Results and Discussion 3.1. Optimization of Instrumental Conditions UPLC-ESI-MS/MS was used for qualitative and quantit- ative analysis of the eight dyes in chili powder. Each standard solution of 10 μg/mL for parameter tuning was introduced directly into the electrospray ionization (ESI) source in combination with mobile phase at a flow rate of 5 mL/min in both positive and negative ionization modes. Positive mode resulted in better sensitivity. The quanti- fication was accomplished by calculating the detector’s responses of daugh ter ion in multiple rea ction monito ring (MRM) mode. The parameters of eight Sudan dyes were showed in Table 1. 3.2. Me thod Validation The possibility of matrix effects was investigated by comparing responses obtained from the standard solution with or without matrix. The results were shown in Fig- ure 2. Significant matrix effects were observed, includ- ing ion suppression and ion promotion. Because of the matrix effect, calibration plots were prepared using a series of calibration solutions prepared in blank extract instead of standard solutions in the analysis. A typical chromatogram of the analyses was shown in Figure 3. The extracted ions current technique in the mass spectrometry can significantly enhance the selectiv- ity and sensitivity. The linearity of the calib ration curves was obtained between the concentrations and the area of each Sudan dye. The correlation coefficients for the cali- bration plots were better than 0.99 for all eight Sudan Figure 2. Matrix effects on LC-MS/MS anal ysis. Figure 3. Extracted ion chromatogram of eight Sudan dyes. Table 2. LOD and LOQ of LC- MS/MS analysis. Dye LOD LOQ (mg/kg) (mg/kg) Sudan I 0.03 0.10 Sudan II 0.01 0.05 Sudan III 0.003 0.01 Sudan IV 0.01 0.05 Sudan Red G 0.01 0.05 Sudan Red 7B 0.003 0.01 Sudan Black B 0.002 0.005 Sudan Yellow 0.001 0.002 dyes, showing the linearity of the method over the entire calibration range. The LODs (S/N = 3) and LOQs (S/N = 10) of the method for eight Sudan dyes in chili powder were in the ranges of 0.001 - 0.03 and 0.002 - 0.1 mg/kg, respectively (Table 2). This showed that the method was specific and should not cause false positive results. As shown in Table 3, the intra-day precision ranged from 2.49% to 10.16% and inter-day precision ranged from 2.24% to 12.20% for each amount spiked at 0.25, 0.50, and 1.00 mg/kg. Mean recovery was 80.7% - 103.1% with intra-day a nd 85.6% - 104.4% with in ter-day. The se results demonstrate that the method was repeatable and no noteworthy losses occur during the extraction proce- dure. 3.3. Analysis of Real Samples The method was successfully applied in the determina- tion of eight Sudan dyes in chili powder. A total of 10 samples of chili powder were analyzed in duplicate. No Sudan dyes were detected in these samples. 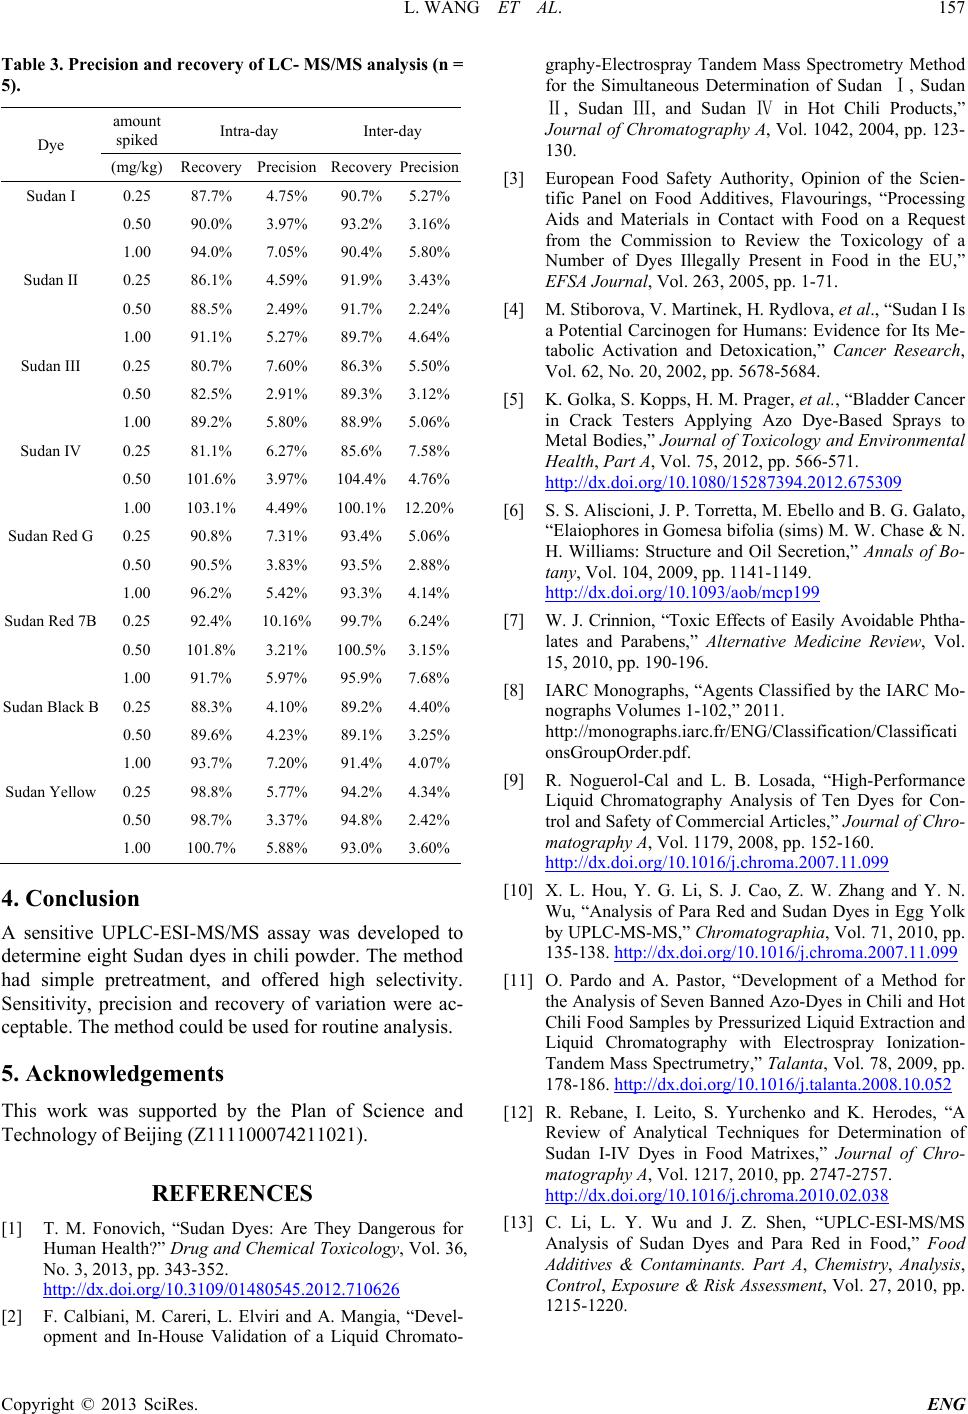 L. WANG ET AL. Copyright © 2013 SciRes. ENG 157 Table 3. Precision and recovery of LC- MS/MS analysis (n = 5). Dye amount spiked Intra-day Inter-day (mg/kg) Recovery Precision Recovery Precision Sudan I 0.25 87.7% 4.75% 90.7% 5.27% 0.50 90.0% 3.97% 93.2% 3.16% 1.00 94.0% 7.05% 90.4% 5.80% Sudan II 0.25 86.1% 4.59% 91.9% 3.43% 0.50 88.5% 2.49% 91.7% 2.24% 1.00 91.1% 5.27% 89.7% 4.64% Sudan III 0.25 80.7% 7.60% 86.3% 5.50% 0.50 82.5% 2.91% 89.3% 3.12% 1.00 89.2% 5.80% 88.9% 5.06% Sudan IV 0.25 81.1% 6.27% 85.6% 7.58% 0.50 101.6% 3.97% 104.4% 4.76% 1.00 103.1% 4.49% 100.1% 12.20% Sudan Red G 0.25 90.8% 7.31% 93.4% 5.06% 0.50 90.5% 3.83% 93.5% 2.88% 1.00 96.2% 5.42% 93.3% 4.14% Sudan Red 7B 0.25 92.4% 10.16% 99.7% 6.24% 0.50 101.8% 3.21% 100.5% 3.15% 1.00 91.7% 5.97% 95.9% 7.68% Sudan Black B 0.25 88.3% 4.10% 89.2% 4.40% 0.50 89.6% 4.23% 89.1% 3.25% 1.00 93.7% 7.20% 91.4% 4.07% Sudan Yellow 0.25 98.8% 5.77% 94.2% 4.34% 0.50 98.7% 3.37% 94.8% 2.42% 1.00 100.7% 5.88% 93.0% 3.60% 4. Conclusion A sensitive UPLC-ESI-MS/MS assay was developed to determine eight Sudan dyes in chili powder. The method had simple pretreatment, and offered high selectivity. Sensitivity, precision and rec ov ery of variation were ac- ceptable. The method could be used for routine analysis. 5. Acknowledgements This work was supported by the Plan of Science and Technology of Beijing (Z111100074211021). REFERENCES [1] T. M. Fonovich, “Sudan Dyes: Are They Dangerous for Human Health?” Drug and Chemical Toxicology, Vol. 36, No. 3, 2013, pp. 343-352. http://dx.doi.org/10.3109/01480545.2012.710626 [2] F. Calbiani, M. Careri, L. Elviri and A. Mangia, “Devel- opment and In-House Validation of a Liquid Chromato- graphy-Electrospray Tandem Mass Spectrometry Method for the Simultaneous Determination of Sudan Ⅰ, Sudan Ⅱ, Sudan Ⅲ, and Sudan Ⅳ in Hot Chili Products,” Journal of Chromatography A, Vol. 1042, 2004, pp. 123- 130. [3] European Food Safety Authority, Opinion of the Scien- tific Panel on Food Additives, Flavourings, “Processing Aids and Materials in Contact with Food on a Request from the Commission to Review the Toxicology of a Number of Dyes Illegally Present in Food in the EU,” EFSA Journal, Vol. 263, 2005, pp. 1-71. [4] M. Stiborova, V. Martinek, H. Rydlova, et al., “Sudan I Is a Potential Carcinogen for Humans: Evide nce for Its Me- tabolic Activation and Detoxication,” Cancer Research, Vol. 62, No. 20, 2002, pp. 5678-5684. [5] K. Golka, S. Kopps, H. M. Prager, et al ., “Bladder Cancer in Crack Testers Applying Azo Dye-Based Sprays to Metal Bodies,” Journal of Toxicology and Environmental Health, Part A, Vol. 75, 2012, pp. 566-571. http://dx.doi.org/10.1080/15287394.2012.675309 [6] S. S. Aliscioni, J. P. Torretta, M. Ebello and B. G. Galato, “Elaiophores in Gomesa bifolia (sims) M. W. Chase & N. H. Williams: Structure and Oil Secretion,” Annals of Bo- tany, Vol. 104, 2009, pp. 1141-1149. http://dx.doi.org/10.1093/aob/mcp199 [7] W. J. Crinnion, “Toxic Effects of Easily Avoidable Phtha- lates and Parabens,” Alternative Medicine Review, Vol. 15, 2010, pp. 190-196. [8] IARC Monographs, “Agents Classified by the IARC Mo- nographs Volumes 1-102,” 2011. http://monographs.iarc.fr/ENG/Classification/Classificati onsGroupOrder.pdf. [9] R. Noguerol-Cal and L. B. Losada, “High-Performance Liquid Chromatography Analysis of Ten Dyes for Con- trol and Safety of Commercial Arti c les,” Journal of Chro- matography A, Vol. 1179, 2008, pp. 152-160. http://dx.doi.org/10.1016/j.chroma.2007.11.099 [10] X. L. Hou, Y. G. Li, S. J. Cao, Z. W. Zhang and Y. N. Wu, “Analysis of Para Red and Sudan Dyes in Egg Yolk by UP L C-MS-MS,” Chromatographia, Vol. 71, 2010, pp. 135-138. http://dx.doi.org/10.1016/j.chroma.2007.11.099 [11] O. Pardo and A. Pastor, “Development of a Method for the Analysis of Seven Banned Azo-Dyes in Chili and Hot Chili Food Samples by Pressurized Liquid Extraction and Liquid Chromatography with Electrospray Ionization- Tandem Mass Spectrumetry,” Talanta, Vol. 78, 2009, pp. 178-186. http://dx.doi.org/10.1016/j.talanta.2008.10.052 [12] R. Rebane, I. Leito, S. Yurchenko and K. Herodes, “A Review of Analytical Techniques for Determination of Sudan I-IV Dyes in Food Matrixes,” Journal of Chro- matography A, Vol. 1217, 2010, pp. 2747-2757. http://dx.doi.org/10.1016/j.chroma.2010.02.038 [13] C. Li, L. Y. Wu and J. Z. Shen, “UPLC-ESI-MS/MS Analysis of Sudan Dyes and Para Red in Food,” Food Additives & Contaminants. Part A, Chemistry, Analysis, Control, Exposure & Risk Assessment, Vol. 27, 2010, pp. 1215-1220. |