

Paper Menu >>
Journal Menu >>
 Engineering, 2013, 5, 132-136 http://dx.doi.org/10.4236/eng.2013.510B027 Published Online October 2013 (http://www.scirp.org/journal/eng) Copyright © 2013 SciRes. ENG Evaluating Pressu re Ul cer D ev el o pm ent in Wheelchair-Bound Population Using Sitting Posture Identification Farve Daneshvar Fard, Sahar Moghimi, Reza Lotfi Depart ment of Ele ctrical Engineering, Biomedical Engineering Research Center, Ferdowsi University of Mashhad, Mashhad, Iran Email: f. [email protected], [email protected], [email protected] Received February 2013 ABSTRACT Pressure ulcers are a common complication among wheelchair-bound population. They are resulted from prolonged exposure to high pressure, which restricts blood flow and leads to tissue necrosis. In this work, a continuous pressure monitoring system is developed for pressure ulcer prevention. The system consists of 64 pressure sensors on a 40 × 50 cm2 sheet. Real time pressure data and corresponding maps are displayed on a computer simultaneously. Furthermore, a posture detection procedure is proposed for sitting posture identification. Having information about the patient’s postur- al history, caregivers are capable of a better decision about repo s itio ning and treating the patient. Keywords: Interface Pressure Monitoring; Pressure Ulcer; Sitting Posture 1. Introduction Sitting-acquired pressure ulcers are a common complica- tion among wheelchair-bound population. It is reported in literature that 36% to 50% of pressure sores are attri- buted to sitting in a wheelchair [1]. Pressure ulcers are resulted from prolonged exposure to high pressure, which restricts blood flow and prevents blood from bringing oxygen and nutrients to underlying tissues. Hence, continuous measuring and monitoring of interface pressure is the most useful approach for preventing pres- sure ulcers, which are considered both a health and eco- nomic problem as they cause excessive expenditures by increasing the length of treatment up to several time s [ 2]. In spite of so many attempts for improving ulcer preven- tion techniques, high incidence of pressure ulcers is ob- served and more effective prevention methods are re- quired [3-5]. The relationship between pressure intensity and dura- tion is explored by Reswick and Roger [6]. High pres- sures are tolerable for short times only and will lead to tissue necrosis if they are unrelieved [7]. However, low pressures are damaging if sustained for a lengthy period of time [8]. Meffre, et al. [9] designed a particular type of seat for wheelchair-bound patients using electro-pneu- matic pressure sensors. These kinds of pressure sensors are more expensive than capacitive and resistive sensors and slower in data acquisition. Yip, et al. [10] presented a flexible pressure monitoring system. The prototype consists of 99 capacitive pressure sensors on a 17 × 22 cm2 sheet. Yang, et al. [11] designed and evaluated an air-alternating wheelchair seat. They used resistive pres- sure sensors for measuring interface pressure. Drennan and Southard [12] presented a system consisting of pres- sure sensitive pads. The system produces alarms if the pressure intensity is more than the threshold adjusted by the user. In this paper, we present a system for continuous mon- itoring of interface pressure. Furthermore, a procedure for identifying different postures of sitting is proposed. A wheelchair-bound patient may develop pressure ulcer if he has no sensation in his buttock. Sore development may happen faster if the patient’s trunk is tilted to one side for a long period of time. In this work, we simulated different sitting postures of a wheelchair-bound patient. Having information about the patient’s postural history, let caregivers decide better about repositioning and treating the patient . The remainder of this paper is structured as follows: Section 2 describes the system design, including sensors array setup as well as, circuit and software design. In Section 3, we present the proposed procedure for sitting posture identification. The proposed method is verified by a particular statistical test. Conclusions are given in Section 4. 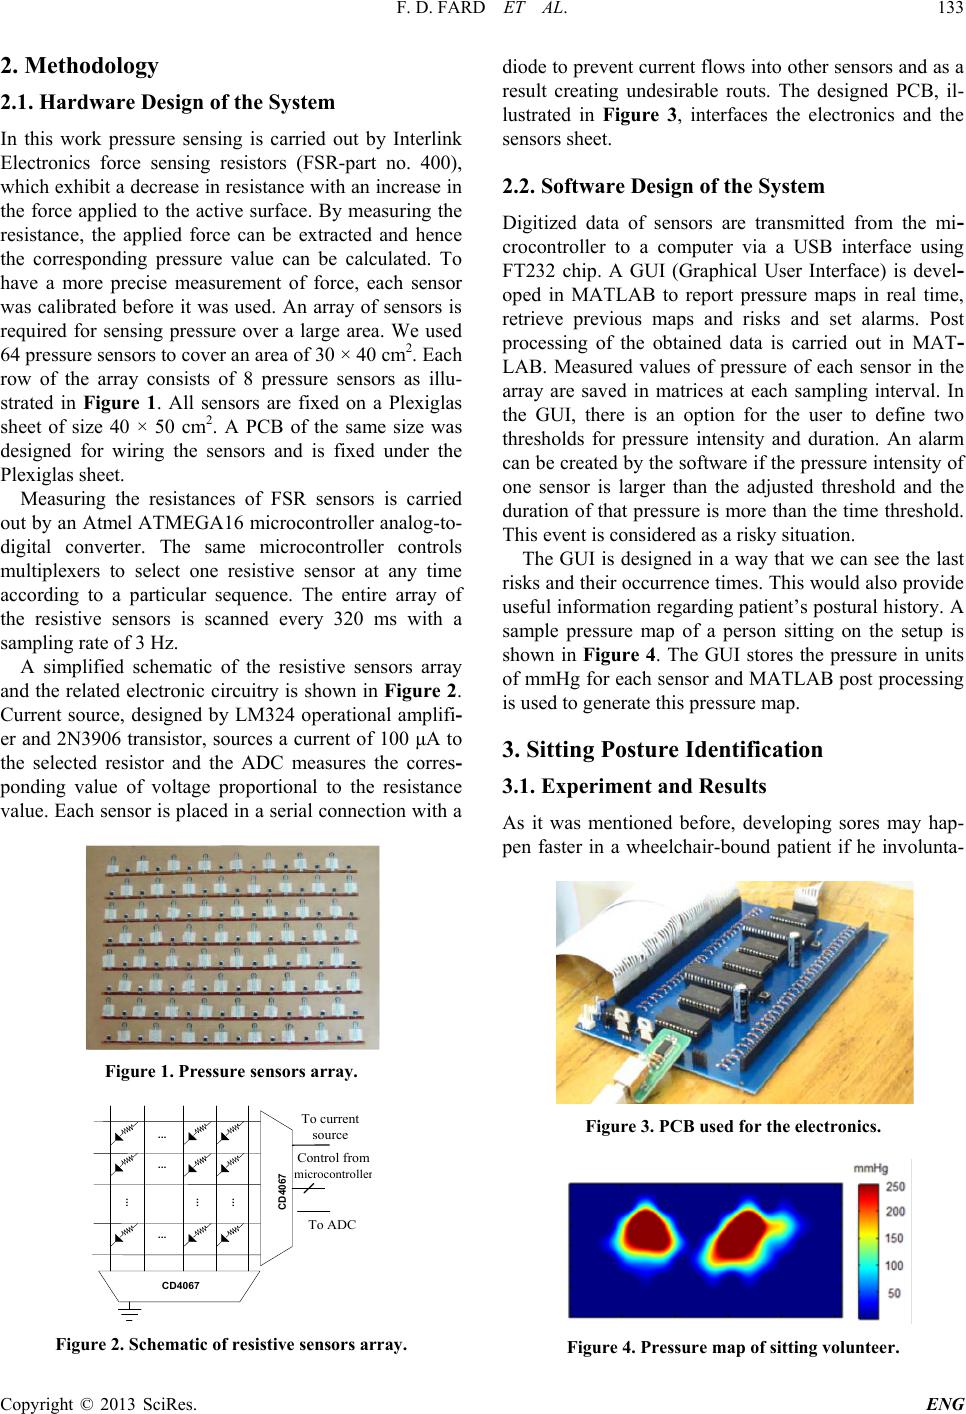 F. D. FARD ET AL. Copyright © 2013 SciRes. ENG 133 2. Methodology 2.1. Hardware Design of the System In this work pressure sensing is carried out by Interlink Electronics force sensing resistors (FSR-part no. 400), which exhibit a decrease in resistance with an increase in the force applied to the active surface. By measuring the resistance, the applied force can be extracted and hence the corresponding pressure value can be calculated. To have a more precise measurement of force, each sensor was calibrated before it was used. An array of sensors is required for sensing pressure over a large area. We used 64 pressure sensors to cover an area of 30 × 40 cm2. Each row of the array consists of 8 pressure sensors as illu- strated in Figure 1. All sensors are fixed on a Plexiglas sheet of size 40 × 50 cm2. A PCB of the same size was designed for wiring the sensors and is fixed under the Plexiglas sheet. Measuring the resistances of FSR sensors is carried out by an Atmel ATMEGA16 microcontroller analog-to- digital converter. The same microcontroller controls multiplexers to select one resistive sensor at any time according to a particular sequence. The entire array of the resistive sensors is scanned every 320 ms with a sampling rate of 3 Hz. A simplified schematic of the resistive sensors array and the related electronic circuitry is shown in Figure 2. Current source, designed by LM324 operational amplifi- er and 2N3906 transistor, sources a current of 100 μA to the selected resistor and the ADC measures the corres- ponding value of voltage proportional to the resistance value. Each sensor is placed in a serial connection with a Figure 1. Pressure sensors array. CD4067 ... ... ... ... To ADC Control from microcontroller CD4067 To current source ... ... Figure 2. Schematic of resistive sensors array. diode to prevent current flows into other sensors and as a result creating undesirable routs. The designed PCB, il- lustrated in Figure 3, interfaces the electronics and the sensors sheet. 2.2. Software Design of the System Digitized data of sensors are transmitted from the mi- crocontroller to a computer via a USB interface using FT232 chip. A GUI (Graphical User Interface) is devel- oped in MATLAB to report pressure maps in real time, retrieve previous maps and risks and set alarms. Post processing of the obtained data is carried out in MAT- LAB. Measured values of pressure of each sensor in the array are saved in matrices at each sampling interval. In the GUI, there is an option for the user to define two thresholds for pressure intensity and duration. An alarm can be created by the software if the pressure intensity of one sensor is larger than the adjusted threshold and the duration of that pressure is more than the time threshold. This event is considered as a risky situation. The GUI is designed in a way that we can see the last risks and their occurrence times. This would also provide useful information regard ing patient’s postural history. A sample pressure map of a person sitting on the setup is shown in Figure 4. The GUI stores the pressure in units of mmHg for each sensor and MAT LAB post processing is used to generate this pressure map. 3. Sitting Posture Identification 3.1. Experiment and Results As it was mentioned before, developing sores may hap- pen faster in a wheelchair-bound patient if he involunta- Figure 3. PCB u sed for the electronics. Figure 4. Pressure map of sitting volunteer. 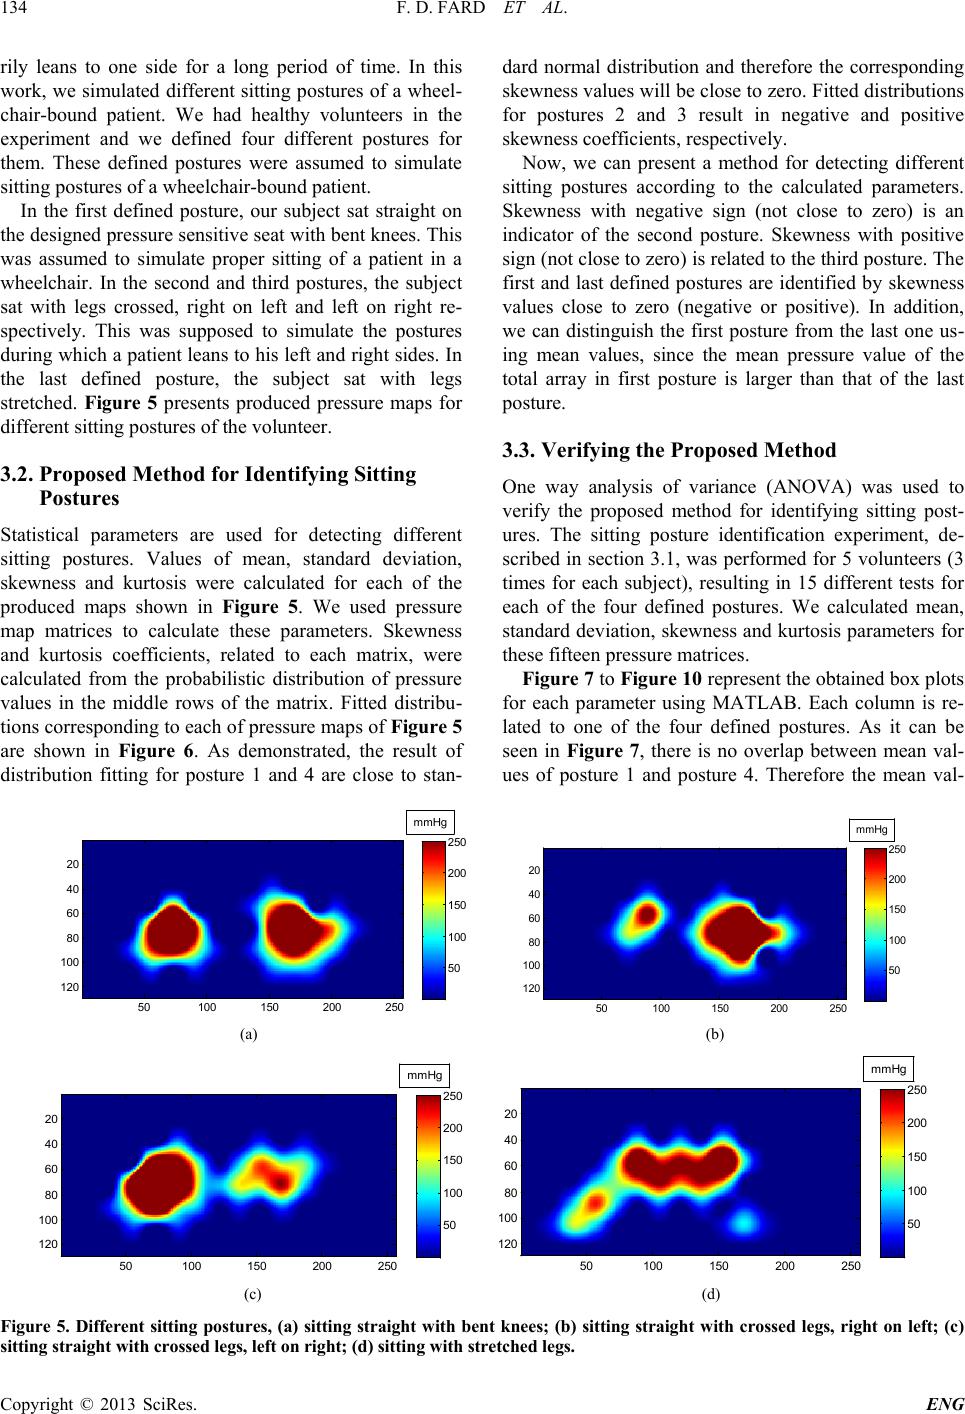 F. D. FARD ET AL. Copyright © 2013 SciRes. ENG 134 rily leans to one side for a long period of time. In this work, we simulated different sitting postures of a wheel- chair-bound patient. We had healthy volunteers in the experiment and we defined four different postures for them. These defined postures were assumed to simulate sitting postures of a wheelchair-bound patient. In the first defined posture, our subject sat straight on the designed pressure sensitive seat with bent knees. This was assumed to simulate proper sitting of a patient in a wheelchair. In the second and third postures, the subject sat with legs crossed, right on left and left on right re- spectively. This was supposed to simulate the postures during which a patient leans to his left and right sides. In the last defined posture, the subject sat with legs stretched. Figure 5 presents produced pressure maps for different sitt i ng pos tures of the volunt e er. 3.2. Proposed Method for Identifying Sitting Postures Statistical parameters are used for detecting different sitting postures. Values of mean, standard deviation, skewness and kurtosis were calculated for each of the produced maps shown in Figure 5. We used pressure map matrices to calculate these parameters. Skewness and kurtosis coefficients, related to each matrix, were calculated from the probabilistic distribution of pressure values in the middle rows of the matrix. Fitted distribu- tions corresponding to each of pressure maps of Figu r e 5 are shown in Figure 6. As demonstrated, the result of distribution fitting for posture 1 and 4 are close to stan- dard normal distribution and therefore the corresponding skewness values will be close to zero. Fitted distributions for postures 2 and 3 result in negative and positive skewness coefficients, respectively. Now, we can present a method for detecting different sitting postures according to the calculated parameters. Skewness with negative sign (not close to zero) is an indicator of the second posture. Skewness with positive sign (not close to zero) is related to the third posture. The first and last defined postures are identified by skewness values close to zero (negative or positive). In addition, we can distinguish the first posture from the last one us- ing mean values, since the mean pressure value of the total array in first posture is larger than that of the last posture. 3.3. Verifying the Proposed Method One way analysis of variance (ANOVA) was used to verify the proposed method for identifying sitting post- ures. The sitting posture identification experiment, de- scribed in section 3.1, was performed for 5 volunteers (3 times for each subject), resulting in 15 different tests for each of the four defined postures. We calculated mean, standard deviation, skewness and kurtosis parameters for these fifteen pressure matrices. Figure 7 to Figure 10 represent the obtained box plots for each parameter using MATLAB. Each column is re- lated to one of the four defined postures. As it can be seen in Figure 7, there is no overlap between mean val- ues of posture 1 and posture 4. Therefore the mean val- (a) (b) (c) (d) Figure 5. Different sitting postures, (a) sitting straight with bent knees; (b) sitting straight with crossed legs, right on left; (c) sitting straight with crossed legs, left on right; (d) sitting with stretch ed l eg s . 50 100 150 200 250 20 40 60 80 100 120 50 100 150 200 250 mmHg 50 100 150 200 250 20 40 60 80 100 120 50 100 150 200 250 mmHg 50 100 150 200 250 20 40 60 80 100 120 50 100 150 200 250 mmHg 50 100 150 200 250 20 40 60 80 100 120 50 100 150 200 250 mmHg 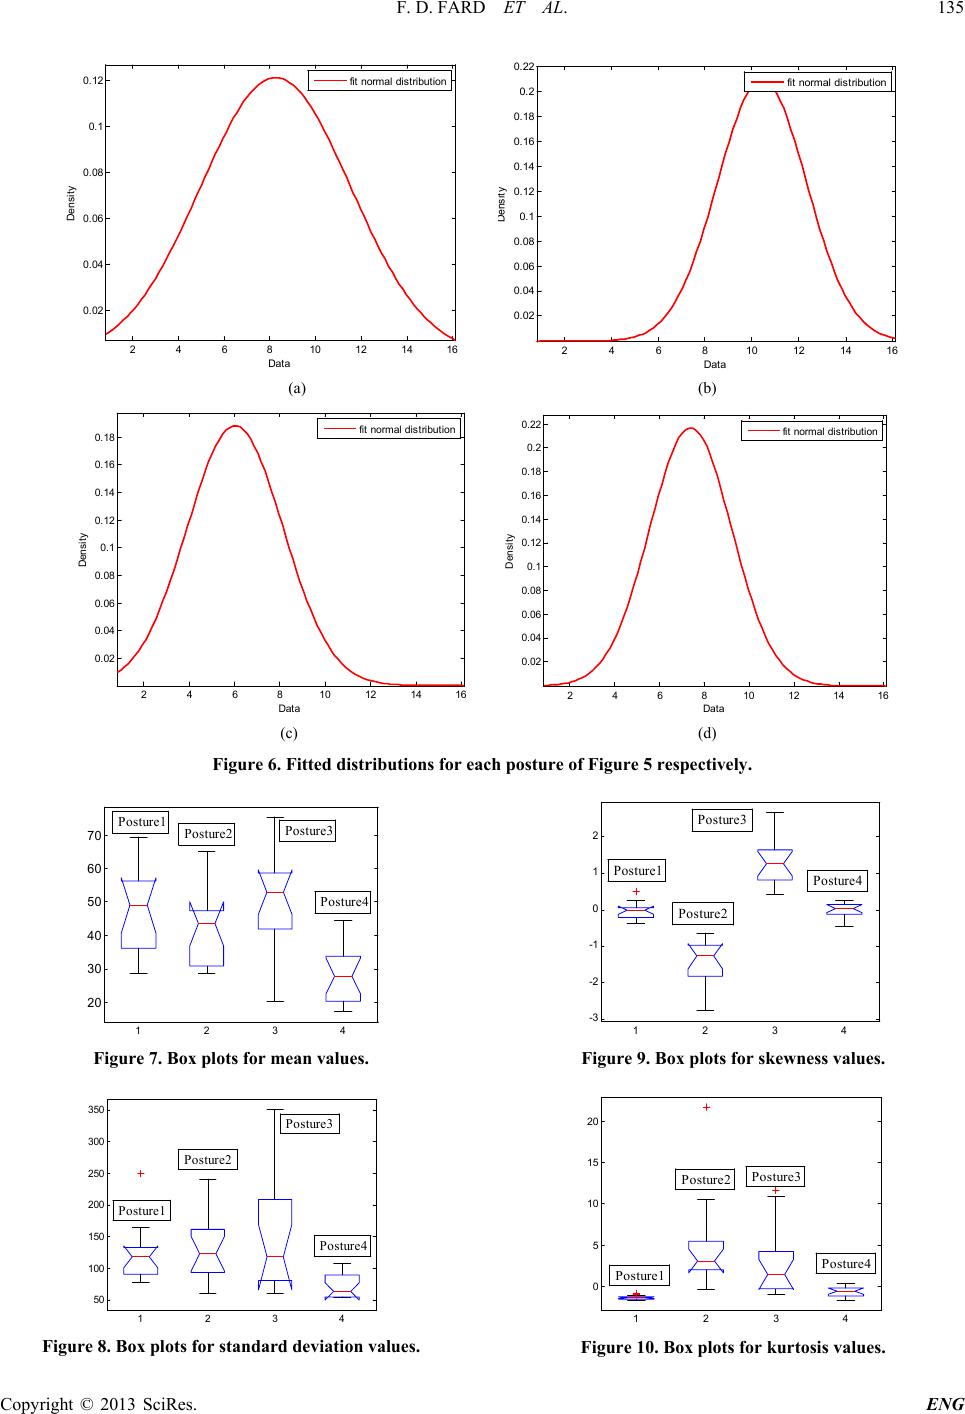 F. D. FARD ET AL. Copyright © 2013 SciRes. ENG 135 (a) (b) (c) (d) Figure 6. Fitted distributions for each posture of Figure 5 respectively. Figure 7. Box plots for mean values. Figure 8. Box plots for standard deviation values. Figure 9. Box plots for skewness values. Figure 10. Box plots for kurtosis values. 246810 12 14 16 0. 02 0. 04 0. 06 0. 08 0. 1 0. 12 Dat a Density fit norm al di stri but i on 2 4 6810 1214 16 0. 02 0. 04 0. 06 0. 08 0. 1 0. 12 0. 14 0. 16 0. 18 0. 2 0. 22 Dat a Density fit norm al di stri but i on 2 46810 1214 16 0.02 0.04 0.06 0.08 0.1 0.12 0.14 0.16 0.18 Dat a Density fit norm al di stri but i on 246810 12 14 16 0.02 0.04 0.06 0.08 0.1 0.12 0.14 0.16 0.18 0.2 0.22 Dat a Density fit norm al di stri but i on 20 30 40 50 60 70 1 2 34 Posture1 Posture2 Pos tur e3 P os tur e4 50 100 150 200 250 300 350 12 3 4 P os ture 2 P os ture 3 P os ture 4 P os ture 1 -3 -2 -1 0 1 2 1 2 34 P os tur e1 P os tur e2 P os tur e3 P os tur e4 0 5 10 15 20 1 2 34 P os ture 1 Posture2 P os tur e3 P os ture 4  F. D. FARD ET AL. Copyright © 2013 SciRes. ENG 136 ues can be used for distinguishing these two postures. Figu r e 8 shows that the values of standard deviation vary from posture 1 to posture 4. According to Figure 9 skewness values of posture 2 have negative signs, and skewness values of posture 3 have positive signs while those of postures 1 and 4 are close to zero (negative or positive). So these three groups (posture 2, posture 3, posture 1 and 4) can be distinguished by the skewness coefficient. Finally, Figure 10 shows that kurtosis coef- ficients of posture 2 and 3 are generally larger than those of postures 1 and 4. This sounds reasonable, since fitted normal distributions of postures 1 and 4 are similar to standard normal distribution, while those of postures 2 and 3 generally have higher peaks. 4. Conclusions A continuous-time pressure monitoring system is pre- sented. Due to its useful information about patient’s movement history, feasibility for simultaneous monitor- ing of pressure and alarming options, it is proposed that this system can be utilized for pressure ulcer prevention. Sitting posture identification is possible using the pre- sented system. A method for detecting different sitting postures has been proposed and verified. It is suggested that preventing pressure ulcers in wheelchair-bound pa- tients can be performed using the sitting posture detec- tion method. Spatial resolution of the designed system can be im- proved in future works by increasing the number of pressure sensors. The presented pressure monitoring sys- tem can be expanded to be used in mattresses of bedrid- den patients. REFERENCES [1] M. J. Geyer, D. M. Brienza, P. Karg, E. Trefler and S. Kelsey, “A Randomized Control Trial to Evaluate Pres- sure-Reducing Seat Cushions for Elderly Wheelchair Us- ers,” Advances in Skin and Wound Care, Vol. 14, 2001, pp. 120-129. http://dx.doi.org/10.1097/00129334-200105000-00008 [2] T. S. Dharmarajan and J. T. Ugalino, “Pressure Ulcers: Clinical Features and Management,” Journal of American Medical Association, Vol. 296, 2006, pp. 974-984. [3] M. Ferrarin, G. Andreoni and A Pedotti, “Comparative Biomechanical Evaluation of Different Wheelchair Seat Cushions,” Journal of Rehabilitation Research and De- velopment, Vol. 37, 2000, pp. 315-324. [4] D. M. Brienza, K. C. Chung, C. E. Brubaker, J. Wang, T. E. Karg and C. T. Lin, “A System for the Analysis of Seat Support Surfaces Using Surface Shape Control and Si- multaneous Measurement of Applied Pressure,” IEEE Transactions on Rehabilitation Engineering, Vol. 4, 1996, pp. 103-113. http://dx.doi.org/10.1109/86.506407 [5] T. Defloor and M. H. Grypdonck, “Do Pressure Relief Cushions Really Relieve Pressure?” Western Journal of Nursing Research, Vol. 22, 2000, pp. 335-350. http://dx.doi.org/10.1177/01939450022044458 [6] J. B. Reswick and J. E. Roger, “Experience at Rancho Los Amigos Hospital with Devices and Techniques to Prevent Pressure Sores,” In: Bedsore Biomechanics, Uni- versity Park Press, Baltimore, 1976, pp. 301-310. [7] I. Swain, “The Measurement of Interface Pressure,” In: D. Bader, C. Bouten, D. Colin and C. Oomens, Eds., Pres- sure Ulcer Research: Current and Future Perspectives, Springer-Verlog, Berlin, 2005, p. 52. [8] European Pressure Ulcer Advisory Panel (EPUAP) and National Pressure Ulcer Advisory Panel (NPUAP) “Pres- sure Ulcer Prevention, Quick Reference Guide,” 2009. http://www.npuap.org [9] R. Meffre, C. Gehin and A. Dittmar, “MAPI: Active In- terface Pressure Sensor Integrated into a Seat,” Proceed- ing of the 29th Annual International Conference of the IEEE EMBS, 2007, pp. 1358-1361. [10] M. Yip, D. Da He, E. winokur, A. G. Balderrama, R. She- ridan and H. Ma, “A Flexible Pressure Monitoring Sys- tem for Pressure Ulcer Prevention,” 31st Annual Interna- tional Conference of the IEEE EMBS, 2009, pp. 1212- 1215. [11] Y. Yang, J. Wang, Z. Gao and Y. Zhou, “Design and Preliminary Evaluation of an Air-Alternating Wheelchair Seating System for Pressure Ulcer Prevention,” Interna- tional Conference on Bioinformatics and Biomedical Technology, 2010, pp. 239-243. [12] D. B. Drennan and D. W. Southard, “System and Method of Reducing Risk and/or Severity of Pressure Ulcers,” US Patent US2010/0268122 A1, 2010. |