

Paper Menu >>
Journal Menu >>
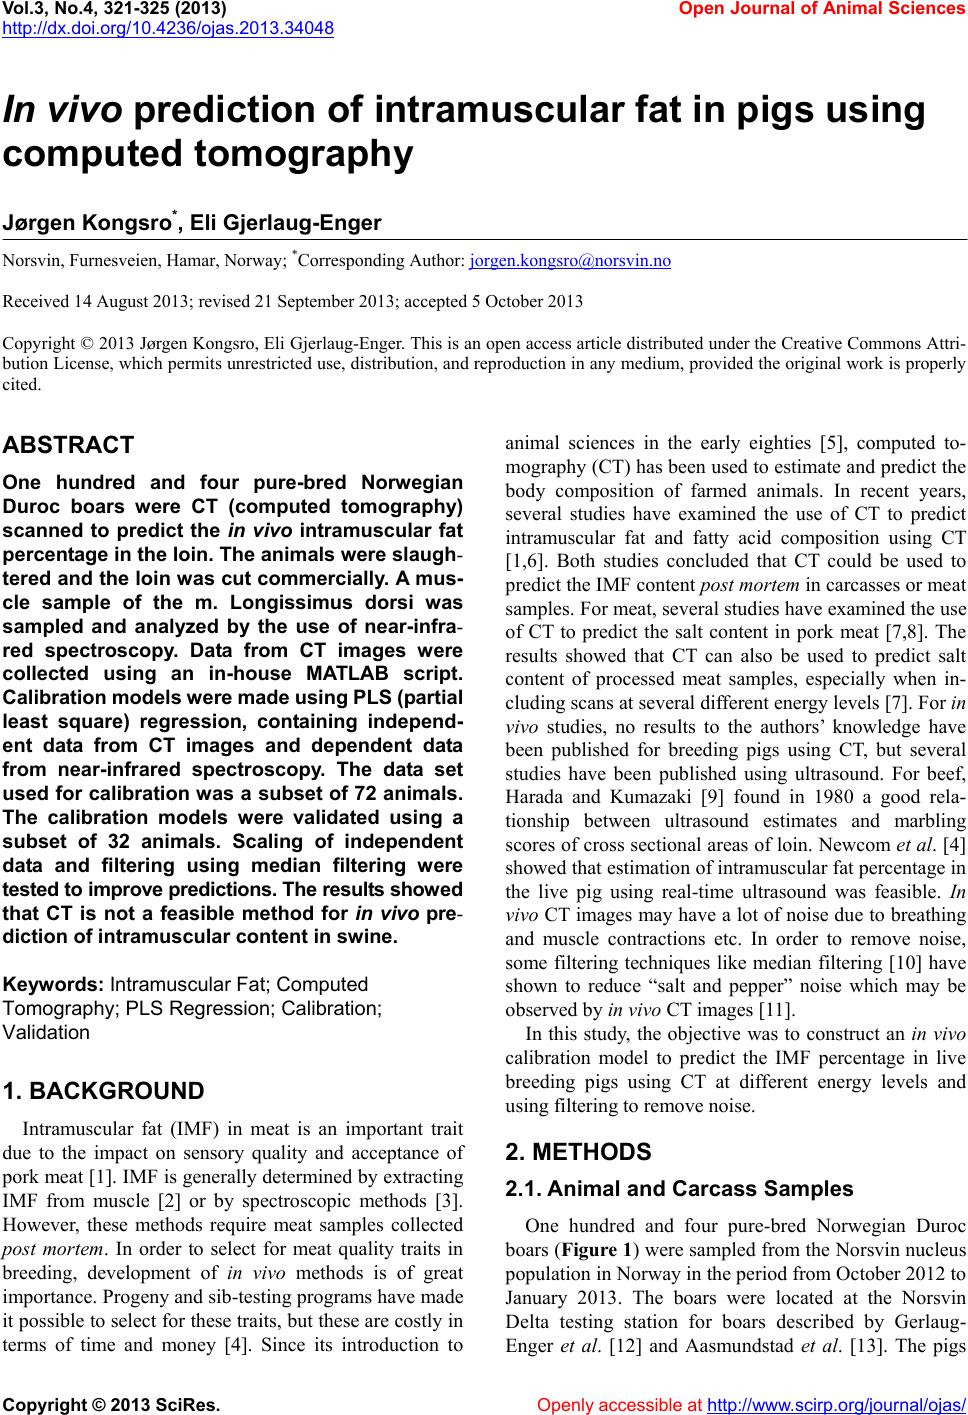 Vol.3, No.4, 321-325 (2013) Open Journal of Animal Sciences http://dx.doi.org/10.4236/ojas.2013.34048 In vivo prediction of intramuscular fat in pigs using computed tomography Jørgen Kongsro*, Eli Gjerlaug-Enger Norsvin, Furnesveien, Hamar, Norway; *Corresponding Author: [email protected] Received 14 August 2013; revised 21 September 2013; accepted 5 October 2013 Copyright © 2013 Jørgen Kongsro, Eli Gjerlaug-Enger. This is an open access article distributed under the Creative Commons Attri- bution License, which permits unrestricted use, distribution, and reproduction in any medium, provided the original work is properly cited. ABSTRACT One hundred and four pure-bred Norwegian Duroc boars were CT (computed tomography) scanned to predict the in vivo intramuscular fat percentage in the loin. The animals were slaugh- tered and the loin was cut commercially. A mus- cle sample of the m. Longissimus dorsi was sampled and analyzed by the use of near-infra- red spectroscopy. Data from CT images were collected using an in-house MATLAB script. Calibration models were made using PLS (p artial least square) regression, containing independ- ent data from CT images and dependent data from near-infrared spectroscopy. The data set used for calibration was a subset of 72 animals. The calibration models were validated using a subset of 32 animals. Scaling of independent data and filtering using median filtering were tested to improve predictions. The results showed that CT is not a feasible method for in vivo pre- diction of intramuscular content in swine. Keywords: Intramuscular Fat; Computed Tomography; PLS Regression; Calibration; Validation 1. BACKGROUND Intramuscular fat (IMF) in meat is an important trait due to the impact on sensory quality and acceptance of pork meat [1]. IMF is generally determined by extracting IMF from muscle [2] or by spectroscopic methods [3]. However, these methods require meat samples collected post mortem. In order to select for meat quality traits in breeding, development of in vivo methods is of great importance. Progeny and sib-testing programs have made it possible to select for these traits, but these are costly in terms of time and money [4]. Since its introduction to animal sciences in the early eighties [5], computed to- mography (CT) has been used to estimate and predict the body composition of farmed animals. In recent years, several studies have examined the use of CT to predict intramuscular fat and fatty acid composition using CT [1,6]. Both studies concluded that CT could be used to predict the IMF content post mortem in carcasses or meat samples. For meat, several studies have examined the use of CT to predict the salt content in pork meat [7,8]. The results showed that CT can also be used to predict salt content of processed meat samples, especially when in- cluding scans at several different energy levels [7]. For in vivo studies, no results to the authors’ knowledge have been published for breeding pigs using CT, but several studies have been published using ultrasound. For beef, Harada and Kumazaki [9] found in 1980 a good rela- tionship between ultrasound estimates and marbling scores of cross sectional areas of loin. Newcom et al. [4] showed that estimation of in tramuscular fat percen tage in the live pig using real-time ultrasound was feasible. In vivo CT images may have a lot of noise due to b reathing and muscle contractions etc. In order to remove noise, some filtering techniques like median filtering [10] have shown to reduce “salt and pepper” noise which may be observed by in vivo CT images [11]. In this study, the objective was to construct an in vivo calibration model to predict the IMF percentage in live breeding pigs using CT at different energy levels and using filtering to remove noise. 2. METHODS 2.1. Animal and Carcass Samples One hundred and four pure-bred Norwegian Duroc boars (Figure 1) were sampled from the Norsvin nucleus population in Norway in the period from October 2012 to January 2013. The boars were located at the Norsvin Delta testing station for boars described by Gerlaug- Enger et al. [12] and Aasmundstad et al. [13]. The pigs Copyright © 2013 SciRes. Openly accessible at http://www. scirp.org/journal/o jas/ 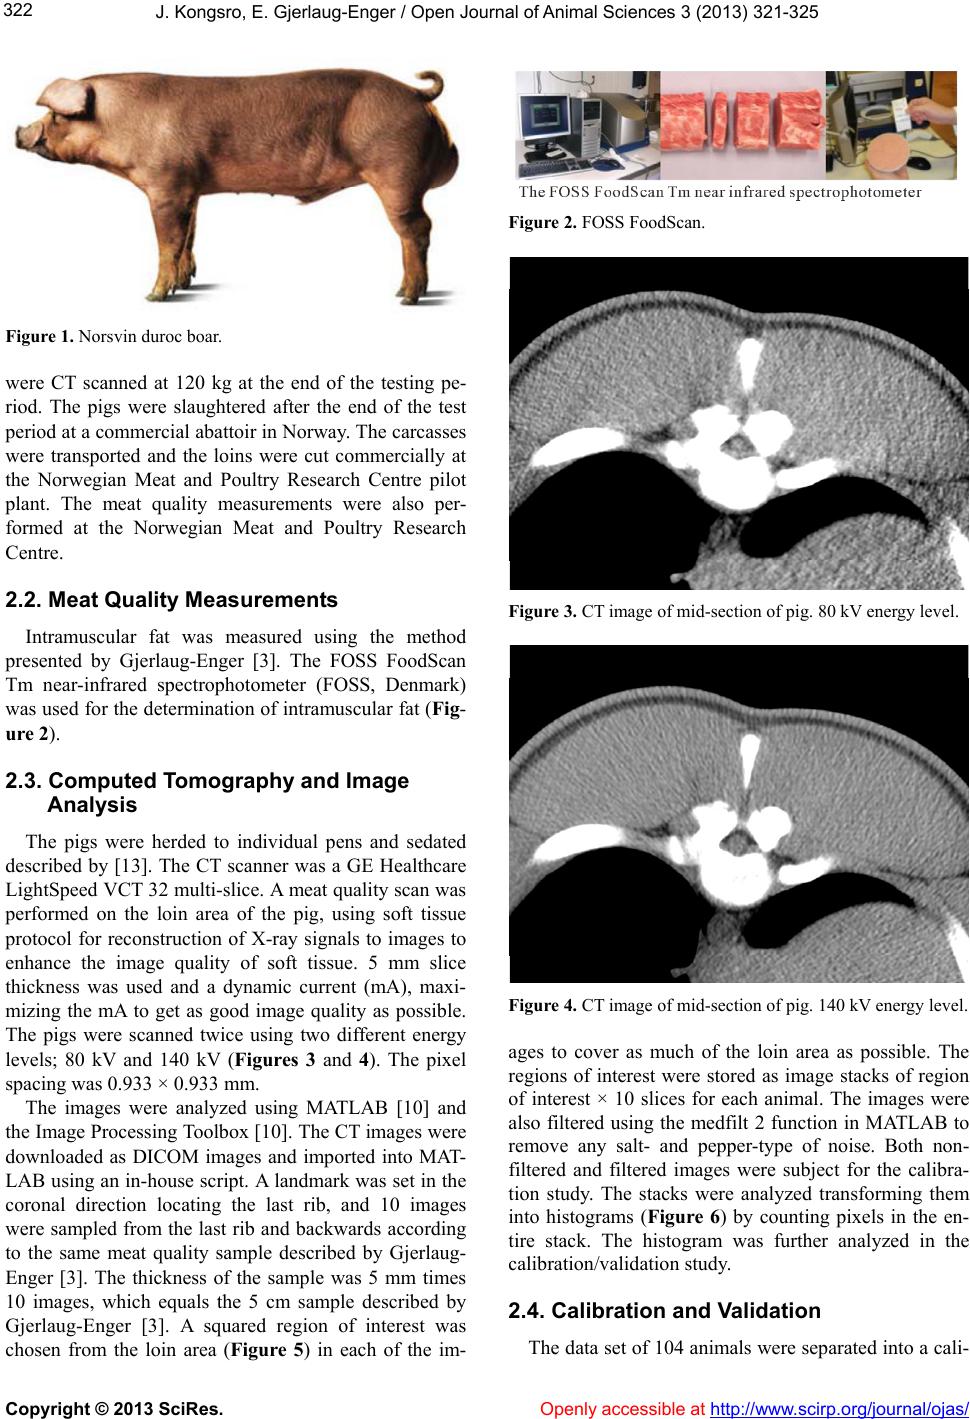 J. Kongsro, E. Gjerlaug-Enger / Open Journal of Animal Sciences 3 (2013) 321-325 322 Figure 1. Norsvin duroc boar. were CT scanned at 120 kg at the end of the testing pe- riod. The pigs were slaughtered after the end of the test period at a commercial abattoir in Norway. The carcasses were transported and the loins were cut commercially at the Norwegian Meat and Poultry Research Centre pilot plant. The meat quality measurements were also per- formed at the Norwegian Meat and Poultry Research Centre. 2.2. Meat Quality Measurements Intramuscular fat was measured using the method presented by Gjerlaug-Enger [3]. The FOSS FoodScan Tm near-infrared spectrophotometer (FOSS, Denmark) was used for the determination of intramuscular fat (Fig- ure 2). 2.3. Computed Tomography and Image Analysis The pigs were herded to individual pens and sedated described by [13]. The CT scanner was a GE Healthcare LightSpeed VCT 32 multi-slice. A meat quality scan was performed on the loin area of the pig, using soft tissue protocol for reconstruction of X-ray signals to images to enhance the image quality of soft tissue. 5 mm slice thickness was used and a dynamic current (mA), maxi- mizing the mA to get as good image quality as possible. The pigs were scanned twice using two different energy levels; 80 kV and 140 kV (Figures 3 and 4). The pixel spacing was 0.933 × 0.933 mm. The images were analyzed using MATLAB [10] and the Image Processing Toolbox [10]. The CT images were downloaded as DICOM images and imported into MAT- LAB using an in-house script. A landmark was set in the coronal direction locating the last rib, and 10 images were sampled from the last rib and backwards according to the same meat quality sample described by Gjerlaug- Enger [3]. The thickness of the sample was 5 mm times 10 images, which equals the 5 cm sample described by Gjerlaug-Enger [3]. A squared region of interest was chosen from the loin area (Figure 5) in each of the im- Figure 2. FOSS FoodScan. Figure 3. CT image of mid-section of pig. 80 kV energy level. Figure 4. CT image of mid-section of pig. 140 kV energy level. ages to cover as much of the loin area as possible. The regions of interest were stored as image stacks of region of interest × 10 slices for each animal. The images were also filtered using the medfilt 2 function in MATLAB to remove any salt- and pepper-type of noise. Both non- filtered and filtered images were subject for the calibra- tion study. The stacks were analyzed transforming them into histograms (Figure 6) by counting pixels in the en- tire stack. The histogram was further analyzed in the calibration/validation study. 2.4. Calibration and Validation The data set of 104 animals were separated into a cali- Copyright © 2013 SciRes. Openly accessible at http://www. scirp.org/journal/o jas/ 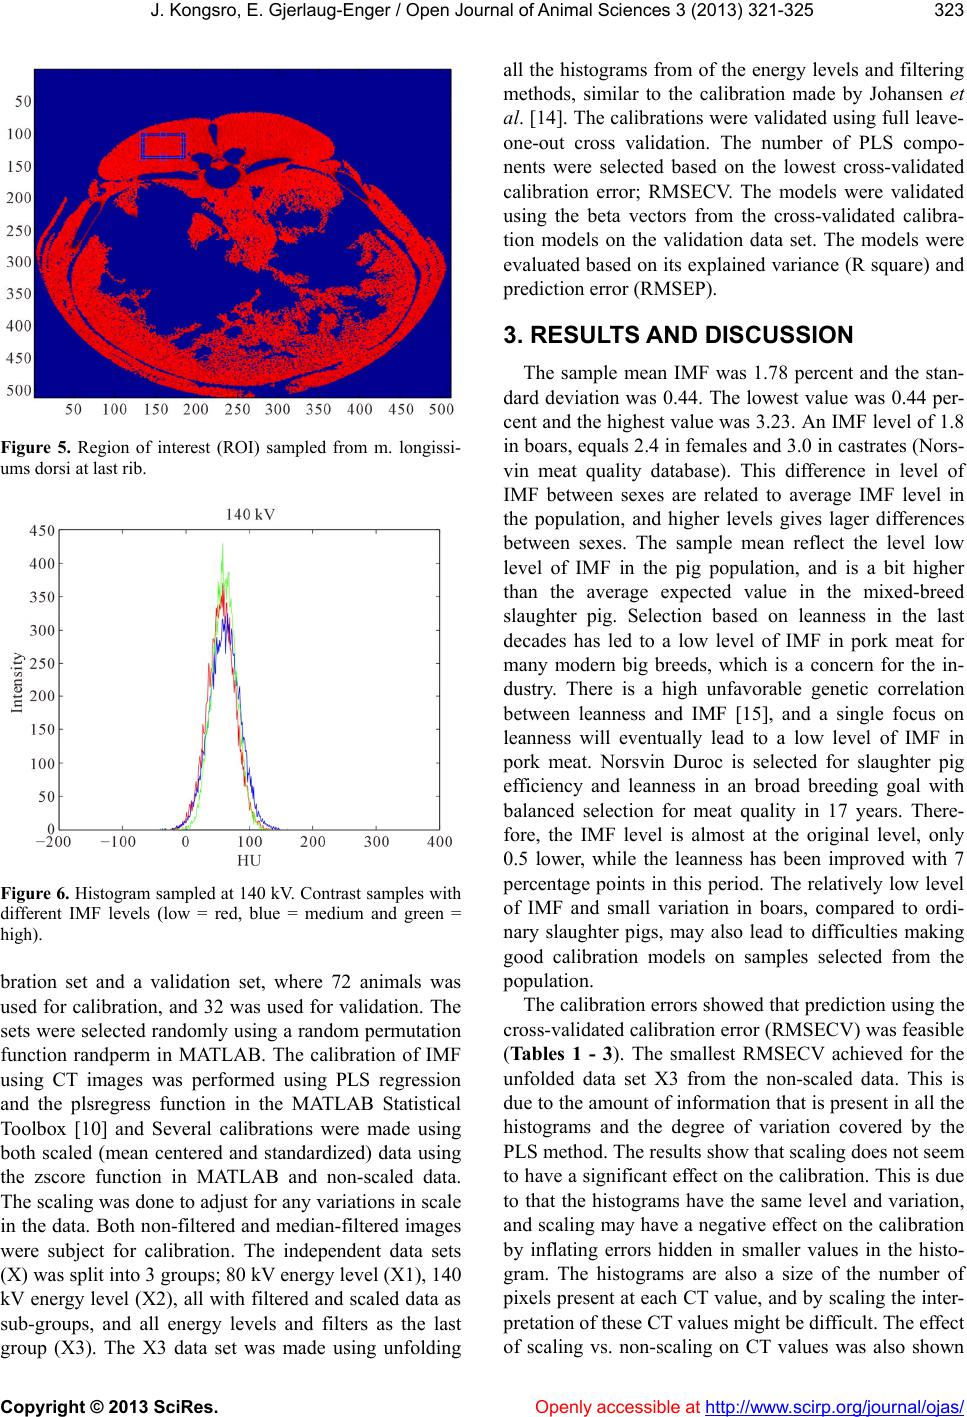 J. Kongsro, E. Gjerlaug-Enger / Open Journal of Animal Sciences 3 (2013) 321-325 323 Figure 5. Region of interest (ROI) sampled from m. longissi- ums dorsi at last rib. Figure 6. Histogram sampled at 140 kV. Contrast samples with different IMF levels (low = red, blue = medium and green = high). bration set and a validation set, where 72 animals was used for calibration, and 32 was used for validation. The sets were selected randomly using a random permutation function randperm in MATLAB. The calibration of IMF using CT images was performed using PLS regression and the plsregress function in the MATLAB Statistical Toolbox [10] and Several calibrations were made using both scaled (mean centered and standardized) data using the zscore function in MATLAB and non-scaled data. The scaling was done to adjust for any variations in scale in the data. Both non-filtered and median-filtered images were subject for calibration. The independent data sets (X) was split into 3 groups ; 80 kV energy level (X1), 140 kV energy level (X2), all with filtered and scaled d ata as sub-groups, and all energy levels and filters as the last group (X3). The X3 data set was made using unfolding all the histograms from of the energy levels and filtering methods, similar to the calibration made by Johansen et al. [14]. The calibrations were validated using fu ll leave- one-out cross validation. The number of PLS compo- nents were selected based on the lowest cross-validated calibration error; RMSECV. The models were validated using the beta vectors from the cross-validated calibra- tion models on the validation data set. The models were evaluated based on its explained variance (R square) and prediction error (RMSEP). 3. RESULTS AND DISCUSSION The sample mean IMF was 1.78 percent and the stan- dard deviation was 0.44. The lowest value was 0.44 per- cent and the highest value was 3.23. An IMF level of 1.8 in boars, equals 2.4 in females and 3.0 in castrates (Nors- vin meat quality database). This difference in level of IMF between sexes are related to average IMF level in the population, and higher levels gives lager differences between sexes. The sample mean reflect the level low level of IMF in the pig population, and is a bit higher than the average expected value in the mixed-breed slaughter pig. Selection based on leanness in the last decades has led to a low level of IMF in pork meat for many modern big breeds, which is a concern for the in- dustry. There is a high unfavorable genetic correlation between leanness and IMF [15], and a single focus on leanness will eventually lead to a low level of IMF in pork meat. Norsvin Duroc is selected for slaughter pig efficiency and leanness in an broad breeding goal with balanced selection for meat quality in 17 years. There- fore, the IMF level is almost at the original level, only 0.5 lower, while the leanness has been improved with 7 percentage points in this period. The relatively low level of IMF and small variation in boars, compared to ordi- nary slaughter pigs, may also lead to difficulties making good calibration models on samples selected from the population. The calibration errors showed that pred iction using the cross-validated calibration error (RMSECV) was feasible (Ta bl es 1 - 3 ). The smallest RMSECV achieved for the unfolded data set X3 from the non-scaled data. This is due to the amount of information that is present in all the histograms and the degree of variation covered by the PLS method. The results show that scaling does not seem to have a significant effect on the calibration. This is due to that the histograms have the same level and variation, and scaling may have a negative effect on the calibration by inflating errors hidden in smaller values in the histo- gram. The histograms are also a size of the number of pixels present at each CT value, and by scaling the inter- pretation of these CT values might be diff icult. The effect of scaling vs. non-scaling on CT values was also shown Copyright © 2013 SciRes. Openly accessible at http://www. scirp.org/journal/o jas/ 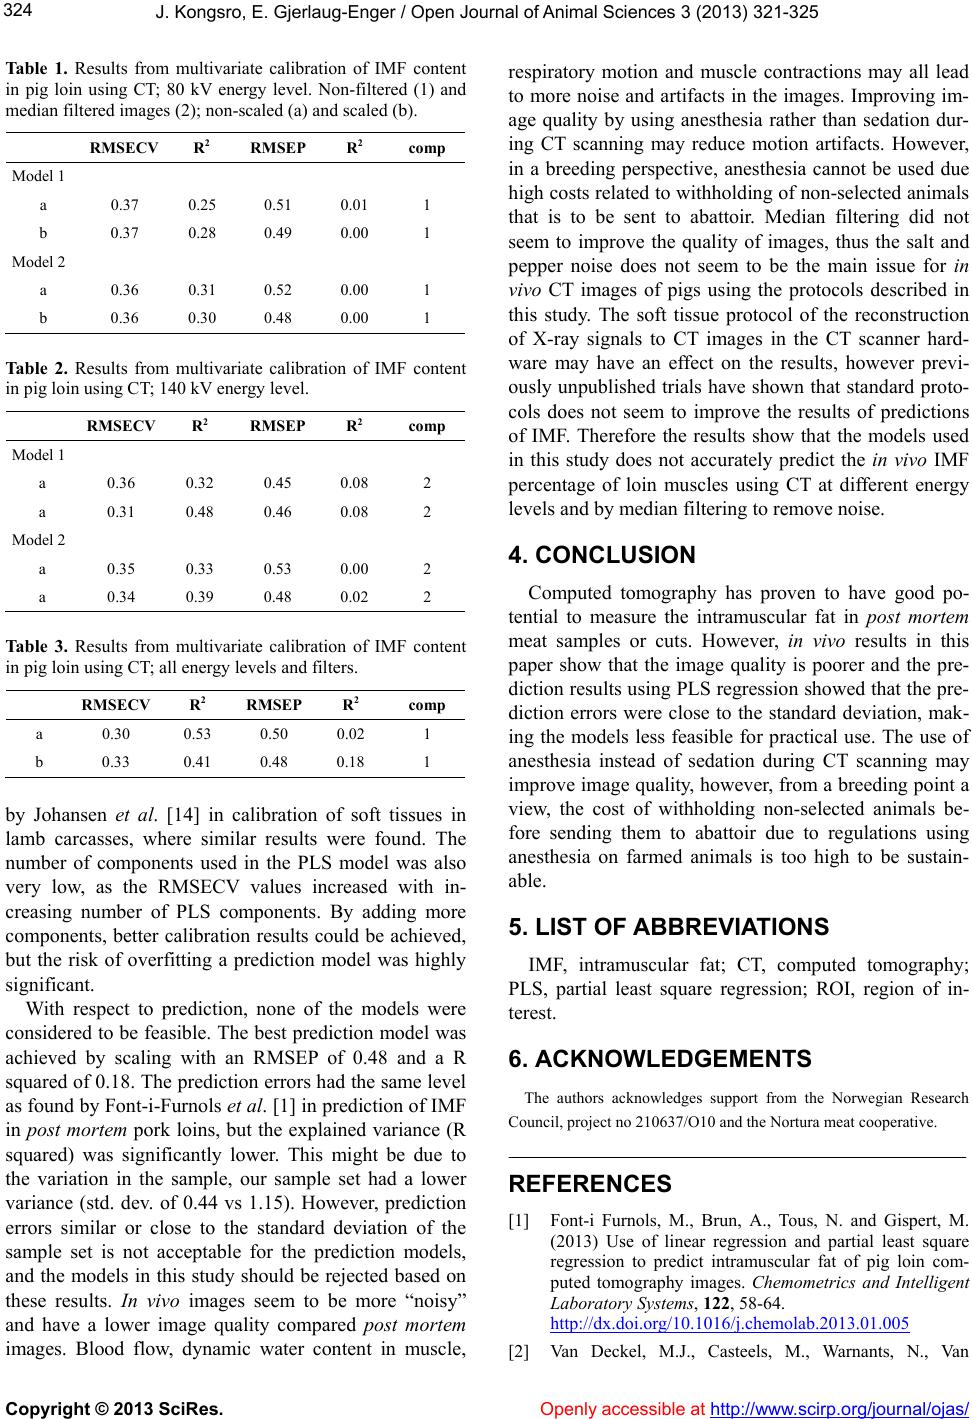 J. Kongsro, E. Gjerlaug-Enger / Open Journal of Animal Sciences 3 (2013) 321-325 324 Tab le 1. Results from multivariate calibration of IMF content in pig loin using CT; 80 kV energy level. Non-filtered (1) and median filtered images (2); non-scaled (a) and scaled (b). RMSECV R2 RMSEP R2 comp Model 1 a 0.37 0.25 0.51 0.01 1 b 0.37 0.28 0.49 0.00 1 Model 2 a 0.36 0.31 0.52 0.00 1 b 0.36 0.30 0.48 0.00 1 Table 2. Results from multivariate calibration of IMF content in pig loin using CT; 140 kV energy level. RMSECV R2 RMSEP R2 comp Model 1 a 0.36 0.32 0.45 0.08 2 a 0.31 0.48 0.46 0.08 2 Model 2 a 0.35 0.33 0.53 0.00 2 a 0.34 0.39 0.48 0.02 2 Table 3. Results from multivariate calibration of IMF content in pig loin using CT; all energy levels and filters. RMSECV R2 RMSEP R2 comp a 0.30 0.53 0.50 0.02 1 b 0.33 0.41 0.48 0.18 1 by Johansen et al. [14] in calibration of soft tissues in lamb carcasses, where similar results were found. The number of components used in the PLS model was also very low, as the RMSECV values increased with in- creasing number of PLS components. By adding more components, better calibration results could be achieved, but the risk of overfitting a prediction model was highly significant. With respect to prediction, none of the models were considered to be feasible. The best prediction model was achieved by scaling with an RMSEP of 0.48 and a R squared of 0.18. The prediction errors had the same level as found by Font-i-Furno ls et al. [1] in prediction of IMF in post mortem pork loins, but the explained variance (R squared) was significantly lower. This might be due to the variation in the sample, our sample set had a lower variance (std. dev. of 0.44 vs 1.15). However, prediction errors similar or close to the standard deviation of the sample set is not acceptable for the prediction models, and the models in this study should be rejected based on these results. In vivo images seem to be more “noisy” and have a lower image quality compared post mortem images. Blood flow, dynamic water content in muscle, respiratory motion and muscle contractions may all lead to more noise and artifacts in the images. Improving im- age quality by using anesthesia rather than sedation dur- ing CT scanning may reduce motion artifacts. However, in a breeding perspective, anesthesia cannot be used due high costs related to withhold ing of non-selected animals that is to be sent to abattoir. Median filtering did not seem to improve the quality of images, thus the salt and pepper noise does not seem to be the main issue for in vivo CT images of pigs using the protocols described in this study. The soft tissue protocol of the reconstruction of X-ray signals to CT images in the CT scanner hard- ware may have an effect on the results, however previ- ously unpublished trials have shown that standard proto- cols does not seem to improve the results of predictions of IMF. Therefore the results show that the models used in this study does not accurately predict the in vivo IMF percentage of loin muscles using CT at different energy levels and by median filtering to remove noise. 4. CONCLUSION Computed tomography has proven to have good po- tential to measure the intramuscular fat in post mortem meat samples or cuts. However, in vivo results in this paper show that the image quality is poorer and the pre- diction results using PLS regression show ed that the pre- diction errors were close to the standard deviation, mak- ing the models less feasible for practical use. The use of anesthesia instead of sedation during CT scanning may improve image quality, however, from a breeding point a view, the cost of withholding non-selected animals be- fore sending them to abattoir due to regulations using anesthesia on farmed animals is too high to be sustain- able. 5. LIST OF ABBRE VIATIONS IMF, intramuscular fat; CT, computed tomography; PLS, partial least square regression; ROI, region of in- terest. 6. ACKNOWLEDGEMENTS The authors acknowledges support from the Norwegian Research Council, project n o 210637/O10 and the Nortura meat cooperative. REFERENCES [1] Font-i Furnols, M., Brun, A., Tous, N. and Gispert, M. (2013) Use of linear regression and partial least square regression to predict intramuscular fat of pig loin com- puted tomography images. Chemometrics and Intelligent Laboratory Systems, 122, 58-64. http://dx.doi.org/10.1016/j.chemolab.2013.01.005 [2] Van Deckel, M.J., Casteels, M., Warnants, N., Van Copyright © 2013 SciRes. Openly accessible at http://www. scirp.org/journal/o jas/  J. Kongsro, E. Gjerlaug-Enger / Open Journal of Animal Sciences 3 (2013) 321-325 Copyright © 2013 SciRes. http://www.scirp.o rg/journal/ojas/Openly accessible at 325 Damme, L. and Boucqué, C.V. (1996) Omega-3 fatty ac- ids in pig nutrition: Implications for the intrinsic and sensory quality of the meat. Meat science, 44, 55-63. http://dx.doi.org/10.1016/S0309-1740(96)00077-0 [3] Gjerlaug-Enger, E., Aass, L., Odegård, J. and Vangen, O. (2010) Genetic parameters of meat quality traits in two pig breeds measured by rapid methods. Animal: An in- ternational journal of animal bioscience, 4, 1832-1843. [4] Newcom, D.W., Baas, T.J. and Lampe, J.F. (2002) Predic- tion of intramuscular fat percentage in live swine using real-time ultrasound. Journal of Animal Science, 80, 3046-3052. [5] Skjervold, H., Gronseth, K., Vangen, O. and Evensen, A. (1981) In vivo estimation of body composition by com- puterized tomography. Zeitschrift für Tierzüchtung und Züchtungsbiologie, 98, 77-79. [6] Prieto, N., Navaj as, E., Richardson, R., Ross, D., Hy slop, J., Simm, G., Roehe, R., Glasbey, C. and Fisher, A. (2010) Predicting beef cuts composition, fatty acids and meat quality characteristics by spiral computed tomography. Meat Scie nce, 86, 770-779. http://dx.doi.org/10.1016/j.meatsci.2010.06.020 [7] Håseth, T.T., Høy, M., Kongsro, J., Kohler, A., Sørheim, O. and Egelandsdal, B. (2008) Determination of sodium chloride in pork meat by computed tomography at differ- ent voltages. Journal of food science, 73, E333-E339. http://dx.doi.org/10.1111/j.1750-3841.2008.00883.x [8] Vestergaard, C., Risum, J.R. and Adler-Nissen, J. (2004) Quantification of salt concentrations in cured pork by computed tomography. Meat Science, 68, 107-11 3. http://dx.doi.org/10.1016/j.meatsci.2004.02.011 [9] Harada, H. and Kumazaki, K. (1980) Relationship be- tween fat thickness, cross sectional area of M. Longis- simusthoracis and marbling score and their ultrasonic es- timates. Nihon Chikusan Gakkaiho, 51, 261-266. [10] MATLAB (2012) The MathWorks, Inc., Natick. [11] Ning, C.-Y., Liu, S.-F. and Qu, M. (2009) Research on removing noise in medical image based on median filter method. IEEE International Symposium on IT in Medi- cine & Education, Jinan, 14-16 August 2009, 384-388 [12] Gjerlaug-Enger, E., Kongsro, J., Odegård, J., Aass, L. and Vangen, O. (2012) Genetic parameters between slaughter pig efficiency and growth rate of different body tissues estimated by computed tomography in live boars of Land- race and Duroc. Animal, 6, 9-18. http://dx.doi.org/10.1017/S1751731111001455 [13] Aasmundstad, T., Kongsro, J., Wetten, M., Dolvik, N.I. and Vangen, O. (2013) Osteochondrosis in pigs diagnosed with computed tomography: Heritabilities and genetic correlations to weight gain in specific age intervals. Ani- mal: An International Journal of Animal Bioscience, 1-7. [14] Johansen, J., Egelandsdal, B., Røe, M., Kvaal, K. and Aastveit, A. (2007) Calibration models for lamb carcass composition analysis using Computerized Tomography (CT) imaging. Chemometrics and Intelligent Laboratory Systems, 87, 303-311. http://dx.doi.org/10.1016/j.chemolab.2007.03.009 [15] Knapp, P., Willam, A. and Sölkner, J. (1997) Genetic parameters for lean meat content and meat quality traits in different pig breeds. Livestock Production Science, 52, 69-73. |