

Paper Menu >>
Journal Menu >>
 International Journal of Medical Physics, Clinical Engineering and Radiation Oncology, 2013, 2, 133-138 Published Online November 2013 (http://www.scirp.org/journal/ijmpcero) http://dx.doi.org/10.4236/ijmpcero.2013.24018 Open Access IJMPCERO Dosimetric Study of Coplanar and Non-Coplanar Intensity-Modulated Radiation Therapy Planning for Esophageal Carcinoma* Ying Li, Bing Liu, Fushan Zhai#, Yongfeng Yang, Ming Liu, Chaoen Bao, Qingxiang Zhou Department of Radiation Oncology, Third Hospital of Hebei Medical University, Shijiazhuang, China Email: #[email protected] Received April 25, 2013; revised May 15, 2013; accepted June 5, 2013 Copyright © 2013 Ying Li et al. This is an open access article distributed under the Creative Commons Attribution License, which permits unrestricted use, distribution, and reproduction in any medium, provided the original work is properly cited. ABSTRACT Purpose: To compare the dosimetric impact of coplanar intensity modulated radiation therapy (IMRT) and non-copla- nar IMRT for the esophageal carcinoma. Methods: There are forty-five esophageal carcinoma patients, fifteen of whom were cervical and upper thoracic (Group 1) and thirty were middle and lower thoracic (Group 2). Gross tumor volume (GTV), clinical target volume (CTV), and organs at risk (OAR) were contoured by the chief physician in the CMS-XiO treatment planning system. For each patient, one coplanar plan and two non-coplanar plans have been created using the same physical objective function. A detailed dose-volume histogram (DVH) comparison among three plans was then carried out in a tabulated format. Results: 1) In Group 1 patients with PTV volume less than 100cc, the mean dose and dose gradient of non-coplanar plan were much better than those in coplanar plan. 2) In Group 2 patients, the conformity index (CI) for coplanar and two non-coplanar plans were 0.69 ± 0.13, 0.41 ± 0.13, and 0.68 ± 0.15, respectively. The V5, V10, V20, and the mean dose to the lung were lower in the non-coplanar plans compared to ones in coplanar plan. However, the non-coplanar plans resulted in an increase in a dose to the heart, but the dose was still within heart toxicity tolerance. Conclusion: For Group 1 patients, the non-coplanar IMRT plan had less dose gradient and better mean dose than the coplanar IMRT plan. For Group 2 patients, the non-coplanar IMRT could the decrease dose to the lung tissue, thus lowering the probability of radiation pneumonia to esophageal cancer patients. The drawback of non-coplanar IMRT is that, even within toxicity tolerance, it could deliver a higher dose to the heart and spinal cord compared to the coplanar plan. Therefore, for patients with cardiology and neurology concern, non-coplanar IMRT should be used with caution. Keywords: Esophageal Carcinoma; Coplanar IMRT; Non-Coplanar IMRT 1. Introduction Radiotherapy is the primary treatment modality for the inoperable or unresectable esophageal carcinoma. The goal of radiotherapy for esophageal cancer is to kill the cancer cell inside the target volume while sparing the normal tissues. In the recent years, intensity-modulated radiation therapy (IMRT) has been broadly used in treat- ing esophageal carcinoma [1]. IMRT has been proven to be superior to Three Dimensional Conformal Radiother- apy (3DCRT) with respect to dose conformity in Plan- ning Treatment Volume (PTV) and the normal tissue preservation [2,3]. However, depending on the volume and location of the esophageal cancer tumor, the normal lung tissue may be exposed to high doses of radiation. Several studies have shown that the incidence and sever- ity of radiation pneumonia were related to the irradiation to normal lung tissue in esophageal carcinoma radio- therapy. For instance, Wang et al. [4] found that, among 100 patients, 49% of them have developed various sever- ity pneumonia, in whom 27% have grade 1, 16% have grade 2, 6% have grade 3 pneumonia. From a clinical aspect, decreasing the side effect of radiotherapy is an- other way to improve the survival rate. Since non-coplanar IMRT plan usually takes longer treatment planning time and it requires complex patient setup and treatment, the majority of the esophageal car- cinoma cases are treated by coplanar IMRT, and clini- cians have yet to explore the feasibility of non-coplanar IMRT in treating esophageal cancer. The main purposes *Thanks to Dr. Junfang (Jeff) Gao who is medical physicist at Procure p roton therapy center at Oklahoma city in USA for language assistance! #Corresponding author.  Y. LI ET AL. Open Access IJMPCERO 134 of this study were to optimize the treatment approach for the esophageal cancer and improve the treatment quality by investigating the dosimetric impact of non-coplanar IMRT in our hospital. Additionally, this study aims to establish radiotherapy treatment strategies for future cli- nical trials, especially for esophageal carcinoma. 2. Methods and Materials 2.1. Patient Selection Forty-five patients with esophageal carcinoma were en- rolled in this study. Fifteen of them had cervical and up- per thoracic tumors (Group 1), and the remaining thirty patients had middle and lower thoracic section tumors (Group 2). Median age of patients was 61 years (range, 48 - 72 years), and the median PTV was 114.98cc (range, 30.7cc - 235.12cc). All patients in this study had tumors located away from the distal esophagus and gastro-eso- phageal junction. 2.2. Simulation Both the Groups 1 and 2 patients were simulated in a supine position under the thermoplastic mask immobili- zation of the head, neck and shoulders. Patients were simulated on a computed tomography (CT) scanner (So- motom-sensation Plus-16) using slice thickness of 5-mm from mandible to the costophrenic angle. This extended CT scan volume was used to fully visualize the non-co- planar beams in treatment planning system (TPS). The acquired CT images covered the entire thorax and upper abdomen. The CT images were then transferred to the TPS via a local area network. 2.3. Contouring The gross tumor volume (GTV) was contoured by a ra- diation oncologist. The clinical target volume (CTV) was expanded with a 0.5 cm in radial direction and a 3 to 5 cm superior-inferior direction, which followed our clini- cal guidelines. The PTV was defined as an additional 0.5 cm expansion around the CTV. The organ at risk (OAR) included the spinal cord, lung, and heart. 2.4. Treatment Planning For each patient, one coplanar IMRT plan (referred as Plan A) and two non-coplanar IMRT plans (referred as Plan B and C) were created in the XiO TPS, version 4.40 (ELEKTA, CMS St Louis, USA). Specifically, the co- planar plan (Plan A) was considered as the reference plan with three to five beams arrangement. For Group 1 pa- tients, if the plan A has three beams, we used the beam setup of one posterior-anterior (PA) and two anterior- oblique (AO) beams (gantry angle at 180˚ ± 10˚, 50˚ ± 10˚, and 310˚ ± 10˚). If it is a four-beam Plan A, we used one PA, one anterior-posterior (AP), and two AO (gantry angle at 0˚, 50˚ ± 10˚, 230˚ ± 10˚, and 310˚ ± 10˚). Simi- larly, five-beam Plan A consisted of one AP, two AO, and two PO beams (gantry angle at 0˚, 50˚ ± 10˚, 130˚ ± 10˚, 230˚ ± 10˚, and 310˚ ± 10˚). For Group 2 patients, if it is a three-beam Plan A, one AP and two PO (gantry angle at 0˚, 130˚ ± 10˚, and 230˚ ± 10˚) were used; if it is four-beam Plan A, one PA, one AP, and two AO or one parallel-opposed oblique beams (gan- try angle at 0˚ and/or 180˚, 50˚ ± 10˚ and/or 310˚ ± 10˚, 130˚ ± 10˚ and/or 230˚ ± 10˚) were used; if it is five-beam Plan A, one AP, one PA, two AO, and one PO beams (gan- try angle at 0˚, 50˚ ± 10˚, 130˚ ± 10˚, 180˚ ± 10˚, and 310˚ ± 10˚) were used. The couch angle was always set to 0˚. For each patient case, the non-coplanar Plan B was morphed from the reference Plan A by converting one or two of the coplanar beams in Plan A into the non-copla- nar beam/s. For Plan B, the total beams of 3 to 5 were used, and the gantry angle of the non-coplanar beam was set to 330˚ or 30˚ or 150˚, and couch angle was set to 90˚. The non-coplanar Plan C was using the identical beam parameters as in the Plan B, with addition of two more non-coplanar beams with gantry angles of 330˚ and 30˚, thus, making the total of 5 to 7 beams in Plan C. All the IMRT plans were generated using 6 mega- voltage (MV) X-ray beam. The intermediate dose pre- scribed to the PTV was 60 Gy in 30 fractions. Dose to the OARs, such as the lung, spinal cord, and heart, were minimized to the acceptable tolerances. The treatment planning was done with an objective of meeting the planning criteria: Dose to the 95% (D95%) of the PTV volume receives the prescribed dose (60 Gy); D100% of the PTV is greater than 57 Gy; D5% of PTV is less than 63 Gy. The spinal cord dose was limited to 45 Gy for 0.1cc. For the total lung, the V5, V20, and mean dose were expected to be lower than the 50%, 25%, and 13 Gy, respectively (in absolute percentage of the lung volume at 5 and 20 Gy). For the heart, the planning goals were to keep V40 less than 40% and mean dose less than 30 Gy (in absolute percentage of the heart volume). All the plans were calculated using superposition algorithm with a dose calculation grid size of 0.2 cm. 2.5. Plan Evaluation Each plan was evaluated with respect to the dose distri- bution, dose-volume histograms (DVHs), and additional dosimetric parameters described below. Comparisons of treatment plans were based on doses delivered to the PTV and OARs. The dose distribution of PTV was as- sessed by evaluating the maximum dose, mean dose, and minimum dose. To evaluate the plan quality with respect to the dose delivered to the tumor, the conformity index (CI) and heterogeneity index (HI) were computed. 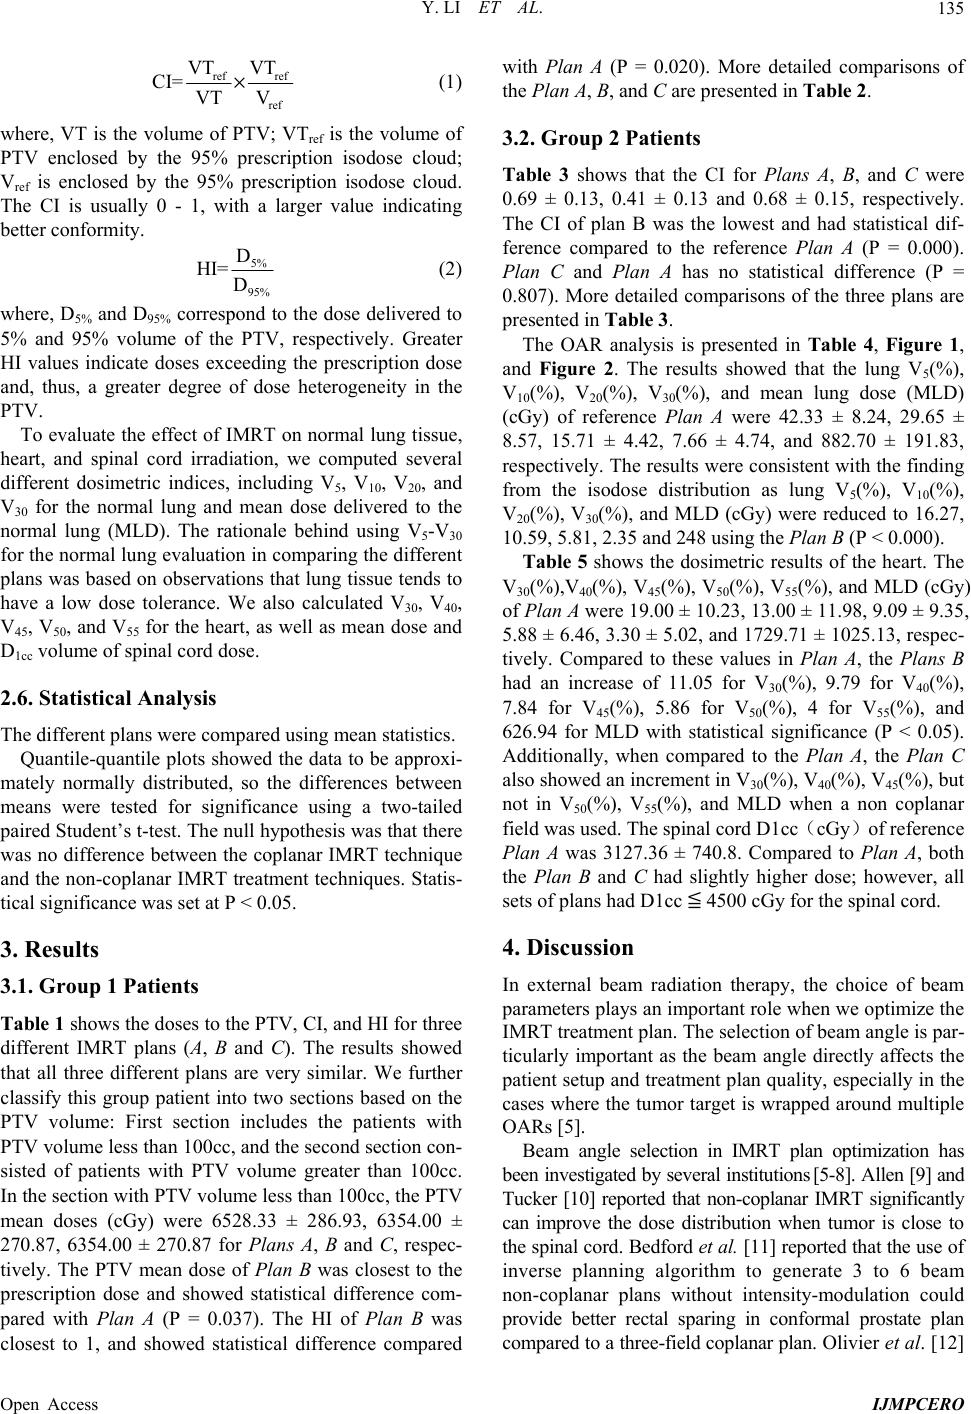 Y. LI ET AL. Open Access IJMPCERO 135 ref ref ref VT VT CI= VT V × (1) where, VT is the volume of PTV; VTref is the volume of PTV enclosed by the 95% prescription isodose cloud; Vref is enclosed by the 95% prescription isodose cloud. The CI is usually 0 - 1, with a larger value indicating better conformity. 5% 95% D HI= D (2) where, D5% and D95% correspond to the dose delivered to 5% and 95% volume of the PTV, respectively. Greater HI values indicate doses exceeding the prescription dose and, thus, a greater degree of dose heterogeneity in the PTV. To evaluate the effect of IMRT on normal lung tissue, heart, and spinal cord irradiation, we computed several different dosimetric indices, including V5, V10, V20, and V30 for the normal lung and mean dose delivered to the normal lung (MLD). The rationale behind using V5-V30 for the normal lung evaluation in comparing the different plans was based on observations that lung tissue tends to have a low dose tolerance. We also calculated V30, V40, V45, V50, and V55 for the heart, as well as mean dose and D1cc volume of spinal cord dose. 2.6. Statistical Analysis The different plans were compared using mean statistics. Quantile-quantile plots showed the data to be approxi- mately normally distributed, so the differences between means were tested for significance using a two-tailed paired Student’s t-test. The null hypothesis was that there was no difference between the coplanar IMRT technique and the non-coplanar IMRT treatment techniques. Statis- tical significance was set at P < 0.05. 3. Results 3.1. Group 1 Patients Table 1 shows the doses to the PTV, CI, and HI for three different IMRT plans (A, B and C). The results showed that all three different plans are very similar. We further classify this group patient into two sections based on the PTV volume: First section includes the patients with PTV volume less than 100cc, and the second section con- sisted of patients with PTV volume greater than 100cc. In the section with PTV volume less than 100cc, the PTV mean doses (cGy) were 6528.33 ± 286.93, 6354.00 ± 270.87, 6354.00 ± 270.87 for Plans A, B and C, respec- tively. The PTV mean dose of Plan B was closest to the prescription dose and showed statistical difference com- pared with Plan A (P = 0.037). The HI of Plan B was closest to 1, and showed statistical difference compared with Plan A (P = 0.020). More detailed comparisons of the Plan A, B, and C are presented in Table 2. 3.2. Group 2 Patients Table 3 shows that the CI for Plans A, B, and C were 0.69 ± 0.13, 0.41 ± 0.13 and 0.68 ± 0.15, respectively. The CI of plan B was the lowest and had statistical dif- ference compared to the reference Plan A (P = 0.000). Plan C and Plan A has no statistical difference (P = 0.807). More detailed comparisons of the three plans are presented in Table 3. The OAR analysis is presented in Table 4, Figure 1, and Figure 2. The results showed that the lung V5(%), V10(%), V20(%), V30(%), and mean lung dose (MLD) (cGy) of reference Plan A were 42.33 ± 8.24, 29.65 ± 8.57, 15.71 ± 4.42, 7.66 ± 4.74, and 882.70 ± 191.83, respectively. The results were consistent with the finding from the isodose distribution as lung V5(%), V10(%), V20(%), V30(%), and MLD (cGy) were reduced to 16.27, 10.59, 5.81, 2.35 and 248 using the Plan B (P < 0.000). Table 5 shows the dosimetric results of the heart. The V30(%),V40(%), V45(%), V50(%), V55(%), and MLD (cGy) of Plan A were 19.00 ± 10.23, 13.00 ± 11.98, 9.09 ± 9.35, 5.88 ± 6.46, 3.30 ± 5.02, and 1729.71 ± 1025.13, respec- tively. Compared to these values in Plan A, the Plans B had an increase of 11.05 for V30(%), 9.79 for V40(%), 7.84 for V45(%), 5.86 for V50(%), 4 for V55(%), and 626.94 for MLD with statistical significance (P < 0.05). Additionally, when compared to the Plan A, the Plan C also showed an increment in V30(%), V40(%), V45(%), but not in V50(%), V55(%), and MLD when a non coplanar field was used. The spinal cord D1cc(cGy)of reference Plan A was 3127.36 ± 740.8. Compared to Plan A, both the Plan B and C had slightly higher dose; however, all sets of plans had D1cc ≦ 4500 cGy for the spinal cord. 4. Discussion In external beam radiation therapy, the choice of beam parameters plays an important role when we optimize the IMRT treatment plan. The selection of beam angle is par- ticularly important as the beam angle directly affects the patient setup and treatment plan quality, especially in the cases where the tumor target is wrapped around multiple OARs [5]. Beam angle selection in IMRT plan optimization has been investigated by several institutions [5-8]. Allen [9] and Tucker [10] reported that non-coplanar IMRT significantly can improve the dose distribution when tumor is close to the spinal cord. Bedford et al. [11] reported that the use of inverse planning algorithm to generate 3 to 6 beam non-coplanar plans without intensity-modulation could provide better rectal sparing in conformal prostate plan compared to a three-field coplanar plan. Olivier et al. [12] 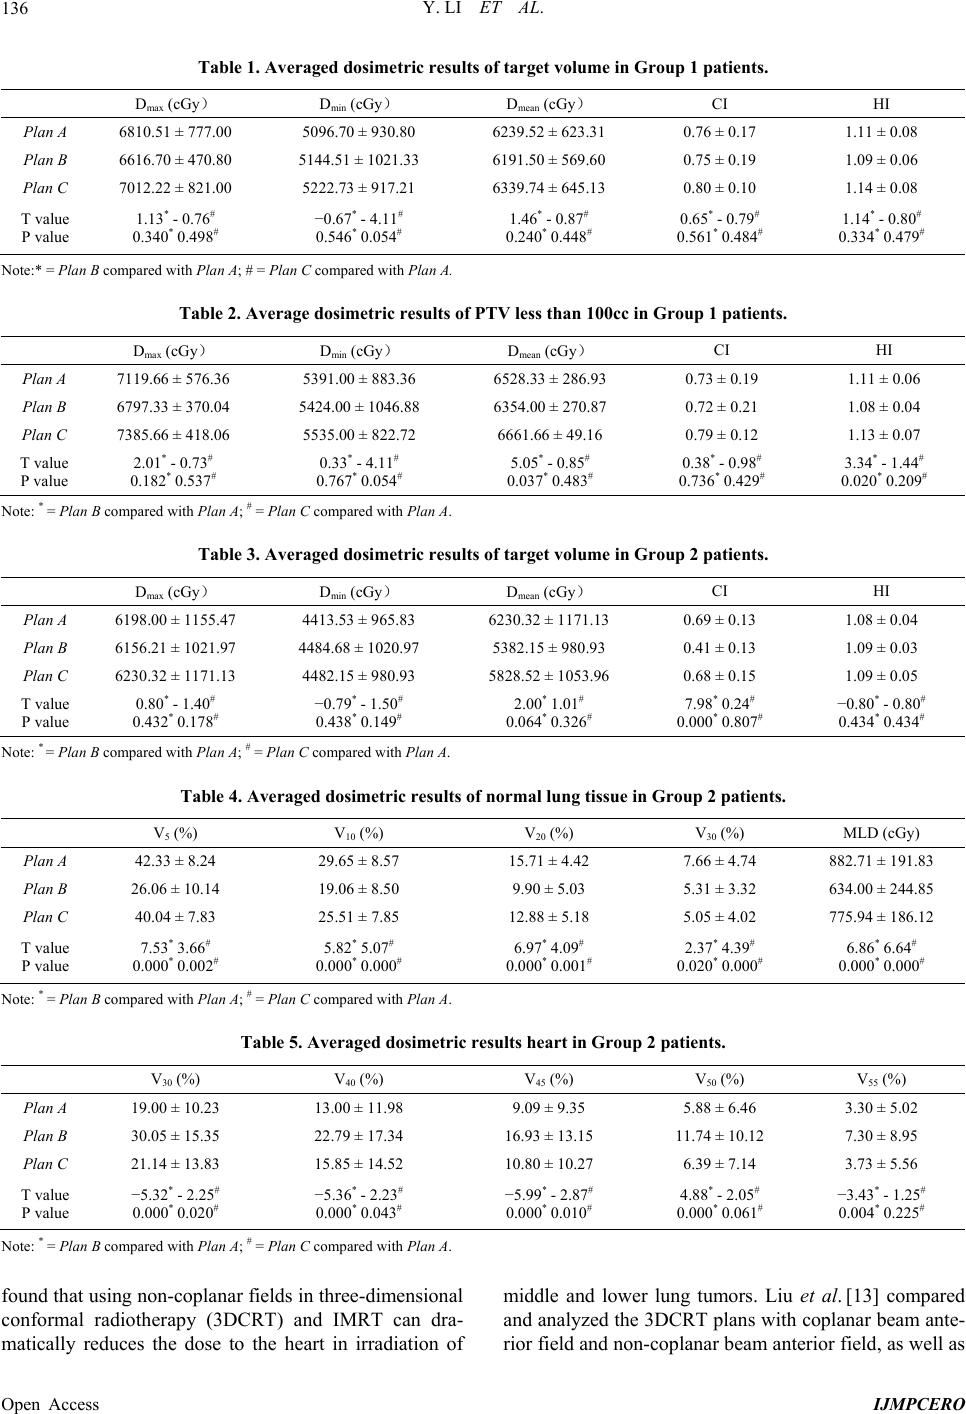 Y. LI ET AL. Open Access IJMPCERO 136 Table 1. Averaged dosimetric results of target volume in Group 1 patients. Dmax (cGy) D min (cGy) D mean (cGy) CI HI Plan A 6810.51 ± 777.00 5096.70 ± 930.80 6239.52 ± 623.31 0.76 ± 0.17 1.11 ± 0.08 Plan B 6616.70 ± 470.80 5144.51 ± 1021.33 6191.50 ± 569.60 0.75 ± 0.19 1.09 ± 0.06 Plan C 7012.22 ± 821.00 5222.73 ± 917.21 6339.74 ± 645.13 0.80 ± 0.10 1.14 ± 0.08 T value P value 1.13* - 0.76# 0.340* 0.498# −0.67* - 4.11# 0.546* 0.054# 1.46* - 0.87# 0.240* 0.448# 0.65* - 0.79# 0.561* 0.484# 1.14* - 0.80# 0.334* 0.479# Note:* = P l an B compared with Plan A; # = Plan C compared with Plan A. Table 2. Average dosimetric results of PTV less than 100cc in Group 1 patients. Dmax (cGy) D min (cGy) D mean (cGy) CI HI Plan A 7119.66 ± 576.36 5391.00 ± 883.36 6528.33 ± 286.93 0.73 ± 0.19 1.11 ± 0.06 Plan B 6797.33 ± 370.04 5424.00 ± 1046.88 6354.00 ± 270.87 0.72 ± 0.21 1.08 ± 0.04 Plan C 7385.66 ± 418.06 5535.00 ± 822.72 6661.66 ± 49.16 0.79 ± 0.12 1.13 ± 0.07 T value P value 2.01* - 0.73# 0.182* 0.537# 0.33* - 4.11# 0.767* 0.054# 5.05* - 0.85# 0.037* 0.483# 0.38* - 0.98# 0.736* 0.429# 3.34* - 1.44# 0.020* 0.209# Note: * = Pl an B compared with Plan A; # = P l an C compared with Plan A. Table 3. Averaged dosimetric results of target volume in Group 2 patients. Dmax (cGy) D min (cGy) D mean (cGy) CI HI Plan A 6198.00 ± 1155.47 4413.53 ± 965.83 6230.32 ± 1171.13 0.69 ± 0.13 1.08 ± 0.04 Plan B 6156.21 ± 1021.97 4484.68 ± 1020.97 5382.15 ± 980.93 0.41 ± 0.13 1.09 ± 0.03 Plan C 6230.32 ± 1171.13 4482.15 ± 980.93 5828.52 ± 1053.96 0.68 ± 0.15 1.09 ± 0.05 T value P value 0.80* - 1.40# 0.432* 0.178# −0.79* - 1.50# 0.438* 0.149# 2.00* 1.01# 0.064* 0.326# 7.98* 0.24# 0.000* 0.807# −0.80* - 0.80# 0.434* 0.434# Note: * = Plan B compared with Plan A; # = Plan C compared with Plan A. Table 4. Averaged dosimetric results of normal lung tissue in Group 2 patients. V 5 (%) V10 (%) V20 (%) V30 (%) MLD (cGy) Plan A 42.33 ± 8.24 29.65 ± 8.57 15.71 ± 4.42 7.66 ± 4.74 882.71 ± 191.83 Plan B 26.06 ± 10.14 19.06 ± 8.50 9.90 ± 5.03 5.31 ± 3.32 634.00 ± 244.85 Plan C 40.04 ± 7.83 25.51 ± 7.85 12.88 ± 5.18 5.05 ± 4.02 775.94 ± 186.12 T value P value 7.53* 3.66# 0.000* 0.002# 5.82* 5.07# 0.000* 0.000# 6.97* 4.09# 0.000* 0.001# 2.37* 4.39# 0.020* 0.000# 6.86* 6.64# 0.000* 0.000# Note: * = Pl an B compared with Plan A; # = Pl an C compared with Plan A. Table 5. Averaged dosimetric results hear t in Group 2 patients. V 30 (%) V40 (%) V45 (%) V50 (%) V55 (%) Plan A 19.00 ± 10.23 13.00 ± 11.98 9.09 ± 9.35 5.88 ± 6.46 3.30 ± 5.02 Plan B 30.05 ± 15.35 22.79 ± 17.34 16.93 ± 13.15 11.74 ± 10.12 7.30 ± 8.95 Plan C 21.14 ± 13.83 15.85 ± 14.52 10.80 ± 10.27 6.39 ± 7.14 3.73 ± 5.56 T value P value −5.32* - 2.25# 0.000* 0.020# −5.36* - 2.23# 0.000* 0.043# −5.99* - 2.87# 0.000* 0.010# 4.88* - 2.05# 0.000* 0.061# −3.43* - 1.25# 0.004* 0.225# Note: * = Pl an B compared with Plan A; # = Pl an C compared with Plan A. found that using non-coplanar fields in three-dimensional conformal radiotherapy (3DCRT) and IMRT can dra- matically reduces the dose to the heart in irradiation of middle and lower lung tumors. Liu et al. [13] compared and analyzed the 3DCRT plans with coplanar beam ante- rior field and non-coplanar beam anterior field, as well as 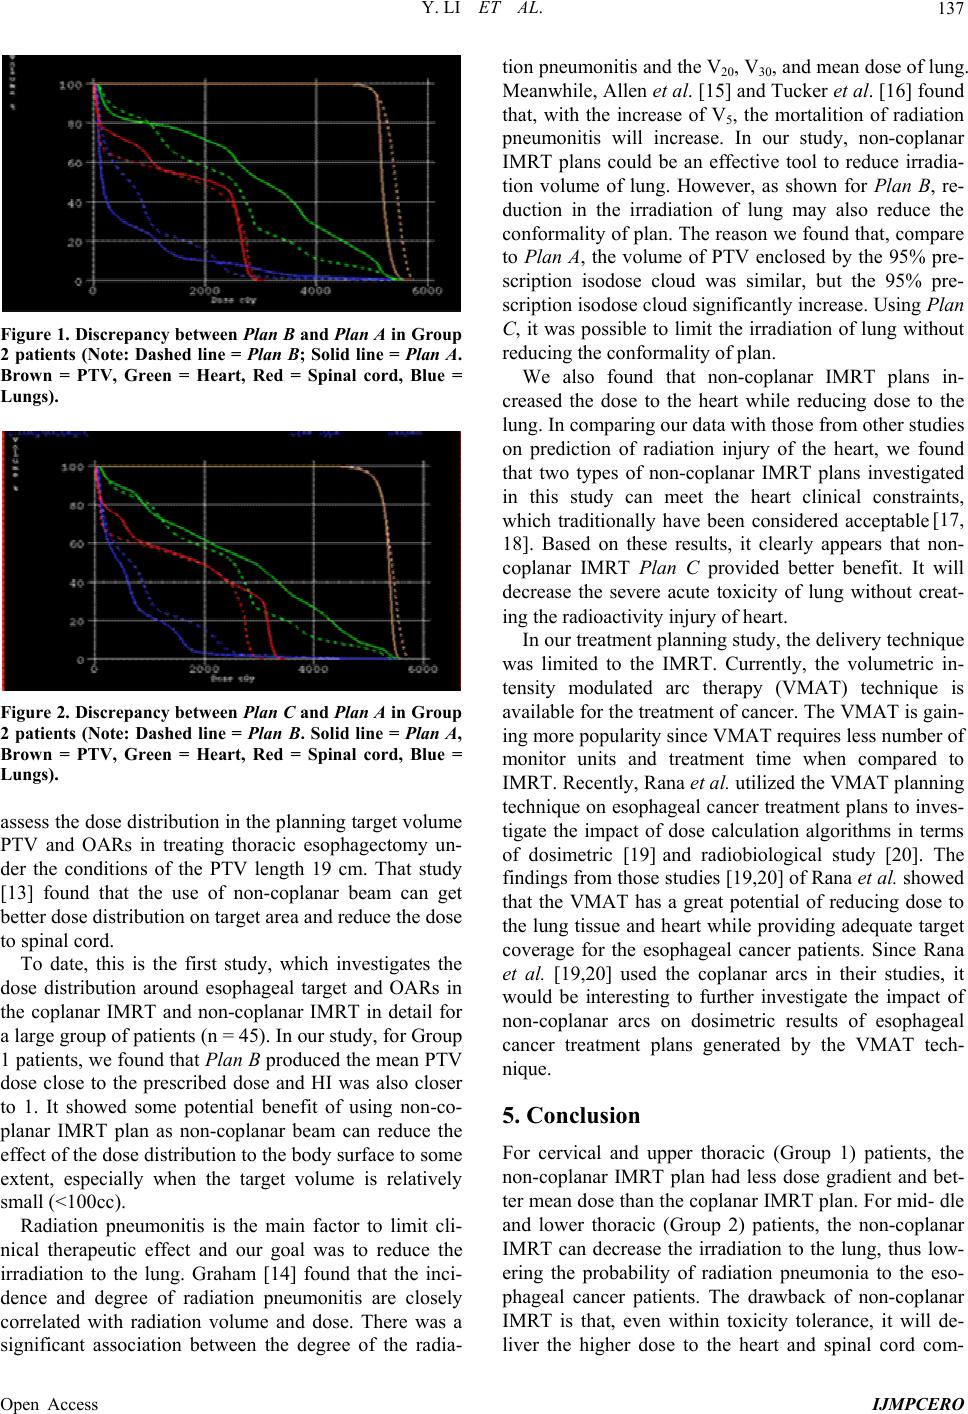 Y. LI ET AL. Open Access IJMPCERO 137 Figure 1. Discrepancy be tween Plan B and Plan A in Group 2 patients (Note: Dashed line = Plan B; Solid line = Plan A. Brown = PTV, Green = Heart, Red = Spinal cord, Blue = Lungs). Figure 2. Discrepancy be tween Plan C and Plan A in Group 2 patients (Note: Dashed line = Plan B. Solid line = Plan A, Brown = PTV, Green = Heart, Red = Spinal cord, Blue = Lungs). assess the dose distribution in the planning target volume PTV and OARs in treating thoracic esophagectomy un- der the conditions of the PTV length 19 cm. That study [13] found that the use of non-coplanar beam can get better dose distribution on target area and reduce the dose to spinal cord. To date, this is the first study, which investigates the dose distribution around esophageal target and OARs in the coplanar IMRT and non-coplanar IMRT in detail for a large group of patients (n = 45). In our study, for Group 1 patients, we found that Plan B produced the mean PTV dose close to the prescribed dose and HI was also closer to 1. It showed some potential benefit of using non-co- planar IMRT plan as non-coplanar beam can reduce the effect of the dose distribution to the body surface to some extent, especially when the target volume is relatively small (<100cc). Radiation pneumonitis is the main factor to limit cli- nical therapeutic effect and our goal was to reduce the irradiation to the lung. Graham [14] found that the inci- dence and degree of radiation pneumonitis are closely correlated with radiation volume and dose. There was a significant association between the degree of the radia- tion pneumonitis and the V20, V30, and mean dose of lung. Meanwhile, Allen et al. [15] and Tucker et al. [16] found that, with the increase of V5, the mortalition of radiation pneumonitis will increase. In our study, non-coplanar IMRT plans could be an effective tool to reduce irradia- tion volume of lung. However, as shown for Plan B, re- duction in the irradiation of lung may also reduce the conformality of plan. The reason we found that, compare to Plan A, the volume of PTV enclosed by the 95% pre- scription isodose cloud was similar, but the 95% pre- scription isodose cloud significantly increase. Using Plan C, it was possible to limit the irradiation of lung without reducing the conformality of plan. We also found that non-coplanar IMRT plans in- creased the dose to the heart while reducing dose to the lung. In comparing our data with those from other studies on prediction of radiation injury of the heart, we found that two types of non-coplanar IMRT plans investigated in this study can meet the heart clinical constraints, which traditionally have been considered acceptable [17, 18]. Based on these results, it clearly appears that non- coplanar IMRT Plan C provided better benefit. It will decrease the severe acute toxicity of lung without creat- ing the radioactivity injury of heart. In our treatment planning study, the delivery technique was limited to the IMRT. Currently, the volumetric in- tensity modulated arc therapy (VMAT) technique is available for the treatment of cancer. The VMAT is gain- ing more popularity since VMAT requires less number of monitor units and treatment time when compared to IMRT. Recently, Rana et al. utilized the VMAT planning technique on esophageal cancer treatment plans to inves- tigate the impact of dose calculation algorithms in terms of dosimetric [19] and radiobiological study [20]. The findings from those studies [19,20] of Rana et al. showed that the VMAT has a great potential of reducing dose to the lung tissue and heart while providing adequate target coverage for the esophageal cancer patients. Since Rana et al. [19,20] used the coplanar arcs in their studies, it would be interesting to further investigate the impact of non-coplanar arcs on dosimetric results of esophageal cancer treatment plans generated by the VMAT tech- nique. 5. Conclusion For cervical and upper thoracic (Group 1) patients, the non-coplanar IMRT plan had less dose gradient and bet- ter mean dose than the coplanar IMRT plan. For mid- dle and lower thoracic (Group 2) patients, the non-coplanar IMRT can decrease the irradiation to the lung, thus low- ering the probability of radiation pneumonia to the eso- phageal cancer patients. The drawback of non-coplanar IMRT is that, even within toxicity tolerance, it will de- liver the higher dose to the heart and spinal cord com- 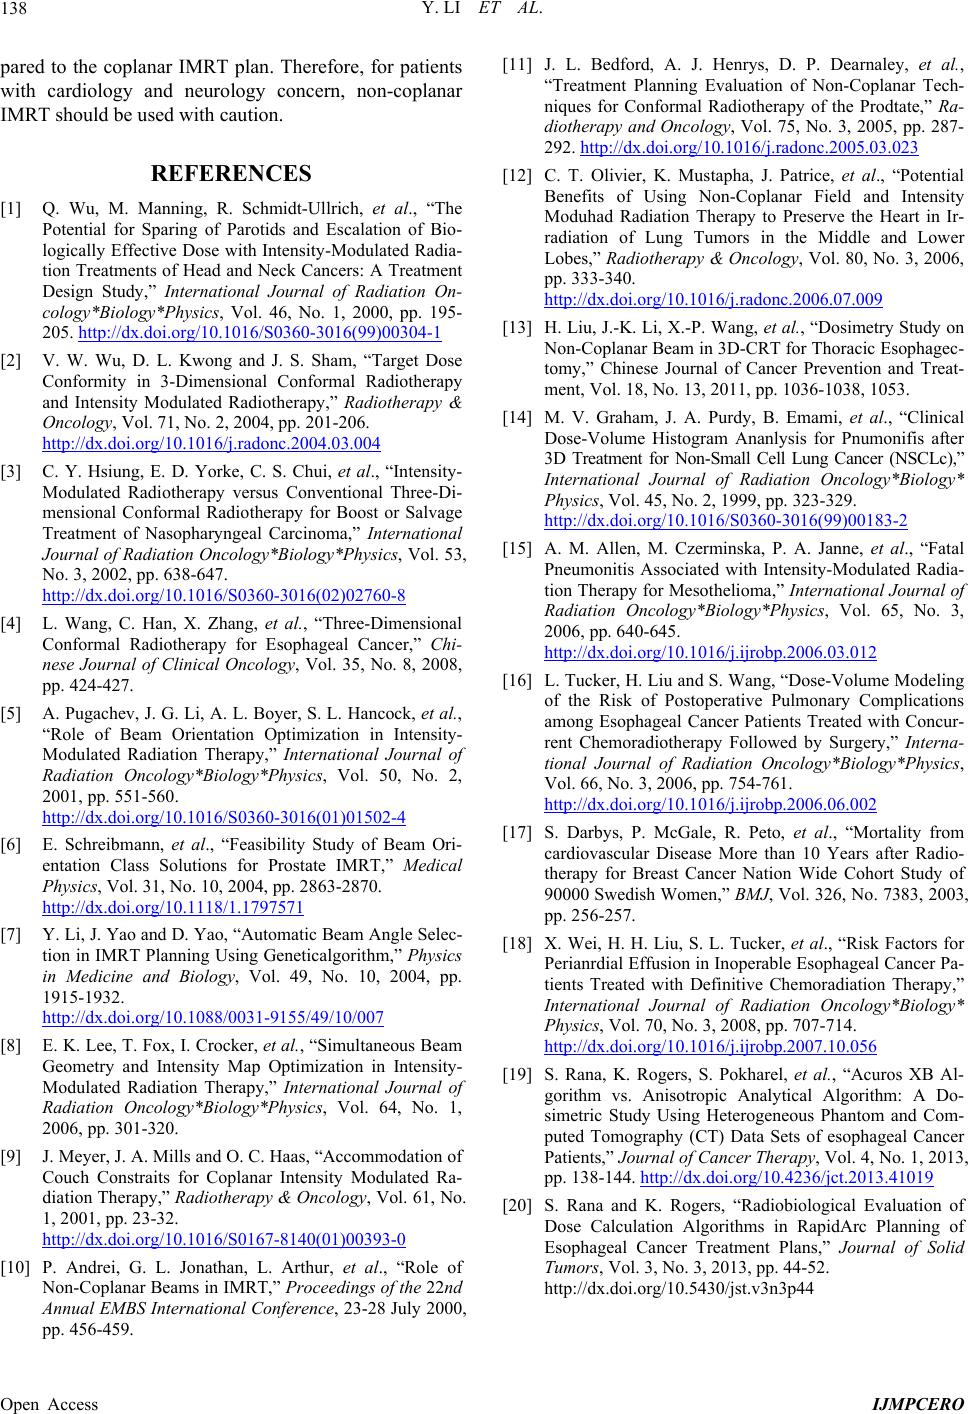 Y. LI ET AL. Open Access IJMPCERO 138 pared to the coplanar IMRT plan. Therefore, for patients with cardiology and neurology concern, non-coplanar IMRT should be used with caution. REFERENCES [1] Q. Wu, M. Manning, R. Schmidt-Ullrich, et al., “The Potential for Sparing of Parotids and Escalation of Bio- logically Effective Dose with Intensity-Modulated Radia- tion Treatments of Head and Neck Cancers: A Treatment Design Study,” International Journal of Radiation On- colo gy*Biol ogy*Physi cs, Vol. 46, No. 1, 2000, pp. 195- 205. http://dx.doi.org/10.1016/S0360-3016(99)00304-1 [2] V. W. Wu, D. L. Kwong and J. S. Sham, “Target Dose Conformity in 3-Dimensional Conformal Radiotherapy and Intensity Modulated Radiotherapy,” Radiotherapy & Oncology, Vol. 71, No. 2, 2004, pp. 201-206. http://dx.doi.org/10.1016/j.radonc.2004.03.004 [3] C. Y. Hsiung, E. D. Yorke, C. S. Chui, et al., “Intensity- Modulated Radiotherapy versus Conventional Three-Di- mensional Conformal Radiotherapy for Boost or Salvage Treatment of Nasopharyngeal Carcinoma,” International Journal of Radiation Oncology*Biology*Physics, Vol. 53, No. 3, 2002, pp. 638-647. http://dx.doi.org/10.1016/S0360-3016(02)02760-8 [4] L. Wang, C. Han, X. Zhang, et al., “Three-Dimensional Conformal Radiotherapy for Esophageal Cancer,” Chi- nese Journal of Clinical Oncology, Vol. 35, No. 8, 2008, pp. 424-427. [5] A. Pugachev, J. G. Li, A. L. Boyer, S. L. Hancock, et al., “Role of Beam Orientation Optimization in Intensity- Modulated Radiation Therapy,” International Journal of Radiation Oncology*Biology*Physics, Vol. 50, No. 2, 2001, pp. 551-560. http://dx.doi.org/10.1016/S0360-3016(01)01502-4 [6] E. Schreibmann, et al., “Feasibility Study of Beam Ori- entation Class Solutions for Prostate IMRT,” Medical Physics, Vol. 31, No. 10, 2004, pp. 2863-2870. http://dx.doi.org/10.1118/1.1797571 [7] Y. Li, J. Yao and D. Yao, “Automatic Beam Angle Selec- tion in IMRT Planning Using Geneticalgorithm,” Physics in Medicine and Biology, Vol. 49, No. 10, 2004, pp. 1915-1932. http://dx.doi.org/10.1088/0031-9155/49/10/007 [8] E. K. Lee, T. Fox, I. Crocker, et al., “Simultaneous Beam Geometry and Intensity Map Optimization in Intensity- Modulated Radiation Therapy,” International Journal of Radiation Oncology*Biology*Physics, Vol. 64, No. 1, 2006, pp. 301-320. [9] J. Meyer, J. A. Mills and O. C. Haas, “Accommodation of Couch Constraits for Coplanar Intensity Modulated Ra- diation Therapy,” Radiotherapy & Oncology, Vol. 61, No. 1, 2001, pp. 23-32. http://dx.doi.org/10.1016/S0167-8140(01)00393-0 [10] P. Andrei, G. L. Jonathan, L. Arthur, et al., “Role of Non-Coplanar Beams in IMRT,” Proceedings of the 22nd Annual EMBS International Conference, 23-28 July 2000, pp. 456-459. [11] J. L. Bedford, A. J. Henrys, D. P. Dearnaley, et al., “Treatment Planning Evaluation of Non-Coplanar Tech- niques for Conformal Radiotherapy of the Prodtate,” Ra- diotherapy and Oncology, Vol. 75, No. 3, 2005, pp. 287- 292. http://dx.doi.org/10.1016/j.radonc.2005.03.023 [12] C. T. Olivier, K. Mustapha, J. Patrice, et al., “Potential Benefits of Using Non-Coplanar Field and Intensity Moduhad Radiation Therapy to Preserve the Heart in Ir- radiation of Lung Tumors in the Middle and Lower Lobes,” Radiotherapy & Oncology, Vol. 80, No. 3, 2006, pp. 333-340. http://dx.doi.org/10.1016/j.radonc.2006.07.009 [13] H. Liu, J.-K. Li, X.-P. Wang, et al., “Dosimetry Study on Non-Coplanar Beam in 3D-CRT for Thoracic Esophagec- tomy,” Chinese Journal of Cancer Prevention and Treat- ment, Vol. 18, No. 13, 2011, pp. 1036-1038, 1053. [14] M. V. Graham, J. A. Purdy, B. Emami, et al., “Clinical Dose-Volume Histogram Ananlysis for Pnumonifis after 3D Treatment for Non-Small Cell Lung Cancer (NSCLc),” International Journal of Radiation Oncology*Biology* Physics, Vol. 45, No. 2, 1999, pp. 323-329. http://dx.doi.org/10.1016/S0360-3016(99)00183-2 [15] A. M. Allen, M. Czerminska, P. A. Janne, et al., “Fatal Pneumonitis Associated with Intensity-Modulated Radia- tion Therapy for Mesothelioma,” International Journal of Radiation Oncology*Biology*Physics, Vol. 65, No. 3, 2006, pp. 640-645. http://dx.doi.org/10.1016/j.ijrobp.2006.03.012 [16] L. Tucker, H. Liu and S. Wang, “Dose-Volume Modeling of the Risk of Postoperative Pulmonary Complications among Esophageal Cancer Patients Treated with Concur- rent Chemoradiotherapy Followed by Surgery,” Interna- tional Journal of Radiation Oncology*Biology*Physics, Vol. 66, No. 3, 2006, pp. 754-761. http://dx.doi.org/10.1016/j.ijrobp.2006.06.002 [17] S. Darbys, P. McGale, R. Peto, et al., “Mortality from cardiovascular Disease More than 10 Years after Radio- therapy for Breast Cancer Nation Wide Cohort Study of 90000 Swedish Women,” BMJ, Vol. 326, No. 7383, 2003, pp. 256-257. [18] X. Wei, H. H. Liu, S. L. Tucker, et al., “Risk Factors for Perianrdial Effusion in Inoperable Esophageal Cancer Pa- tients Treated with Definitive Chemoradiation Therapy,” International Journal of Radiation Oncology*Biology* Physics, Vol. 70, No. 3, 2008, pp. 707-714. http://dx.doi.org/10.1016/j.ijrobp.2007.10.056 [19] S. Rana, K. Rogers, S. Pokharel, et al., “Acuros XB Al- gorithm vs. Anisotropic Analytical Algorithm: A Do- simetric Study Using Heterogeneous Phantom and Com- puted Tomography (CT) Data Sets of esophageal Cancer Patients,” Journal of Cancer Therapy, Vol. 4, No. 1, 2013, pp. 138-144. http://dx.doi.org/10.4236/jct.2013.41019 [20] S. Rana and K. Rogers, “Radiobiological Evaluation of Dose Calculation Algorithms in RapidArc Planning of Esophageal Cancer Treatment Plans,” Journal of Solid Tumors, Vol. 3, No. 3, 2013, pp. 44-52. http://dx.doi.org/10.5430/jst.v3n3p44 |